
Hired Farm Labor and the Role of Hispanic Workers
Author(s): Steve Isaacs
Published: October 29th, 2020
Shareable PDF
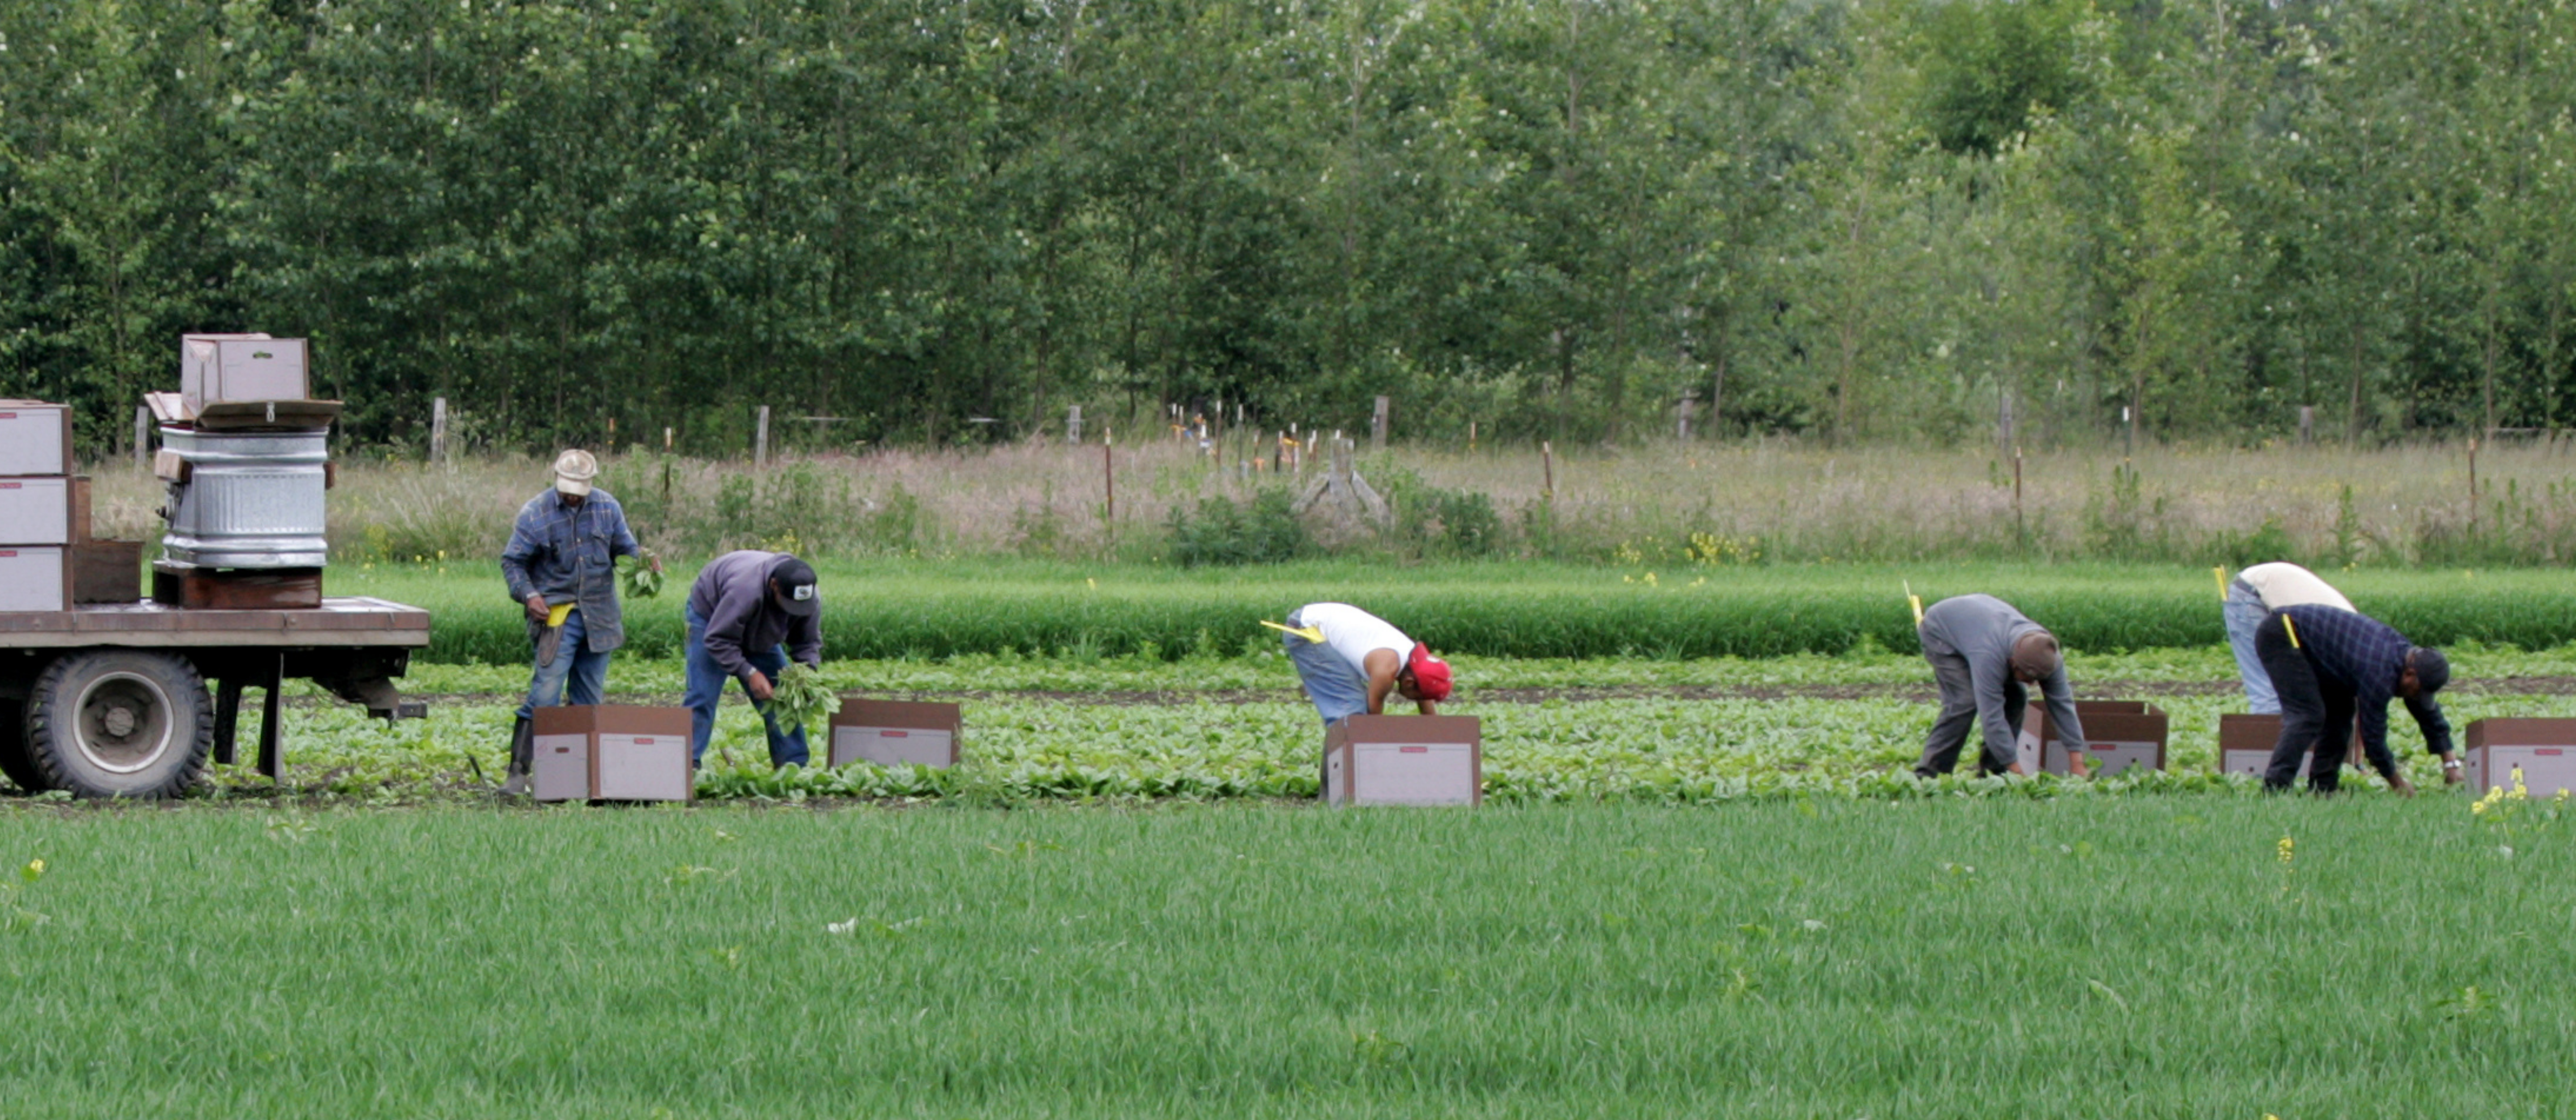
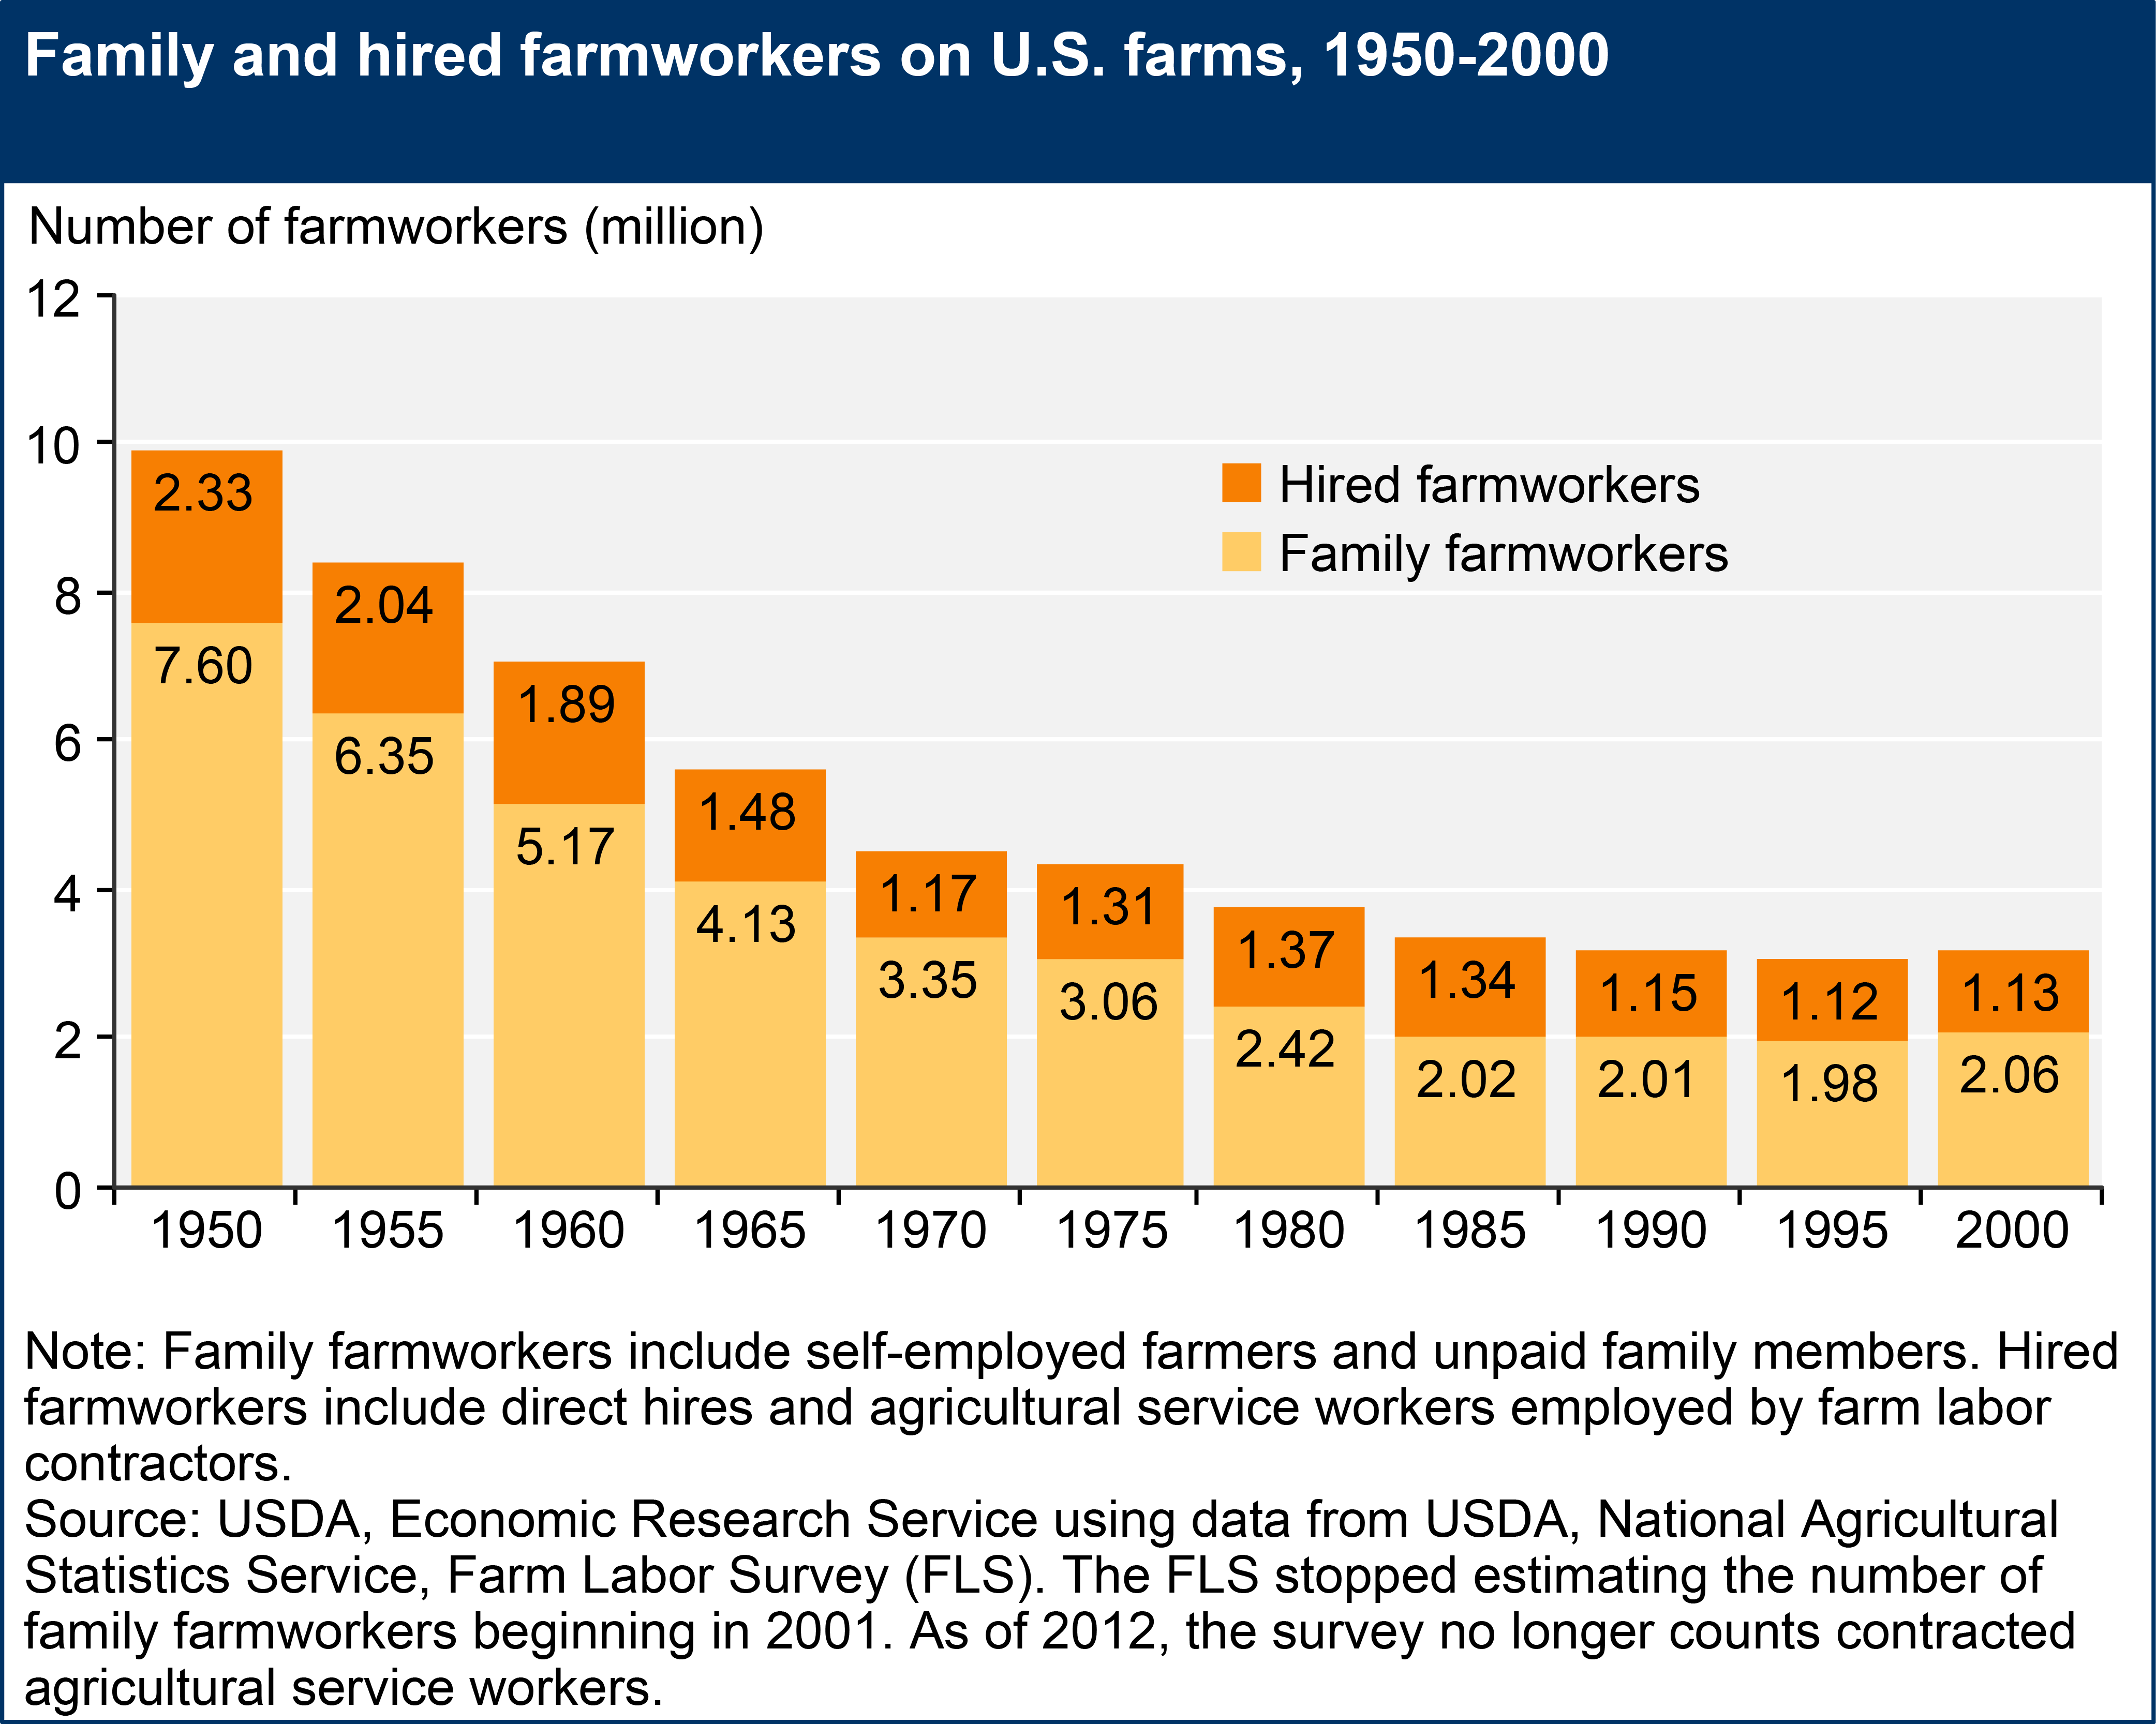
Family members provide about two-thirds of the workers on U.S. farms, but the remaining one-third consists of 1.18 million hired workers. While not an insignificant number, the 1.18 million farmworkers represent less than one percent of the total U.S. wage and salary workers. The Economic Research Service of USDA updates a wide range of information on farm labor periodically. The most recent update was in April 2020. The graphics in this article are from that update.
The observation about families providing two-thirds of workers is an estimate because the Farm Labor Survey has not counted family farmworkers since 2000.
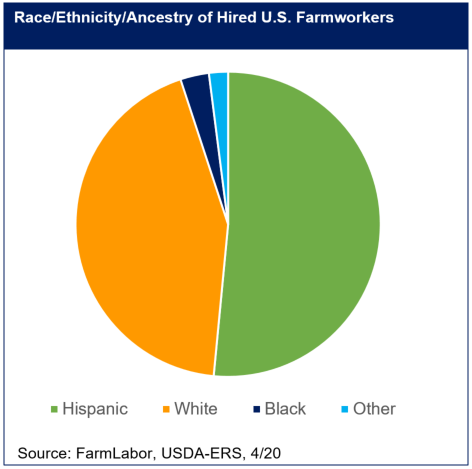
More than half the hired farmworkers (51%) are Hispanic, compared to about one-fifth (19%) of the national workforce. Sixty-four percent of Hispanic workers are classified as laborers and Hispanics account for thirty percent of farm managers, inspectors, and supervisors.
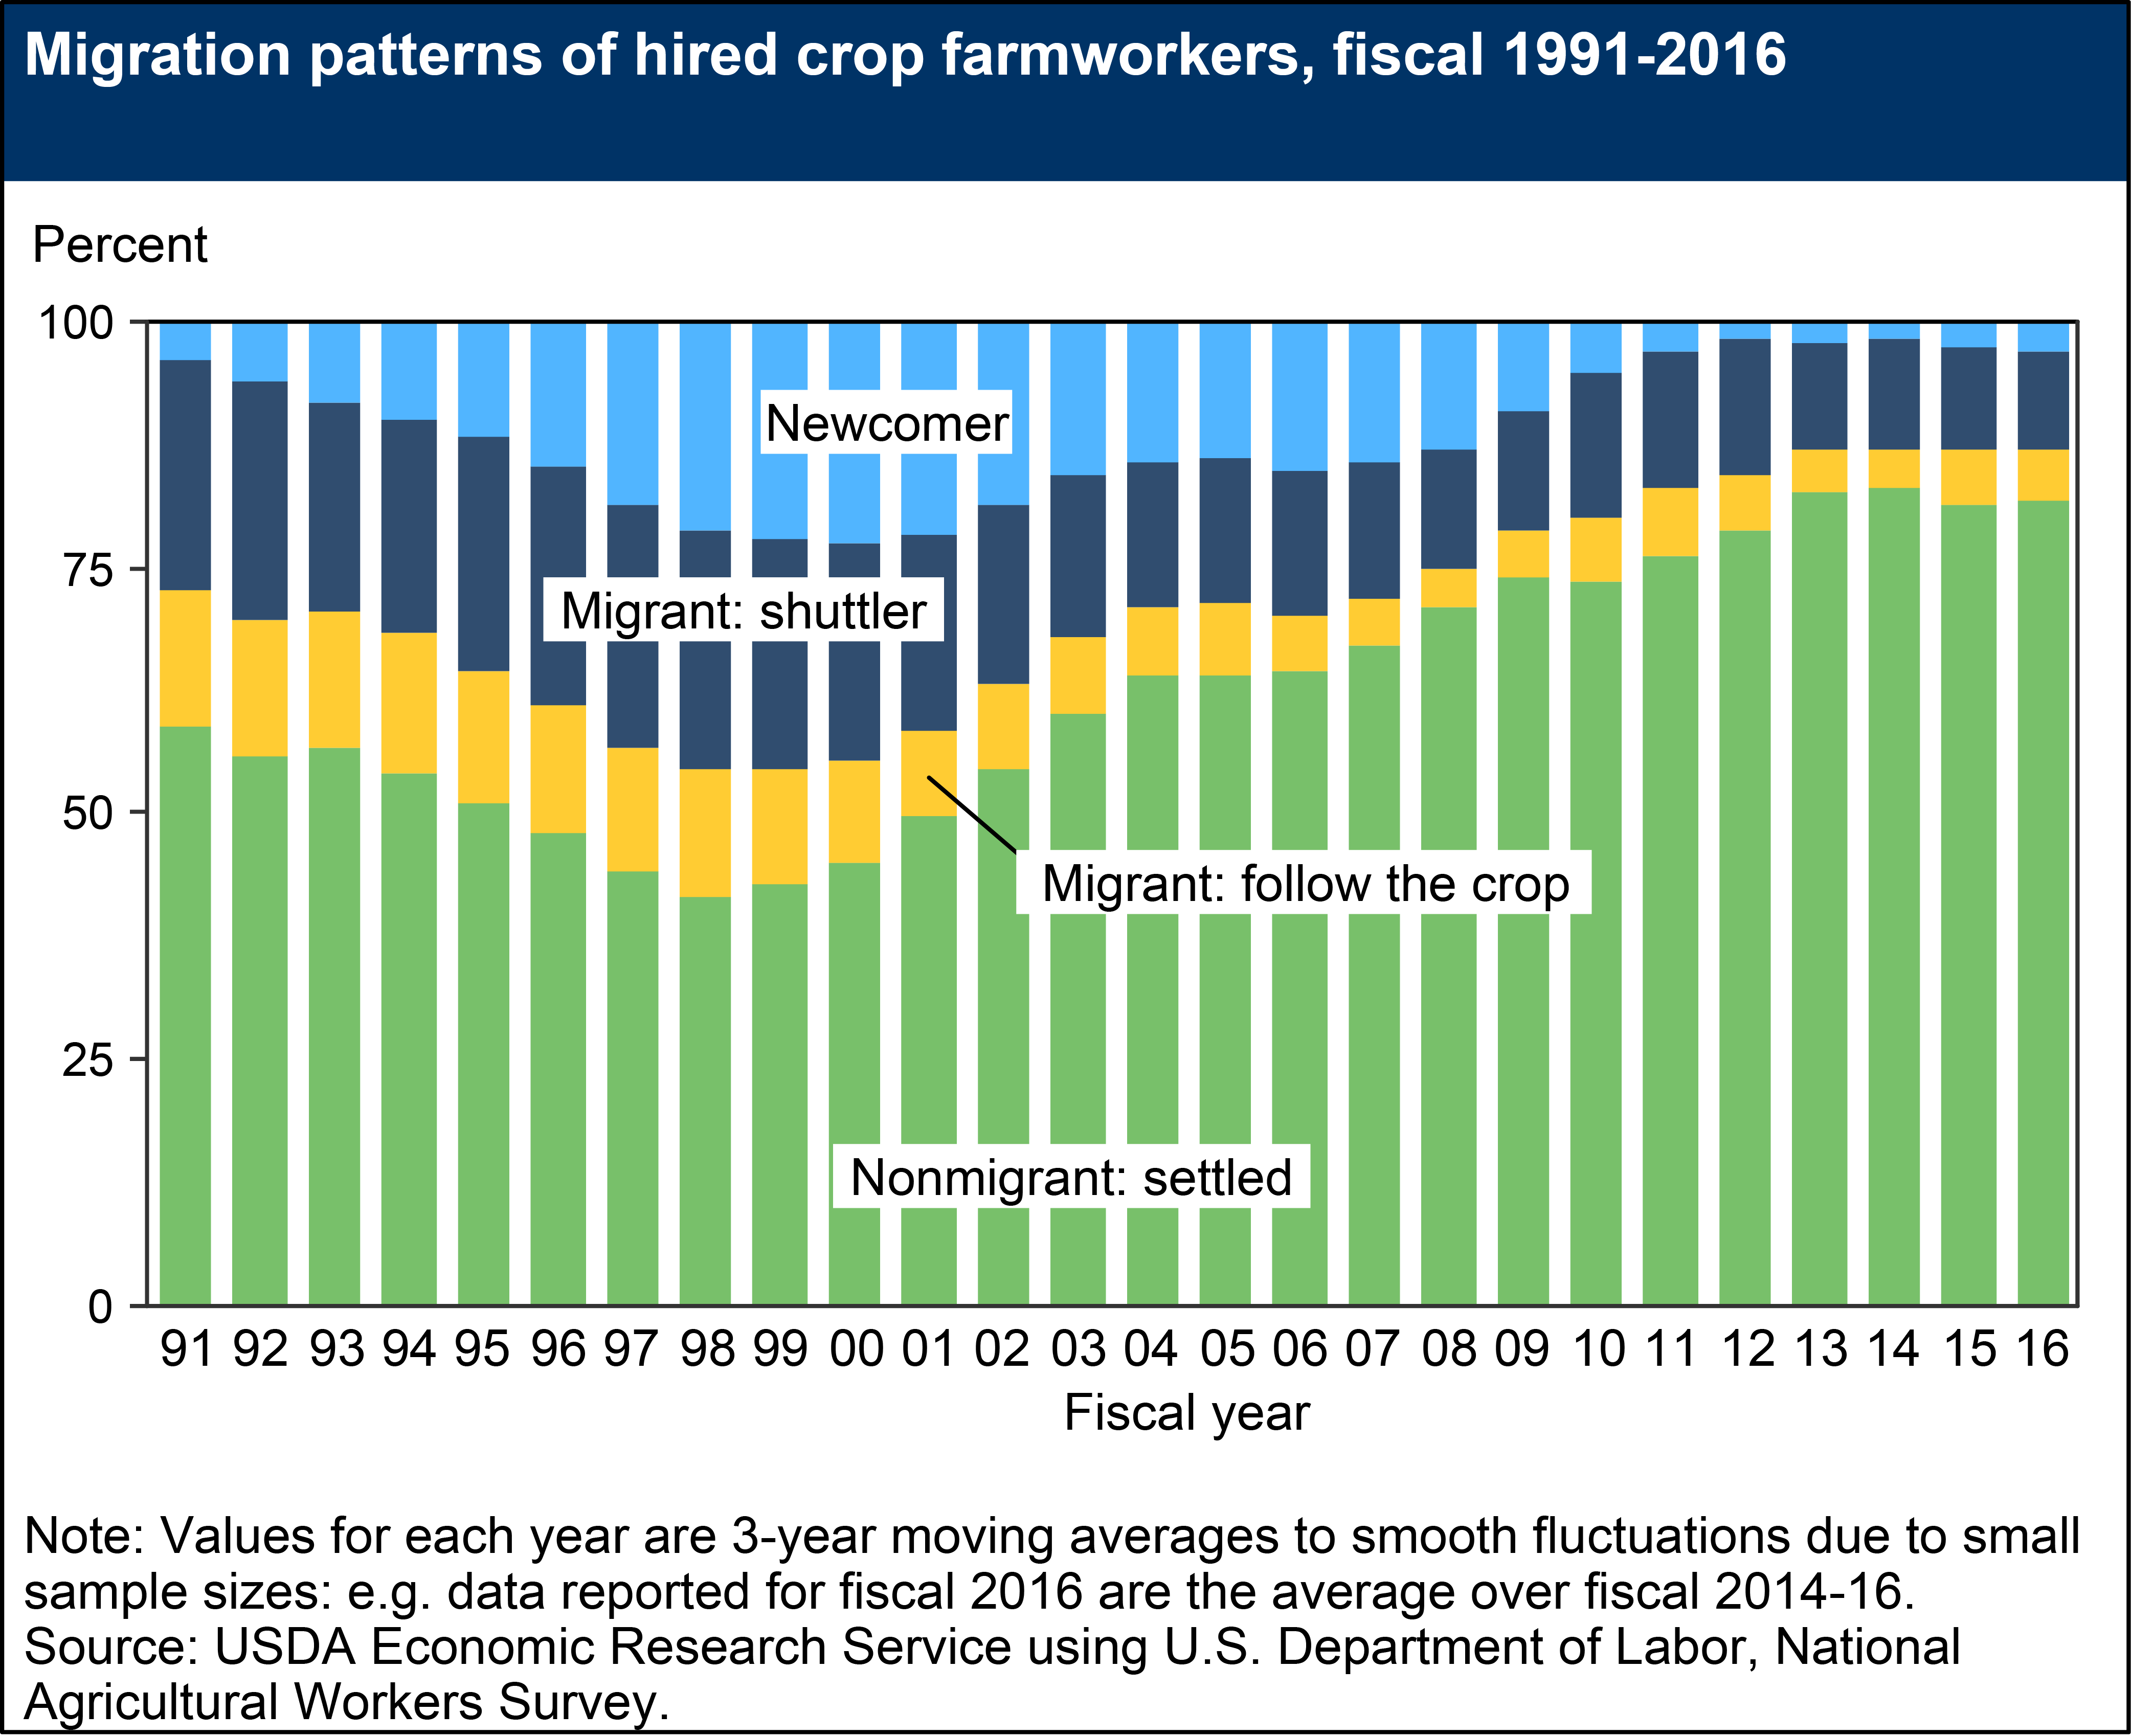
Hispanic farmworkers have traditionally been referred to as “migrant” workers; however, USDA’s Agricultural Workers Survey suggests that migrant workers who follow the crop are actually a rather small portion of the labor force. Well over three-quarters of farmworkers are “Nonmigrant: settled” and only about five percent of workers “follow the crop.” An interesting group of workers is the “shuttlers” who live within 75 miles of the farm where they work. Many of these workers may cross an international border to get to work. During the winter vegetable season, hundreds of busloads of workers cross from Mexico into the US and back on a daily basis.
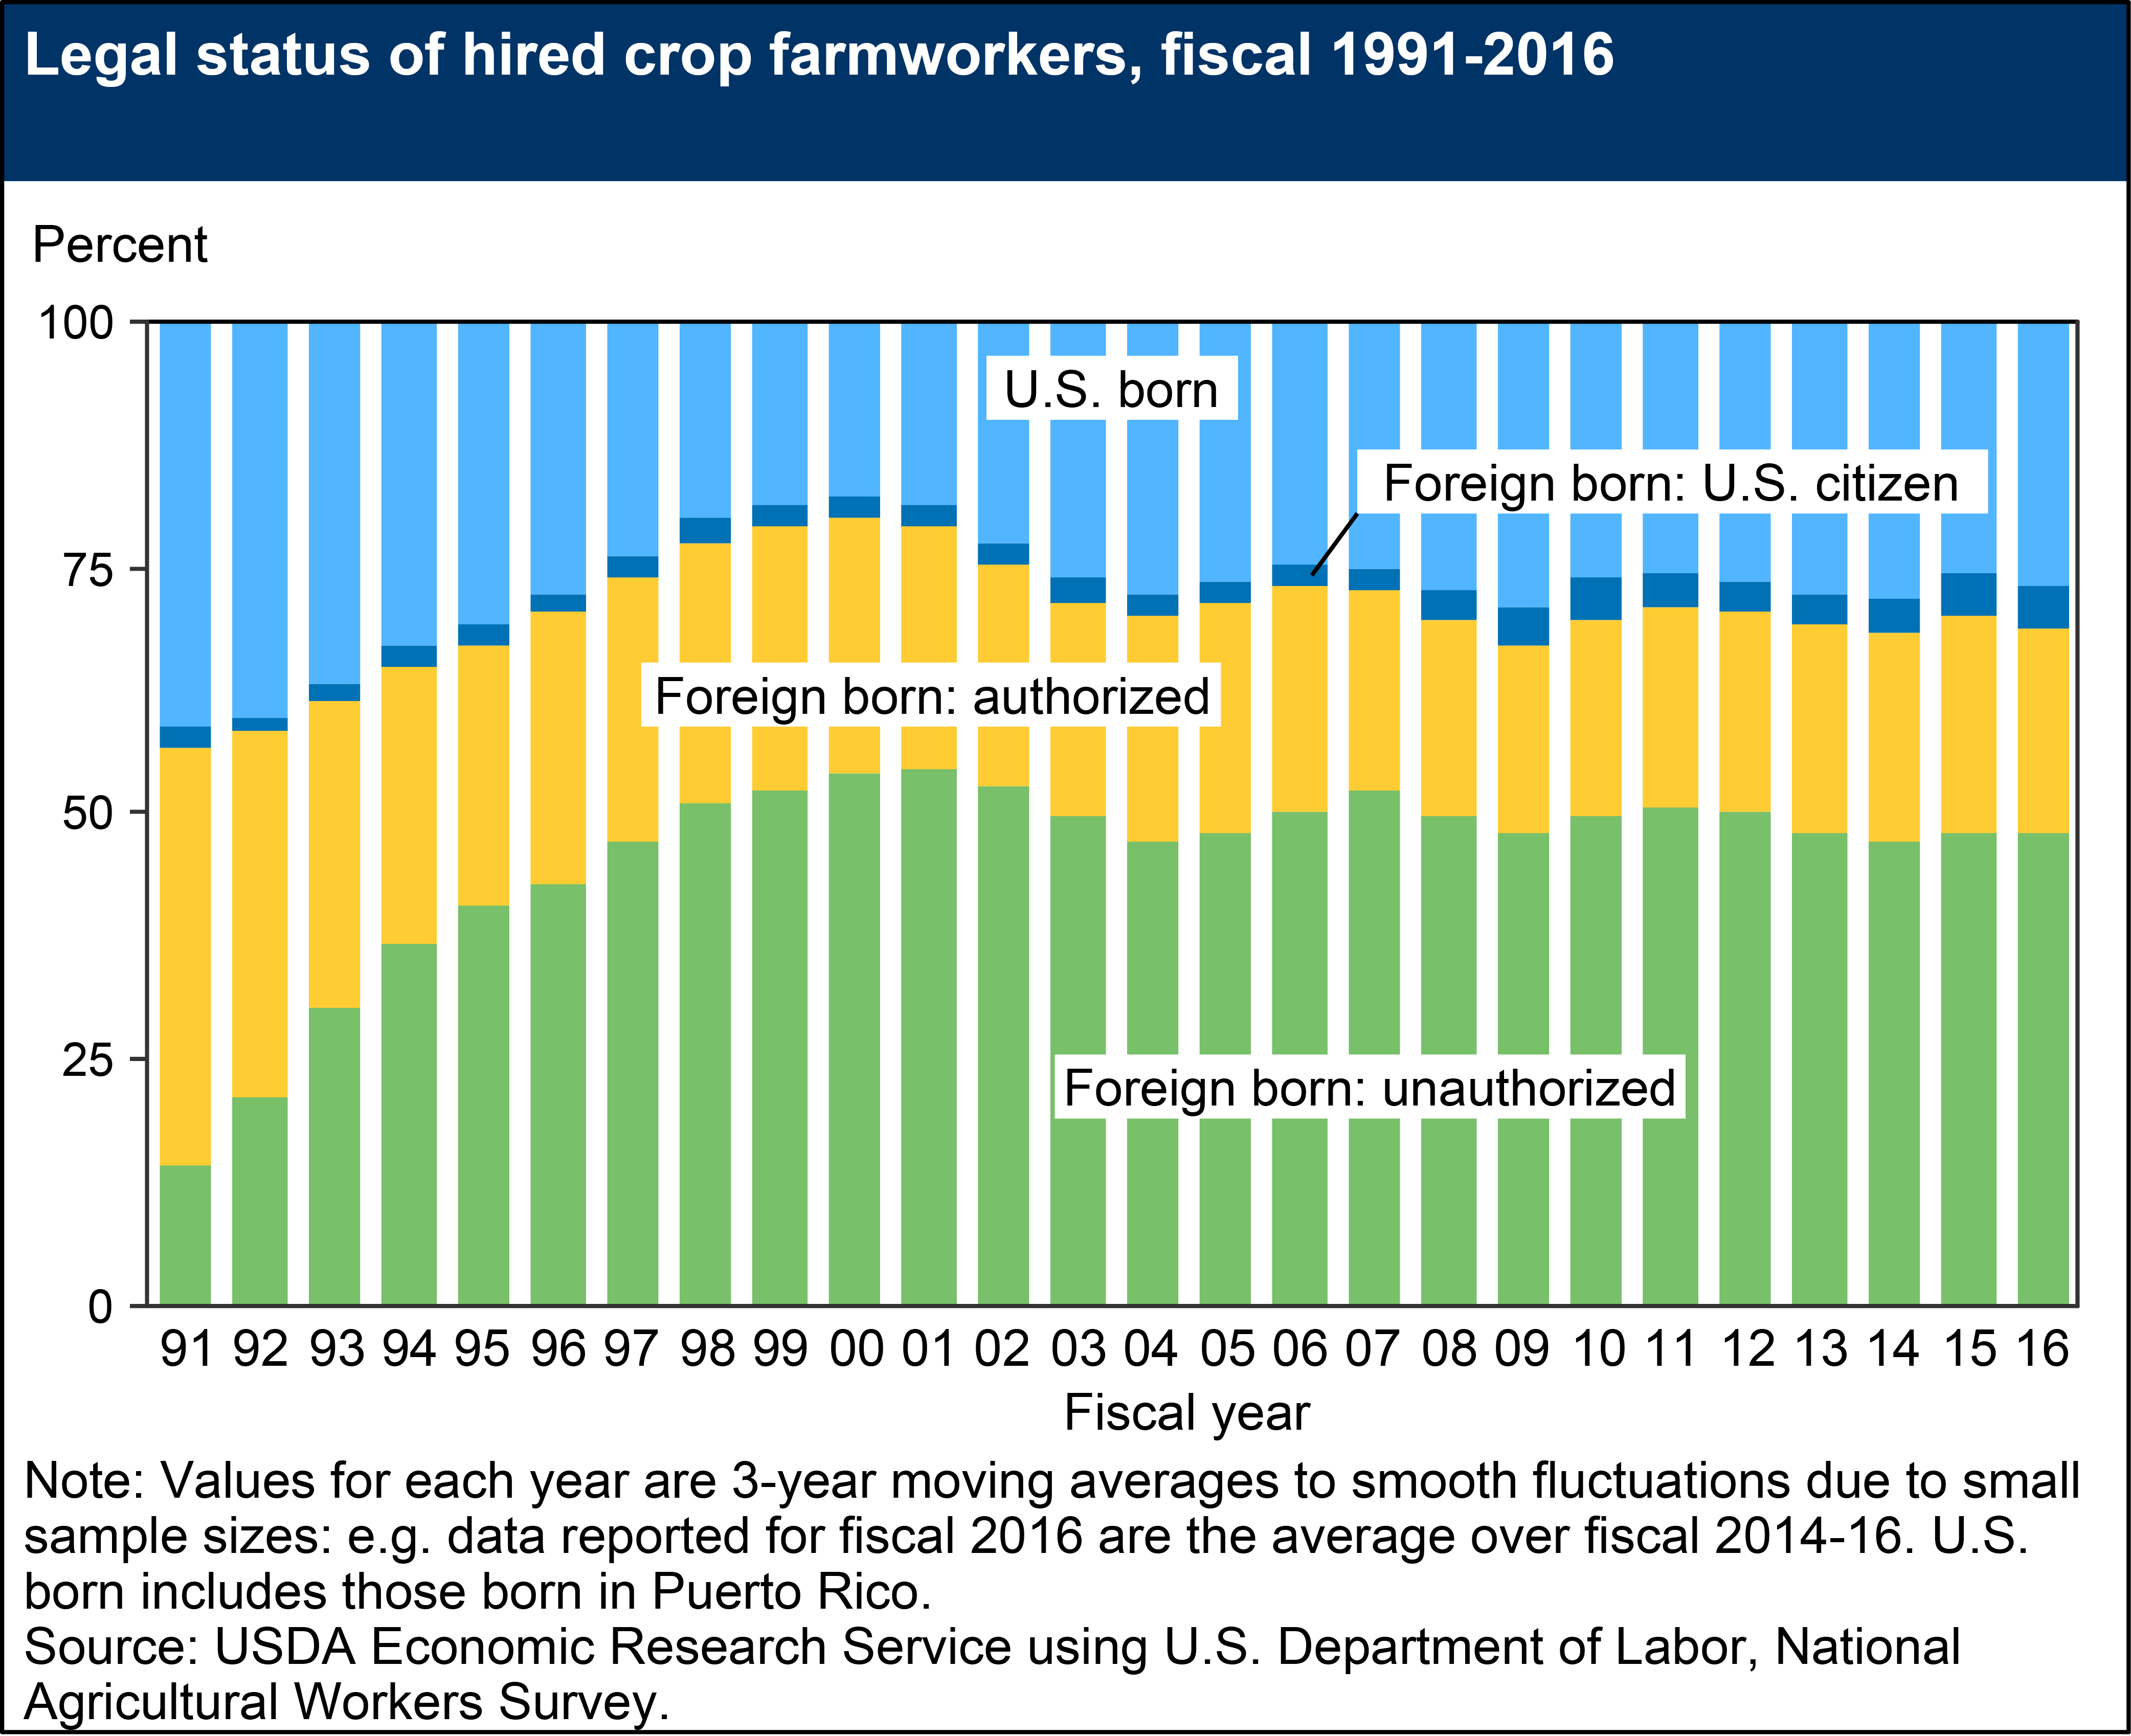
The legal immigration status of hired farmworkers is a topic of much discussion. The Ag Workers Survey suggests that, among crop workers, those with unauthorized status may approach fifty percent with the highest share in California.
American farms are dependent on the Hispanic workforce. Just over half of the hired U.S. farmworkers are Hispanic. The unauthorized status of many of those workers (particularly in the crop sector) creates a dilemma for American agriculture. This dilemma has persisted for decades with no clear resolution in sight.
The Farm Labor publication is the source of this information. These and other topics including wages, demographics, geographic distribution, and considerable information on the H-2A temporary agricultural worker program are covered in the April 2020 update. Additional information on the Hispanic workforce may be found in a US Census brief and the Atlas of Rural and Small Town America.
Author(s) Contact Information:
Steve Isaacs | Extension Professor | sisaacs@uky.edu
Recent Extension Articles
Understanding Commodity Wages
October 29th, 2020
When it comes to paying employees, agriculture producers have a unique flexibility in compensation options that is not available to all employers. Commodity wages are a way to compensate employees without the obligation of many payroll taxes. This can be extremely useful in a situation in which a family member is working for the farming operation; an employee is transitioning into an owner/manager role, or other creative possibilities.
U.S. Agriculture Flirting with an Annual Trade Deficit – First Time in 60 years?
October 29th, 2020
We constantly hear about the relatively large trade deficit that the U.S. economy as a whole faces given our appetite for cheaper products from overseas suppliers, but the counter in agriculture has always been, “well agriculture is much different as our sector enjoys a healthy trade surplus.” This might not be the case in 2020.
Connect with Us
![]()
![]()
![]()
![]()