Inflation – “Good” or “Bad” for Agricultural Producers and Consumers?
Author(s): Will Snell
Published: January 28th, 2022
Shareable PDF
Inflation has been headline news for several months and certainly an issue impacting all businesses, industries, and all of us as consumers.
Economists define inflation as a general rise in prices for a selected market basket of goods and services. The Consumer Price Index (CPI) is regarded as the most quoted and broad measure of inflation. In the United States, the CPI is calculated monthly by the Bureau of Labor Statistics (BLS) based on changes in the prices of thousands of goods and services in major urban areas and retail establishments, ranging from the most reported items such as food and energy, to other more obscure items such as haircuts and funeral expenses. Changes in housing expenses (ranging from buying homes, renting apartments to home improvement expenditures) receive the greatest weight in the U.S. CPI calculation at 42.4%, followed by transportation (15.7%) and food/beverages (15.2%).
I tell my students (generally born around 2000) that they really have never observed much inflation in their lifetimes – until now. From 2000 to 2020, the average annual rate of inflation (seasonally adjusted) was 2.1% which is generally considered by economists and monetary policymakers as a “desirable” level of inflation to help drive consumption and overall economic growth.
Last year the monthly inflation rate averaged just under 5% and in its latest report (January 12, 2022) the BLS indicated that prices over the past 12 months increased 7% -- the largest December to December percent change since 1981. In comparison, the last big surge of inflation was back in the 1970s and early 80s when the U.S economy observed several years of double-digit percentage inflation, which eventually contributed to the crash of the U.S. farm economy in the early to mid-1980s. Alternatively, the annual inflation rate turned negative for a few months in 2009 during the dramatic slowing of the U.S. economy in the midst of the Great Recession which economists label as deflation (Figure 1).
Figure 1: Annualized Rates of Inflation (Monthly CPI data for 1970-2021)
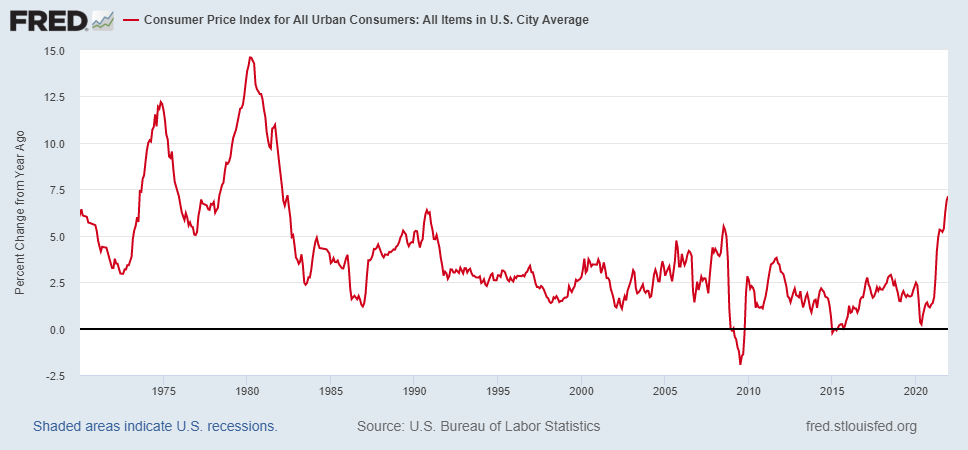
Source: Federal Reserve Economic Data (FRED)
Inflation impacts both producers and consumers. For agriculture, historical data support the hypothesis that commodity prices generally rise during periods of inflation. But so do ag input prices. Higher commodity prices will lead to increased global demand for farm inputs such as seeds, fertilizer, livestock, farm equipment, etc., thus putting upward pressure on input prices, holding all other factors constant. Sustained, “unacceptable” levels of inflation often leads to actions by the Federal Reserve (the central bank of the United States which manages monetary policy)to raise interest rates, resulting in additional cost-push inflation on input costs for businesses that depend a lot on borrowed capital (e.g., agriculture). Higher interest rates can also impact land values, exchange rates, and overall family living expenses – all impacting the overall purchasing power of farm resources.
Figure 2 outlines the relationship of USDA’s index for prices received by farmers for a selected representative group of agricultural commodities, a production cost index for prices paid by farmers on a selected representative group of farm input expenses, and the overall change in prices paid by consumers (i.e., the general inflation rate) over the past 30 years. During this time frame, the average rate of inflation (as measured by the CPI) increased 2.4% annually compared to an average increase of 1.8% annually for farm prices received and a 3% annual increase in the farm prices paid. Alternatively speaking, the data over the past three decades show that on average, the prices paid by U.S. farmers for ag inputs tend to increase more than rate of inflation and more than the prices farmers received for their products. The data also reveal ag prices paid and received tend to be significantly more volatile than the historical change in consumer prices.
Figure 2: USDA Index of Farm Prices Paid and Farm Prices Received vs the Consumer Price Index (CPI), 2011=100
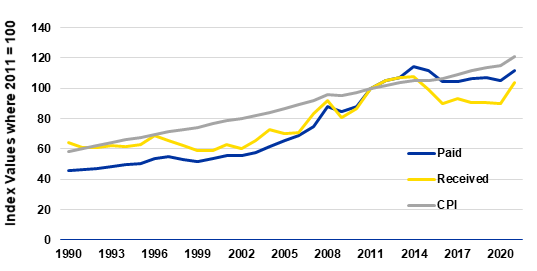
Source: NASS/USDA
Economists measure the statistical relationship of two economic variables by calculating correlation coefficients. Correlation coefficients range from 1, indicating a perfect positive correlation of two variables to -1 indicating a perfect negative correlation. A correlation coefficient equal to zero indicates no statistical relationship between the two variables. Economists are quick to point out that correlation does not imply causation, but still provides a very simple measure of the relationship of two variables over a period of time.
The correlation coefficient between the Index of Farm Prices Received and the CPI from 1990 to 2020 was 0.89 indicating a very strong positive relationship. The correlation coefficient between the Index of Farm Prices Paid and the CPI was even stronger (0.96). Thus, this statistical exercise reveals that both farm commodity prices and farm input prices tend to both follow changes in the rate of general inflation in the economy. However, a check of annual changes in the CPI versus U.S. Net Farm Income from 1990 to 2020 yields virtual no statistical relationship (with the correlation coefficient being 0.001) and is a -0.50 for the past fifty years, indicating that farm income during this period tended to fall during bouts of inflation.
Inflation effectively reduces the so-called purchasing power of both producers and consumers, Economists like to present data in “inflation-adjusted” or “real” terms. If one’s income increases by 3%, but the cost of goods and services in the economy increase by 5%, the employee has experienced a higher “nominal” income, but their purchasing power due to inflation has been eroded. Within ag, most commodity prices have generally declined over time relative to the rate of inflation. However, in many cases, the advancements in yields for crops and pounds of gain for livestock have helped offset the decline in real or inflation-adjusted prices. Of course there are exceptions such as burley tobacco, where the real price of burley has declined from around $2.00/lb in 2004 to approximately $1.40/lb today, while crop yields have trended down. Even with stable yields, burley farmers today would need to receive close to $3.00/lb in the marketplace compared to the $2.05 to $2.10/lb they received on average from the 2021 crop to maintain the same level of purchasing power today compared to prior to the buyout in 2004.
A recent Farmdoc Daily article indicated the strong historic relationship between interest rate movements and inflation – both of which affect farmland values. A simple expression that economists use to provide an estimate of farmland values is: V = R/I, where V is the current (or present) value of a unit of land, R is the expected return per unit of land in each future time period and I is the discount (or interest) rate. Thus economists would say that farmland values are directly correlated with anticipated annual returns and inversely correlated with interest rates. In lay terms, the price of a parcel of land tends to increase in value when the market perceives that future net returns will be higher and tends to fall when the cost of capital is higher, holding all other factors constant.
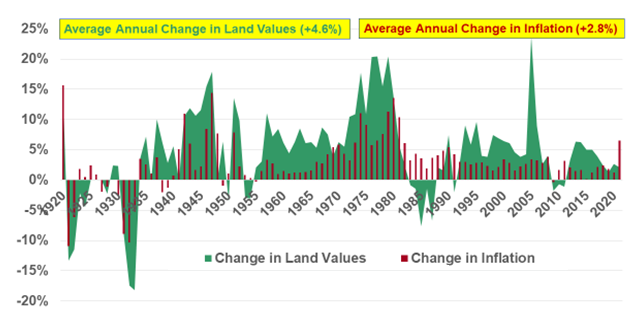
Thus, based on the above discussion, inflation tends to increase both farm returns (positive impact on land values) and interest rates (negative impact on land values). So which one wins out? Since the 1920s, farmland values in Kentucky have increased by an average annual rate of 4.6%, while inflation has increased on average by 2.8% (Figure 3). Consequently, the data verify that the real or inflation-adjusted value of land has increased over time indicating that land values have increased at a greater rate than inflation. This observation has led many to claim that investing in farmland is a good hedge against inflation.
Figure 3: Annual Percentage Changes in Kentucky Farmland Values vs Inflation
Source: Calculations from ERS/USDA data
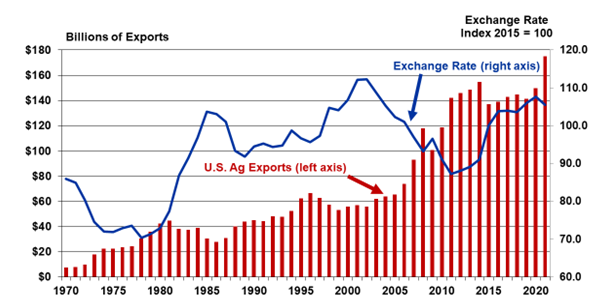
Inflation can also have some direct adverse effects on the cost of selling products in international markets via changes in exchange rates. Sustained and “unacceptable” levels of inflation can lead to increases in the demand for U.S. dollar-denominated financial assets assuming U.S. interest rates increase relative to investment returns on foreign financial assets. This event will tend to increase in the value of the U.S. dollar in foreign exchange markets, which results in buyers outside the United States having to increase the amount of foreign currency needed to exchange into U.S. dollars. The appreciation in the U.S. dollar exchange rate will thus have a tendency to reduce U.S. ag exports, holding all other factors constant. (See early 1980s and the 2015-2020 period in Figure 4.) Alternatively, sustained periods of a depreciated U.S. dollar (such as during decade of the 1970s and the first decade of the 2000s in Figure 4) illustrate a period of significant growth in the value of U.S. ag exports. Of course, many other factors come into play affecting ag exports such as trade relations, weather events, and financial investment returns/inflation in competitor nations.
Figure 4: U.S. Ag Exports vs U.S. Trade Weighted Exchange Rate
Source: FAS/USDA
In summary, the discussion above yields a mixed message on the impact of inflation on U.S. farmers. Inflationary pressure in the economy can put upward pressure on farm commodity prices, but higher commodity prices increase the demand for farm inputs, including the cost of borrowed funds. Historical data clearly shows that inflation tends to boost the value of farm assets such as land, but could hurt U.S. ag exports through its impact on the value of the U.S. dollar. A lot of the effects really depend on the severity and length of “excessive” inflation in the economy and the ultimate change in monetary policy. Also, the outcome may vary depending on whether you are a farmland investor, a permanent landowner, or a land renter, plus one’s dependence on borrowed funds and/or international markets. While it appears the effects of inflation on agriculture can be debated, it is pretty clear that it is bad for consumers (more on that topic next month) and that deflation is bad for the entire economy, including agriculture.
Recommended Citation Format:
Snell, W. “Inflation - "Good" or "Bad" for Agricultural Producers and Consumers?" Economic and Policy Update (22):1, Department of Agricultural Economics, University of Kentucky, January 28th, 2022.
Author(s) Contact Information:
Will Snell | Extension Professor | wsnell@uky.edu
Recent Extension Articles
Price Risk Management Tools for Cattle Producers
January 28th, 2022
The last few years are unlikely to be remembered fondly by many cattle producers. Large cattle supplies, a global pandemic, weather challenges, and a sharp increase in feed prices have all impacted feeder cattle values. As I write this on January 21, 2022, there is more than a $15 per cwt increase in CME© feeder cattle futures from the March contract to the August contract. This article will briefly discuss some tools available to cattle producers should they want to protect themselves from downside price in 2022.
Demand for Certified Kitchen Use Nationally and in Kentucky
January 28th, 2022
Many Certified Kitchens saw a shock to their system and a halting of kitchen rentals and revenue as COVID-19 made its impact. Certified or commercial kitchens, also known as shared use kitchens, are commercially-licensed spaces where producers can prepare their products legally while providing budget and schedule flexibility that small businesses may need. Nationally and locally, these kitchens saw shifts in demand for the use of their space.

