Government Payments 2010-2019
Government Payments 2010-2019
Agricultural government payments were created to help provide financial stability for farms and farmers. In recent years they have become a substantial support to ailing farm income.
Background
The first Farm Bill was created to support farm income while ensuring an adequate food supply. Following bills have been enacted about every five years. The 2008 Farm Bill that was in effect in 2010 greatly increased farm subsidies. Enactment of the 2012 Farm Bill was delayed until 2014. The new bill replaced fixed payments with benefits based on price (PLC) or revenue (ARC) targets. First payments from the new programs were received in 2015. The 2018 Farm Bill extended the same programs with more flexibility. Note that there are several other state and federal agricultural program payments for cost-share improvements, conservation, crop and forage disaster, and livestock indemnity. Market Facilitation Program (MFP) payments were created in 2018 to offset losses from trade disruptions and continued in 2019.
Payment History
Figure 1 shows average payments received by crop farms participating in the Kentucky Farm Business Management (KFBM) program. Only farms that received some type of government payment are included. Note that the farms included in the averages may change from year to year.
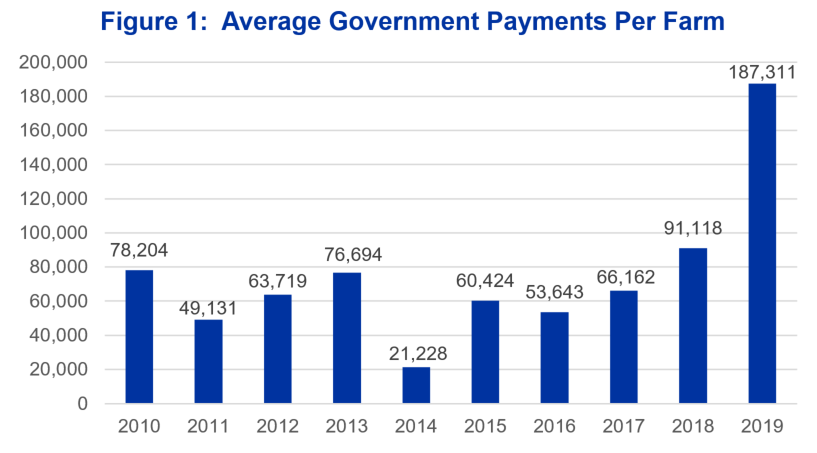
Government payments averaged $74,763 over the past 10 years, or $31.08 per tillable acre.
- Payments under the 2008 Farm Bill (2010-2013) averaged $66,937 per year ($28.55 per acre)
- Payments under the 2014 Farm Bill (2015-2017) averaged $60,076 per year ($24.92 per acre)
- Only 73% of KFBM farms received payments in 2014 for an average $21,228 per farm
MFP pushed up total government payments substantially.
- Payments averaged $58,651 for the eight years prior to MFP in 2018
- Payments more than doubled with MFP, averaging $139,215 ($56.26 per acre)
Effect on Farm Income
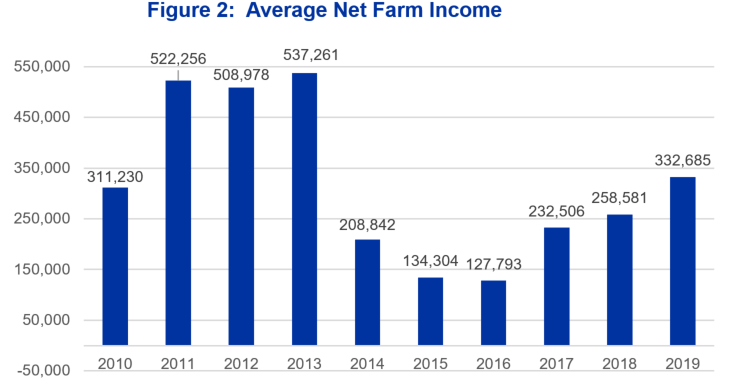
Figure 2 shows Net Farm Income (NFI) for the KFBM crop farms that received government payments for 2010-2019. Net Farm Income includes the value of crops and livestock produced whether sold or in inventory, as well as government payments. All costs of production are included regardless of the year spent. The third 2019 MFP payment is included in 2019 accrual income. Note the sharp drop in NFI because of the drop in commodity prices in 2014, and the continued decline in 2015-2016. Average NFI has increased each year since.
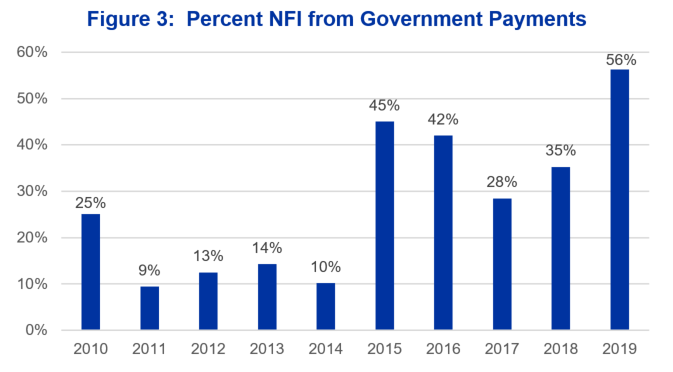
The impact of government payments on NFI becomes apparent in Figure 3. Payments from all government programs averaged 24% of NFI for 2010-2019. Prior to the fall in commodity prices, government payments contributed an average 14% to NFI. Payments under the 2014 Farm Bill during low commodity prices made up 36% of NFI. The 2018 Farm Bill and MFP combined to provide 47% of NFI. For 2019 government programs and trade relief equaled over half of Net Farm Income for the average KFBM crop farm.
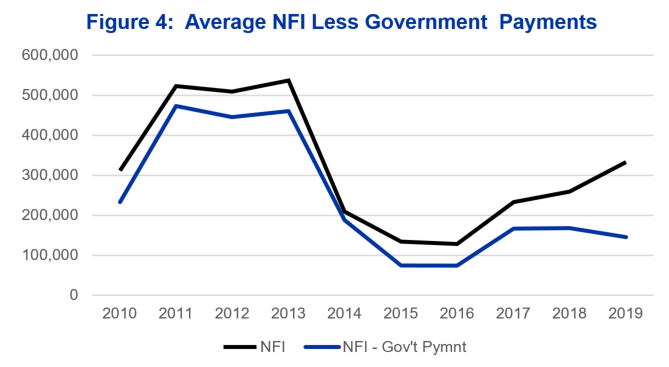
Another way to illustrate the impact of government payments is the difference between Net Farm Income and government payments. Figure 4 shows how much government payment contributes to annual NFI. The programs enhanced already high farm revenues during 2010-2013. But the delay in implementing a 2012 Farm Bill to 2014 and a switch from direct payments to payments based on 2014 price or revenue targets reduced the size and number of payments for 2014. This occurred as commodity prices plummeted and NFI dropped by more than $328,000 per farm compared to 2013. Government payments contributed only 10% to an already low NFI for those who collected. Over a quarter of KFBM farms collected nothing for 2014. Government payments increased during 2015-2017, helping to stabilize farm income during extremely lean years. Average annual payments were down compared to those during 2010-2013, but made up a substantially larger part of NFI. Average farm revenue before government payments was stable in 2017-2018, but declined in 2019. MFP payments helped push NFI back to 2010 levels.
Agricultural government payments were created to help provide financial stability for farms and farmers. In recent years they have become a substantial part of ailing farm income. Government support of agriculture and the rest of the economy in response to COVID-19 and temporary interruption of the US economy will likely have a great impact on 2020 NFI. What role these programs play in the future of US agriculture will likely be a topic of debate.
Author(s) Contact Information:
