Mid-year Inventory Report Suggests Opposite Trends for Beef and Dairy Numbers
Mid-year Inventory Report Suggests Opposite Trends for Beef and Dairy Numbers
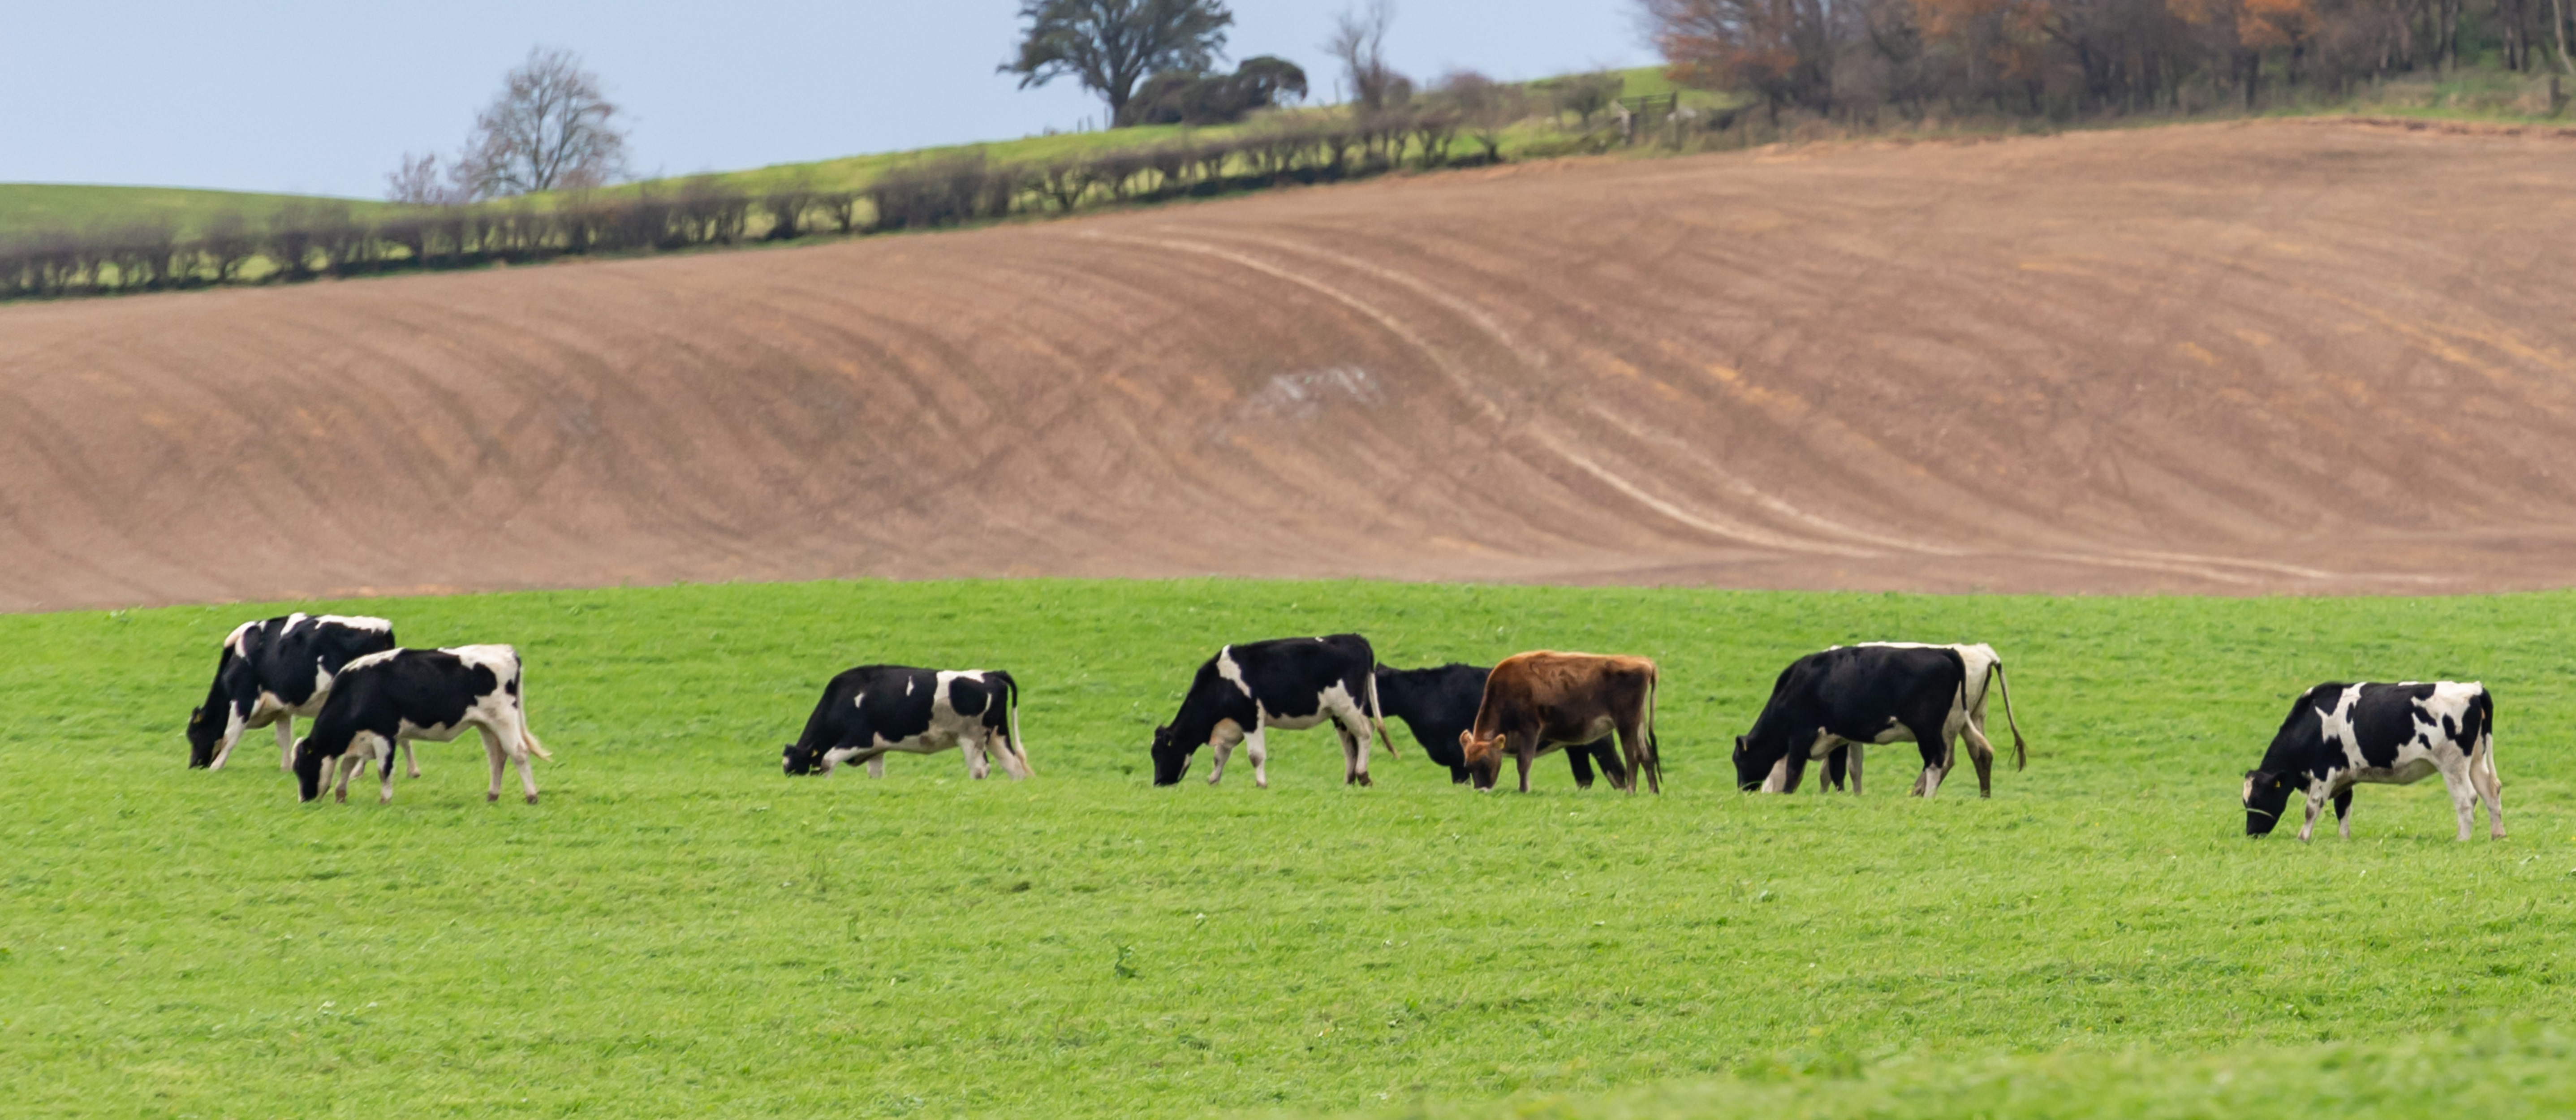
On Friday, July 23rd, USDA-NASS released their mid-year estimates of US cattle inventory. Most all beef-related inventory categories were lower, with all cattle and calves down 1.3% from July 1, 2020. I tend to focus more on beef cow inventory, which was off a little more than 2% from last year. This was the largest mid-year decrease in beef cow numbers since 2012 but still leaves the beef cow just 3% off its recent high in 2018. USDA does not make state-level estimates in July, but I suspect drought conditions in the west, and the northern plains, have impacted this. Beef cow slaughter levels in the first half of 2021 have been relatively high although most culling tends to occur in the fourth quarter as fall-born calves are weaned and we move into winter. The story for dairy cow inventory was much the opposite as milk cow numbers were up 1.6% from a year ago and USDA reported a 2.5% increase in dairy heifer retention. This was also part of the reason why the estimate of the 2021 calf crop, which includes beef and dairy calves, was down very slightly for the year.
Unlike dairy, beef heifer retention estimates paint a picture of decreasing beef cow numbers in the future. While beef heifer retention in nominal terms has been pretty flat the last three years, I like to examine that number as a percent of beef cow numbers. Put simply, if heifer retention is smaller than the culling rate, this suggests decreases in beef cow inventory. The figure below attempts to capture this as it compares heifer retention as a percentage of beef cow inventory on an annual basis (blue line) to the average of this measure going back to 1973 (black line). There was no estimate in 2016, which is why the gap exists. Note that each of the last three years has been about 1% below that long-run average. Culling patterns for the balance of 2021 will be impacted by weather patterns and calf prices, but I feel pretty confident that this trend of decreasing beef cow numbers will continue into 2022.
Figure 1. July Beef Heifer Retention as a Percent of Beef Cow Inventory
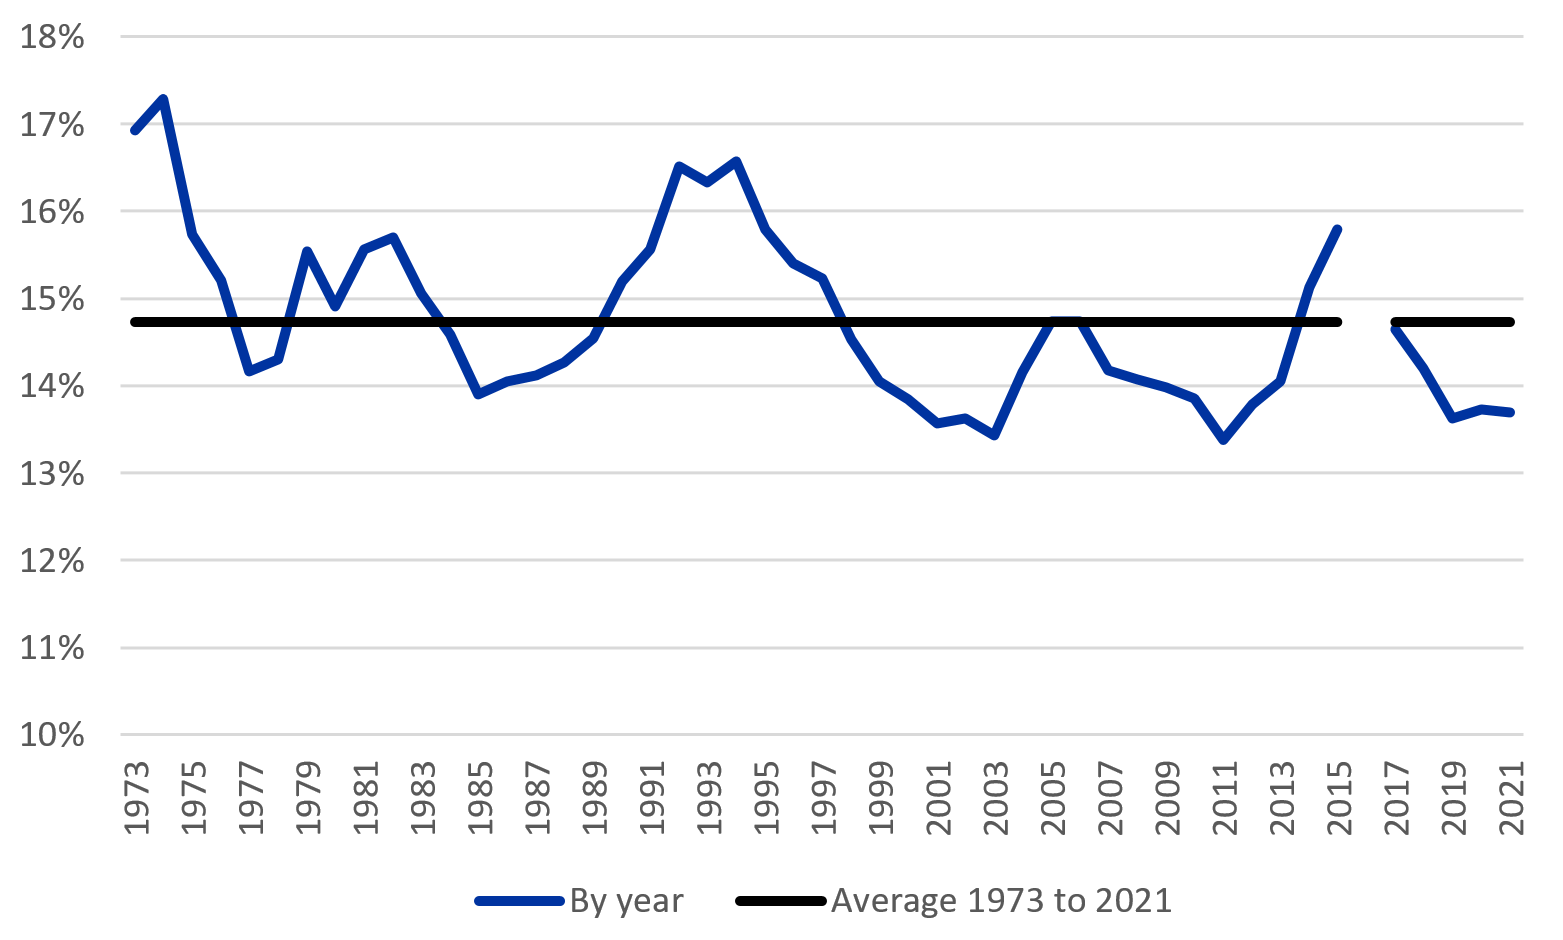
Source: USDA-NASS and Author Calculations
As we discuss these cattle inventory numbers, we do so as the beef cattle market has seen considerable improvement over the last several weeks. Feeder cattle markets really struggled to process rapid increases in grain prices this spring. While new crop corn prices remain historically high, they have pulled back from their earlier highs and this has seemed to breathe new life into a feeder cattle market that fundamentally looked pretty solid coming into 2021. Fall CME© feeder cattle futures are well into the $ 160s as I write this, which bodes well for our fall market. Of course, inventory reports really speak more to the longer-term outlook and the picture being painted is relatively bullish. Plus, these decreases in inventory should also line up with future increases in packing capacity, and the two together are significant reasons for optimism in the next few years.
Table 1. USDA July 1, 2021, Cattle Inventory Estimates
| 2020 (1,000 hd) | 2021 (1,000 hd) | 2021 as % of 2020 | |
|---|---|---|---|
| Total Cattle and Calves | 102,200 | 100,900 | 99 |
| 41,400 | 40,900 | 99 | |
| Cows and Heifers That Have Calved | 32,050 | 31,400 | 98 |
| Beef Cows | 9,350 | 9,500 | 102 |
| Milk Cows | |||
| Heifer 500 Pounds and Over | 16,200 | 16,000 | 99 |
| For Beef Cow Replacement | 4,400 | 4,300 | 98 |
| For Milk Cow Replacement | 4,000 | 4,100 | 103 |
| Other Heifers | 7,800 | 7,600 | 97 |
| Steers 500 pounds and Over | 14,700 | 14,500 | 99 |
| Bulls 500 Pounds and Over | 2,100 | 2,100 | 100 |
| Calves Under 500 Pounds | 27,800 | 27,400 | 99 |
| Calf Crop | 35,135.5 | 35,100 | 100 |
| Cattle on Feed | 13,600 | 13,400 | 99 |
Source: USDA-NASS
Recommended Citation Format:
Burdine, K. "Mid-Year Inventory Report Suggests Opposite Trends for Beef and Dairy Numbers." Economic and Policy Update (21):7, Department of Agricultural Economics, University of Kentucky, July 27th, 2021.
Author(s) Contact Information:
