What Do Higher Profit Farms in Kentucky Have in Common?
What Do Higher Profit Farms in Kentucky Have in Common?
In today’s farming culture, the farm is run just as a business. It is important for producers to make progress and always look for ways to improve the operation. The goal of most producers is to be at the top of the profitability curve in order to stay competitive. In Kentucky, we have had a record three-year period from 2020 to 2022. There were excellent yields combined with decent prices and low input costs. Everything combined resulted in very positive net farm incomes over the period. Looking at the current year, the 2023 crop, input costs have risen drastically and commodity prices are lower. Yields are still unknown, but this will most likely be a year of tight margins although producers’ efficiencies are being maximized. Crop yields do play a major factor in management returns; however, the diversity of the operation also has an impact. It is interesting to examine the characteristics of the higher profit farms over the past five years.
Data from the Kentucky Farm Business Management program for 2018 through 2022 were used to analyze differences between the highest profit grain farms (high one-third) and the lower profit grain farms (low one-third). The analysis was done for 2022 and for the 2018 through 2022 five-year average on a per acre basis. Farms in the higher profit group were larger, had higher corn and soybean yields, cash rented a larger percentage of their acres, had a larger percentage of their acres in corn, and had higher gross returns and lower costs. Management returns, a profit measurement, were significantly greater for the higher profit farms. Management returns are calculated using gross returns, cash costs, economic (rather than tax) depreciation, and imputed costs for interest and owner labor.
Table 1: Differences Between High and Low Thirds - 2022
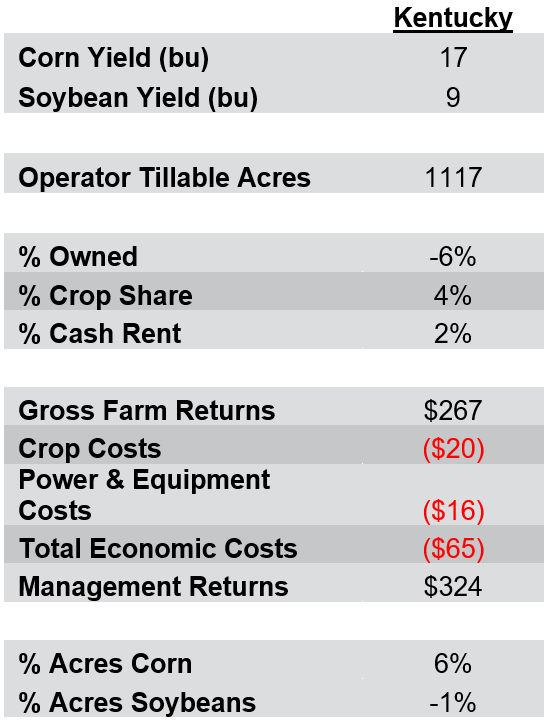
Table 2: Differences Between High and Low Thirds - 5-Year Average
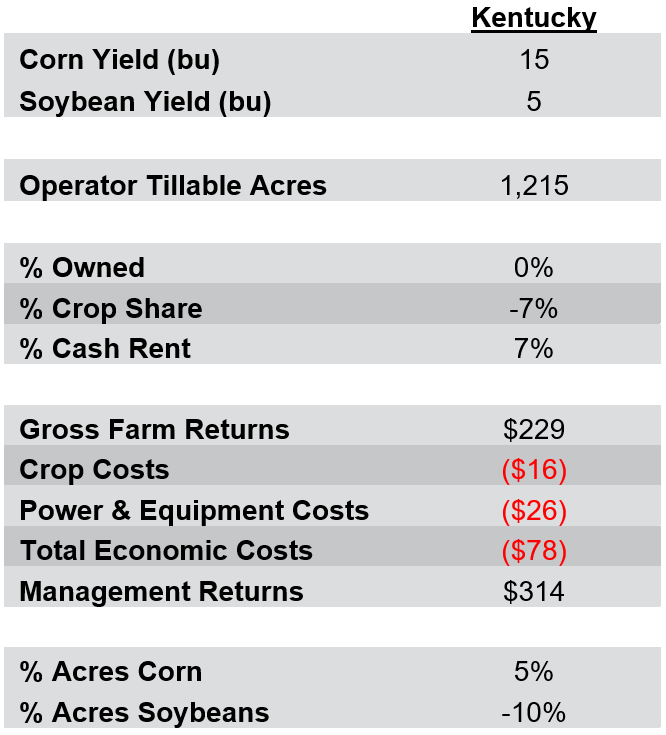
Farm size was a consistent factor in the profitability, as the higher profit farms were 574 acres to 1640 acres larger than the lower profit farms over the five-year period. In 2022, livestock returns (primarily poultry) were a factor in the higher profit farms. Beef cattle also had positive returns in 2022, which was a change from the past five years. The larger farms are able to spread the fixed costs over more acres. Over the five-year period, the average difference in farm size was 1215 acres. This is a large difference as the average size of the farms only ranged in size from 1261 acres to 2920 tillable acres.
Another consistent factor of the higher profit farms was yield. Both corn and soybean yields were higher over the five years. As the table shows, for the five-year average, corn yield was 15 bushels higher and soybean yield was 5 bushels higher. This would obviously result in higher gross returns per acre. In 2022, their yield advantage was a considerable 17 bushels for corn and 9 bushels for soybeans. Weather is one major contributor to the higher yields, but management practices also impacted the yields across the state. The higher profit farms also had a larger percentage of their tillable acres planted in corn and less in full season soybeans. More corn acres will also add to the higher gross farm returns as an acre of corn will produce more returns than an acre of soybeans.
Management practices also impact the costs. The crop costs include seed, chemicals, and fertilizer. An acre of corn is more expensive than an acre of beans, thus one would assume the costs should be higher for the farms that have a larger percentage of their land in corn. However, crop costs for the higher profit farms (with a larger percentage of their land in corn) were $16 lower than the lower profit farms on average over the five-year period. Less inputs to generate higher returns resulted in these farms being at the top. In 2022, the crop costs were $20 lower per acre for the higher profit farms. The largest crop input factor over the past five years, and most likely for the 2023 crop as well, was fertilizer. In 2022, on an average grain farm, crop input costs have been 35-40% of total costs. It is difficult to reduce overall costs when such a large percentage of costs are tied up in inputs that really can’t be reduced without impacting gross returns. Input prices have been very volatile over the last year, thus monitoring input costs has been a top priority for producers.
As expected, the higher profit, larger farms had lower power and equipment costs. This category includes utilities, equipment repairs, fuel, machine hire and lease, and equipment economic depreciation. The largest costs are repairs, machine hire, and economic depreciation. Spreading these costs over more acres allows for more efficiency. Total economic costs include crop costs, power and equipment costs, building costs, labor costs, miscellaneous costs, and land costs. In 2022, total costs were $65 per acre lower for the higher profit farms, which you can see over half of that difference is a result of crop and equipment costs. In 2022, labor was $36 more for the lower profit farms. One reason for this is more tobacco on the lower profit farms. Tobacco is labor intensive and since the lower profit farms were smaller, there were fewer acres to spread the labor costs across. Economic costs were $78 less for the five-year average, and 54% of that difference is a result of crop and equipment costs.
Another interesting factor to discuss is the ownership and rental agreements of the higher profit farms. Different areas of the state have primarily different rental agreements. Some landlords prefer cash rent and a guaranteed set price, while other landlords are willing to take a risk for higher returns and possibly share in some crop expenses. In 2022, the higher profit farms owned 6% less of their land, crop shared 4% more of their land, and cash rented 2% more of their land. The average cash rent for these farms was only $203, a very economical cash rent. Over the five-year period, the average difference for the higher profit farms was crop sharing 7% less, and cash renting 7% more. With the economical cash rent average, the crop share farms have been a larger cost to the producers over the period.
The larger gross farm returns and the lower costs have resulted in significantly larger management returns for the higher profit farms. In 2022, the higher profit farms averaged $324 more per acre in management returns. Over the five-year period the average difference was $314 per acre.
There are many factors that contribute to the profitability of the farms. Some factors, such as weather, cannot be controlled, but the management practices of each operation impact many other factors. Forward planning and knowing breakeven costs are more important now than in the past. With the volatilities of the commodity markets and the fertilizer markets, producers should be aware of their costs in order to “pull the trigger” when the time comes. Not one single factor will be the consistent main contributor to the difference in profitability. The goal of all producers should be to analyze personal trends and work toward improving their individual operation.
If you would like more information about the Kentucky Farm Business Management program, please contact one of the specialists in your area.
Recommended Citation Format:
Turley, L. O. "What Do Higher Profit Farms in Kentucky Have in Common?" Economic and Policy Update (22):7, Department of Agricultural Economics, University of Kentucky, August 29th, 2023.
Author(s) Contact Information:
