2023 Farmland Values
Author(s): Steve Isaacs
Published: September 8, 2023
Shareable PDF
Each August the USDA releases the results of their survey of farmland values. The survey includes data from approximately 9,000 tracts of land of about one square mile each across the continental United States. The survey takes place in early June and reports the separate values of cropland and pastureland, and the value of all land and buildings (i.e., farm real estate value). The average farm real estate value is the widely reported farmland value. This year the national average is $4,080/acre, an increase of 7.4% from 2022. State-level values are also reported. The complete Land Values 2023 Summary is available from the National Agricultural Statistics Service of USDA.
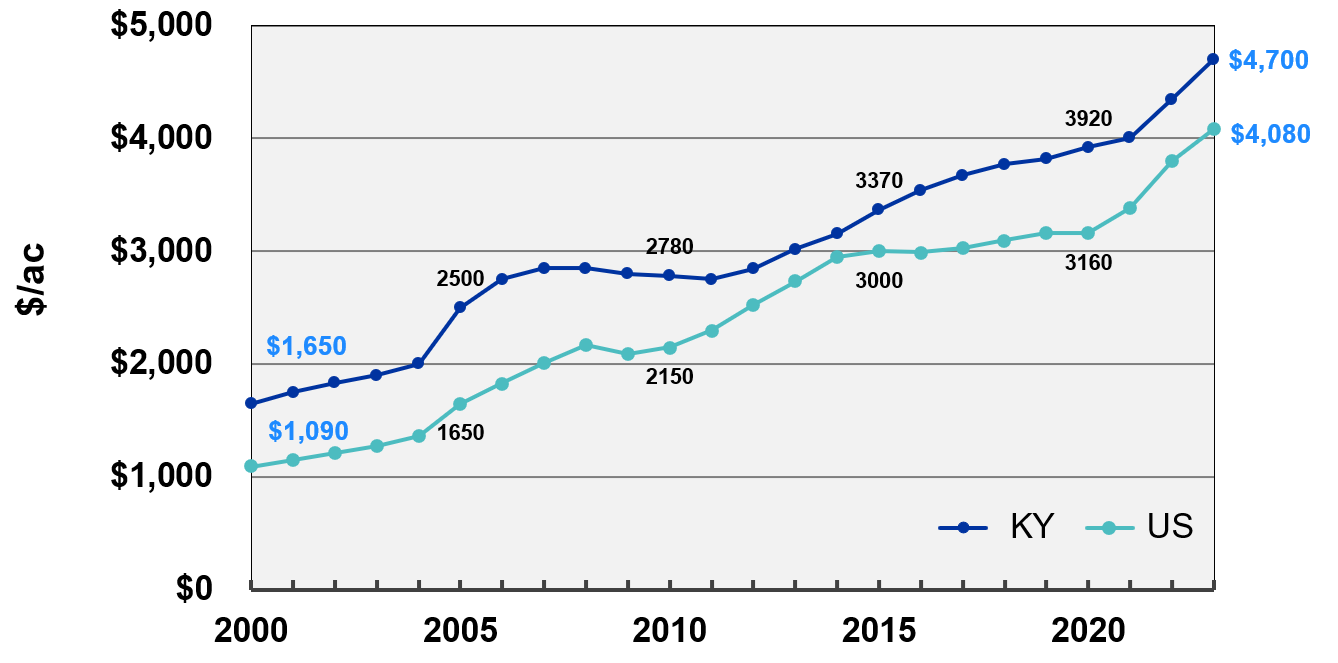
Kentucky’s farm real estate values increased 8.0% to $4,700/acre. Kentucky’s average cropland values increased from $5,000/ac to $5,450/ac (9.0%) while Kentucky’s pastureland value was up 4.6% from $3,250/ac to $3,400/ac.
Nationally, average cropland values increased 8.1% to $5,460/ac from $5,050 a year earlier. US pastureland value increased 6.7% to $1,760/ac. These are the June survey averages. They do not represent the per-acre prices for specific tracts nor are they an average of sale values. Land values are determined by a number of factors including productivity, local demand, and other quality or location attributes. Simply put, land prices are set locally. The USDA averages are a broad indicator of changes in land values.
Land value changes are widely reported in the farm literature, usually in the format of Figure 1. This graphic captures data since 1970 when farm real estate was valued at $196/acre. Figure 1 includes nominal as well as inflation-adjusted values. The 2023 inflation-adjusted value is $1,364/ac. The 1970 inflation-adjusted value was $519/ac. For this analysis 1984 is the index value of 100. Inflation-adjusted values before 1984 are greater than nominal values. After 1984 inflation adjusted values are less than the observed nominal values. While land value changes generally exceed the rate of inflation, it is noteworthy that after the farm financial crisis began in 1982, nine of the next eleven years saw negative inflation-adjusted values.
Figure 1: United States Farm Real Estate Values ($/ac) 1970-2023
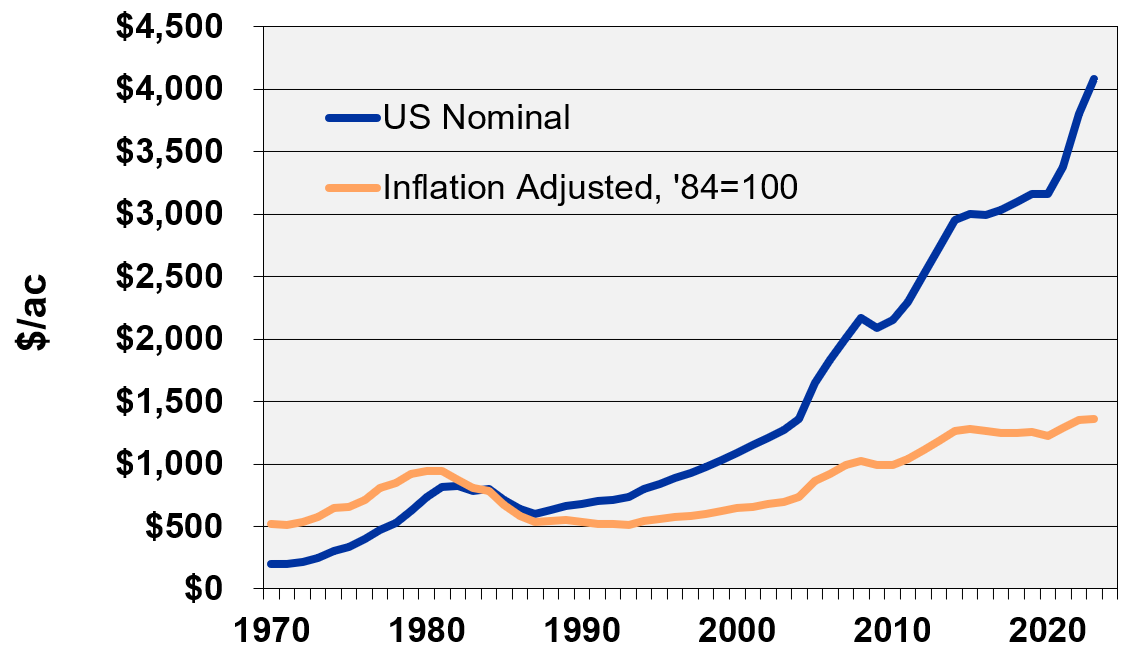
Figure 2 is a comparison of Kentucky land values with the national trend since 2000. Kentucky’s values trend generally with national values but exceed the national average while trailing most Midwestern states.
Figure 2: Kentucky & U.S. Farm Real Estate Values ($/ac) 2000-2023
Land values do not “…always go up because they don’t make any more of it.” Nominal land values decreased during the Great Depression, during the farm crisis of the 80s, and on a few other occasions…most recently in 2009 and 2016. Figure 3 is a graphic updated each year with the August survey results. This is the percentage change in the nominal value from the previous year and tends to reflect the economic health of the ag economy. In good times land values get bid up because it is true that “…they don’t make any more of it.” But, it does not “…always go up.”
Figure 3: Annual Percentage Change in U.S. Farm Real Estate Values 1910-2023 (nominal values)
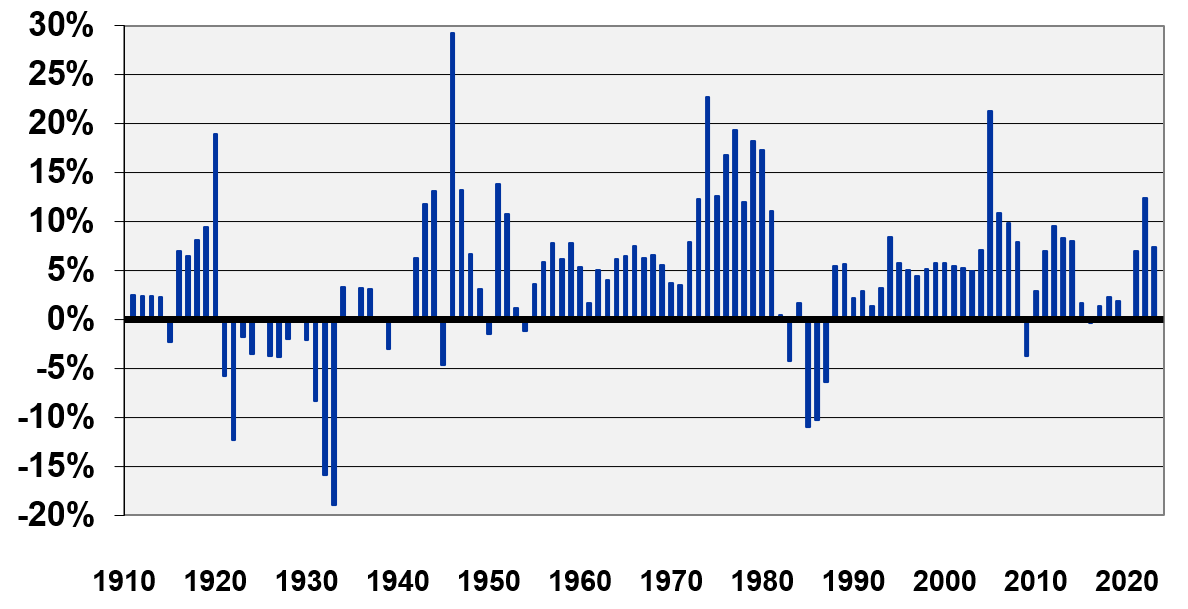
The values in Figure 3 are the percentage change in the observed (nominal) values from the year before. Recall from Figure 1 that inflation-adjusted values are quite different. If we subtract the annual inflation rate from the nominal percentage change we see the results reflected in Figure 4. The pain of the 80s farm financial crisis is quite evident and lasted for over a decade.
Figure 4: Annual Percentage Change in U.S. Farm Real Estate Values 1914-2022 (inflation-adjusted)
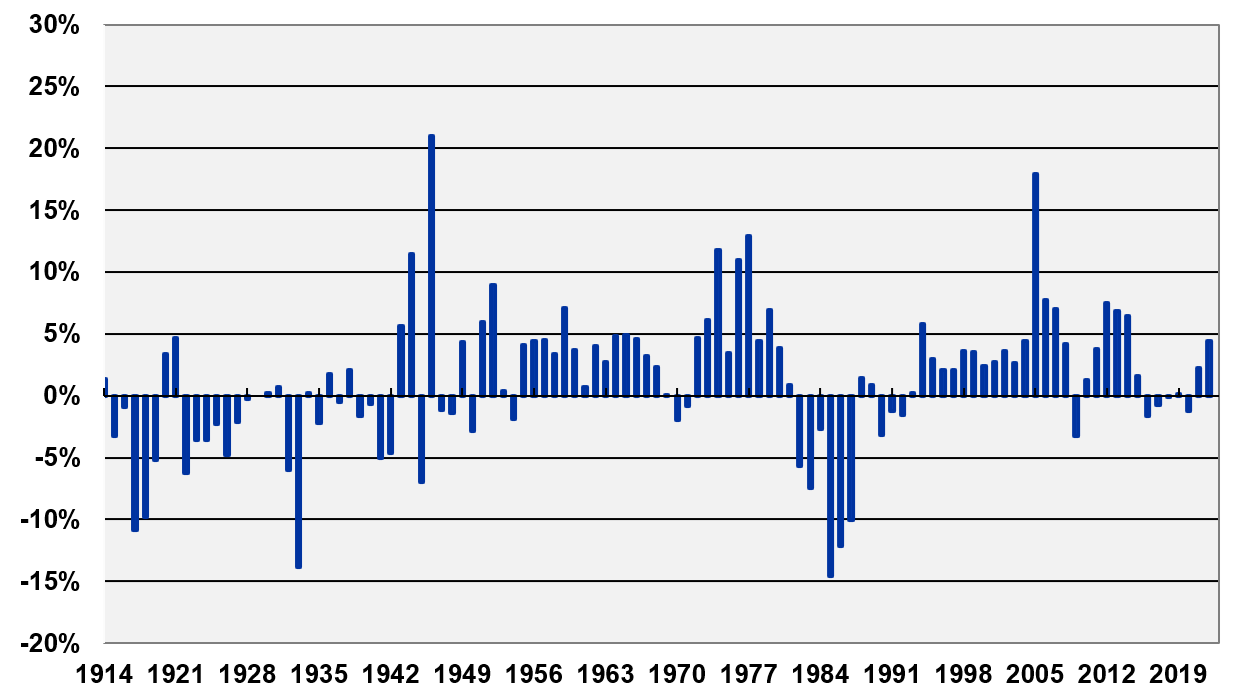
Since 2000 nominal farmland values have decreased only twice, 3.7% in 2009 with the Great Recession and another 0.3% decrease in 2016 reflecting lower commodity prices compared to previous years. From $1,090/ac in 2000, farmland values rose nearly three thousand dollars per acre to $4,080 in 2023, a 274% increase. Adjusted for inflation farmland values still doubled since 2000, from $646/ac to $1364. There have been five years since 2000 when land value changes failed to cover inflation.
Again, these are survey values from a broad area. Have local changes been more or less? Absolutely! All land prices are local.
Is land a good investment? The trend lines in nominal and real values are upward, but don’t go up every year. Since 2000 nominal land values have increased an average of 6.0% per year and even accounting for inflation, land values have increased 3.5% per year on average.
But for the third time in this article, “land prices are local.” Use this information to follow broad trends in the value of US cropland, pastureland, and farm real estate.
Recommended Citation Format:
Isaacs, S. "2023 Farmland Values." Economic and Policy Update (23):9, Department of Agricultural Economics, University of Kentucky, September 8, 2023.
Author(s) Contact Information:
Steve Isaacs | Extension Professor | sisaacs@uky.edu
Recent Extension Articles
Fall 2023 Wheat Planting Decision
Greg Halich
Corn harvest is now underway and Kentucky grain farmers will soon decide if and how much wheat they will plant this fall. Compared to last year there are significant decreases in wheat and soybean prices, but also significant decreases in fertilizer and fuel prices. The following analysis quantifies these relative changes to estimate the profitability for crops harvested in 2024.
Southern Ag Today: A Resource for Farmers and Policymakers in The Southern Region
Jordan Shockley
The Department of Agricultural Economics here at UK is proud to be a part of Southern Ag Today. This daily email aims to keep producers and policymakers informed in easy-to-read articles to fit their busy schedules.

