Ag Economic Situation & Outlook
2024 Economic Situation & 2025 Outlook
Our annual Ag Economic Situation & Outlook publication is a collaborative effort between the Department of Agricultural Economics Extension Faculty and the Department of Forestry and Natural Resources. This comprehensive outlook is initially presented at the Kentucky Farm Bureau Annual Meeting in Louisville, Kentucky, and is made available to the public afterward. In this year’s edition, we delve into the challenges U.S. agriculture faces in 2024, from falling commodity prices and shrinking government payments to rising input costs.
However, Kentucky’s diverse agricultural sector shows resilience, with strong performances in livestock and horticulture helping to offset downturns in grain production. This report provides valuable insights into both national and state-level trends, offering projections for 2025 and the factors that will shape the future of agriculture in Kentucky and beyond.
2024 Situation
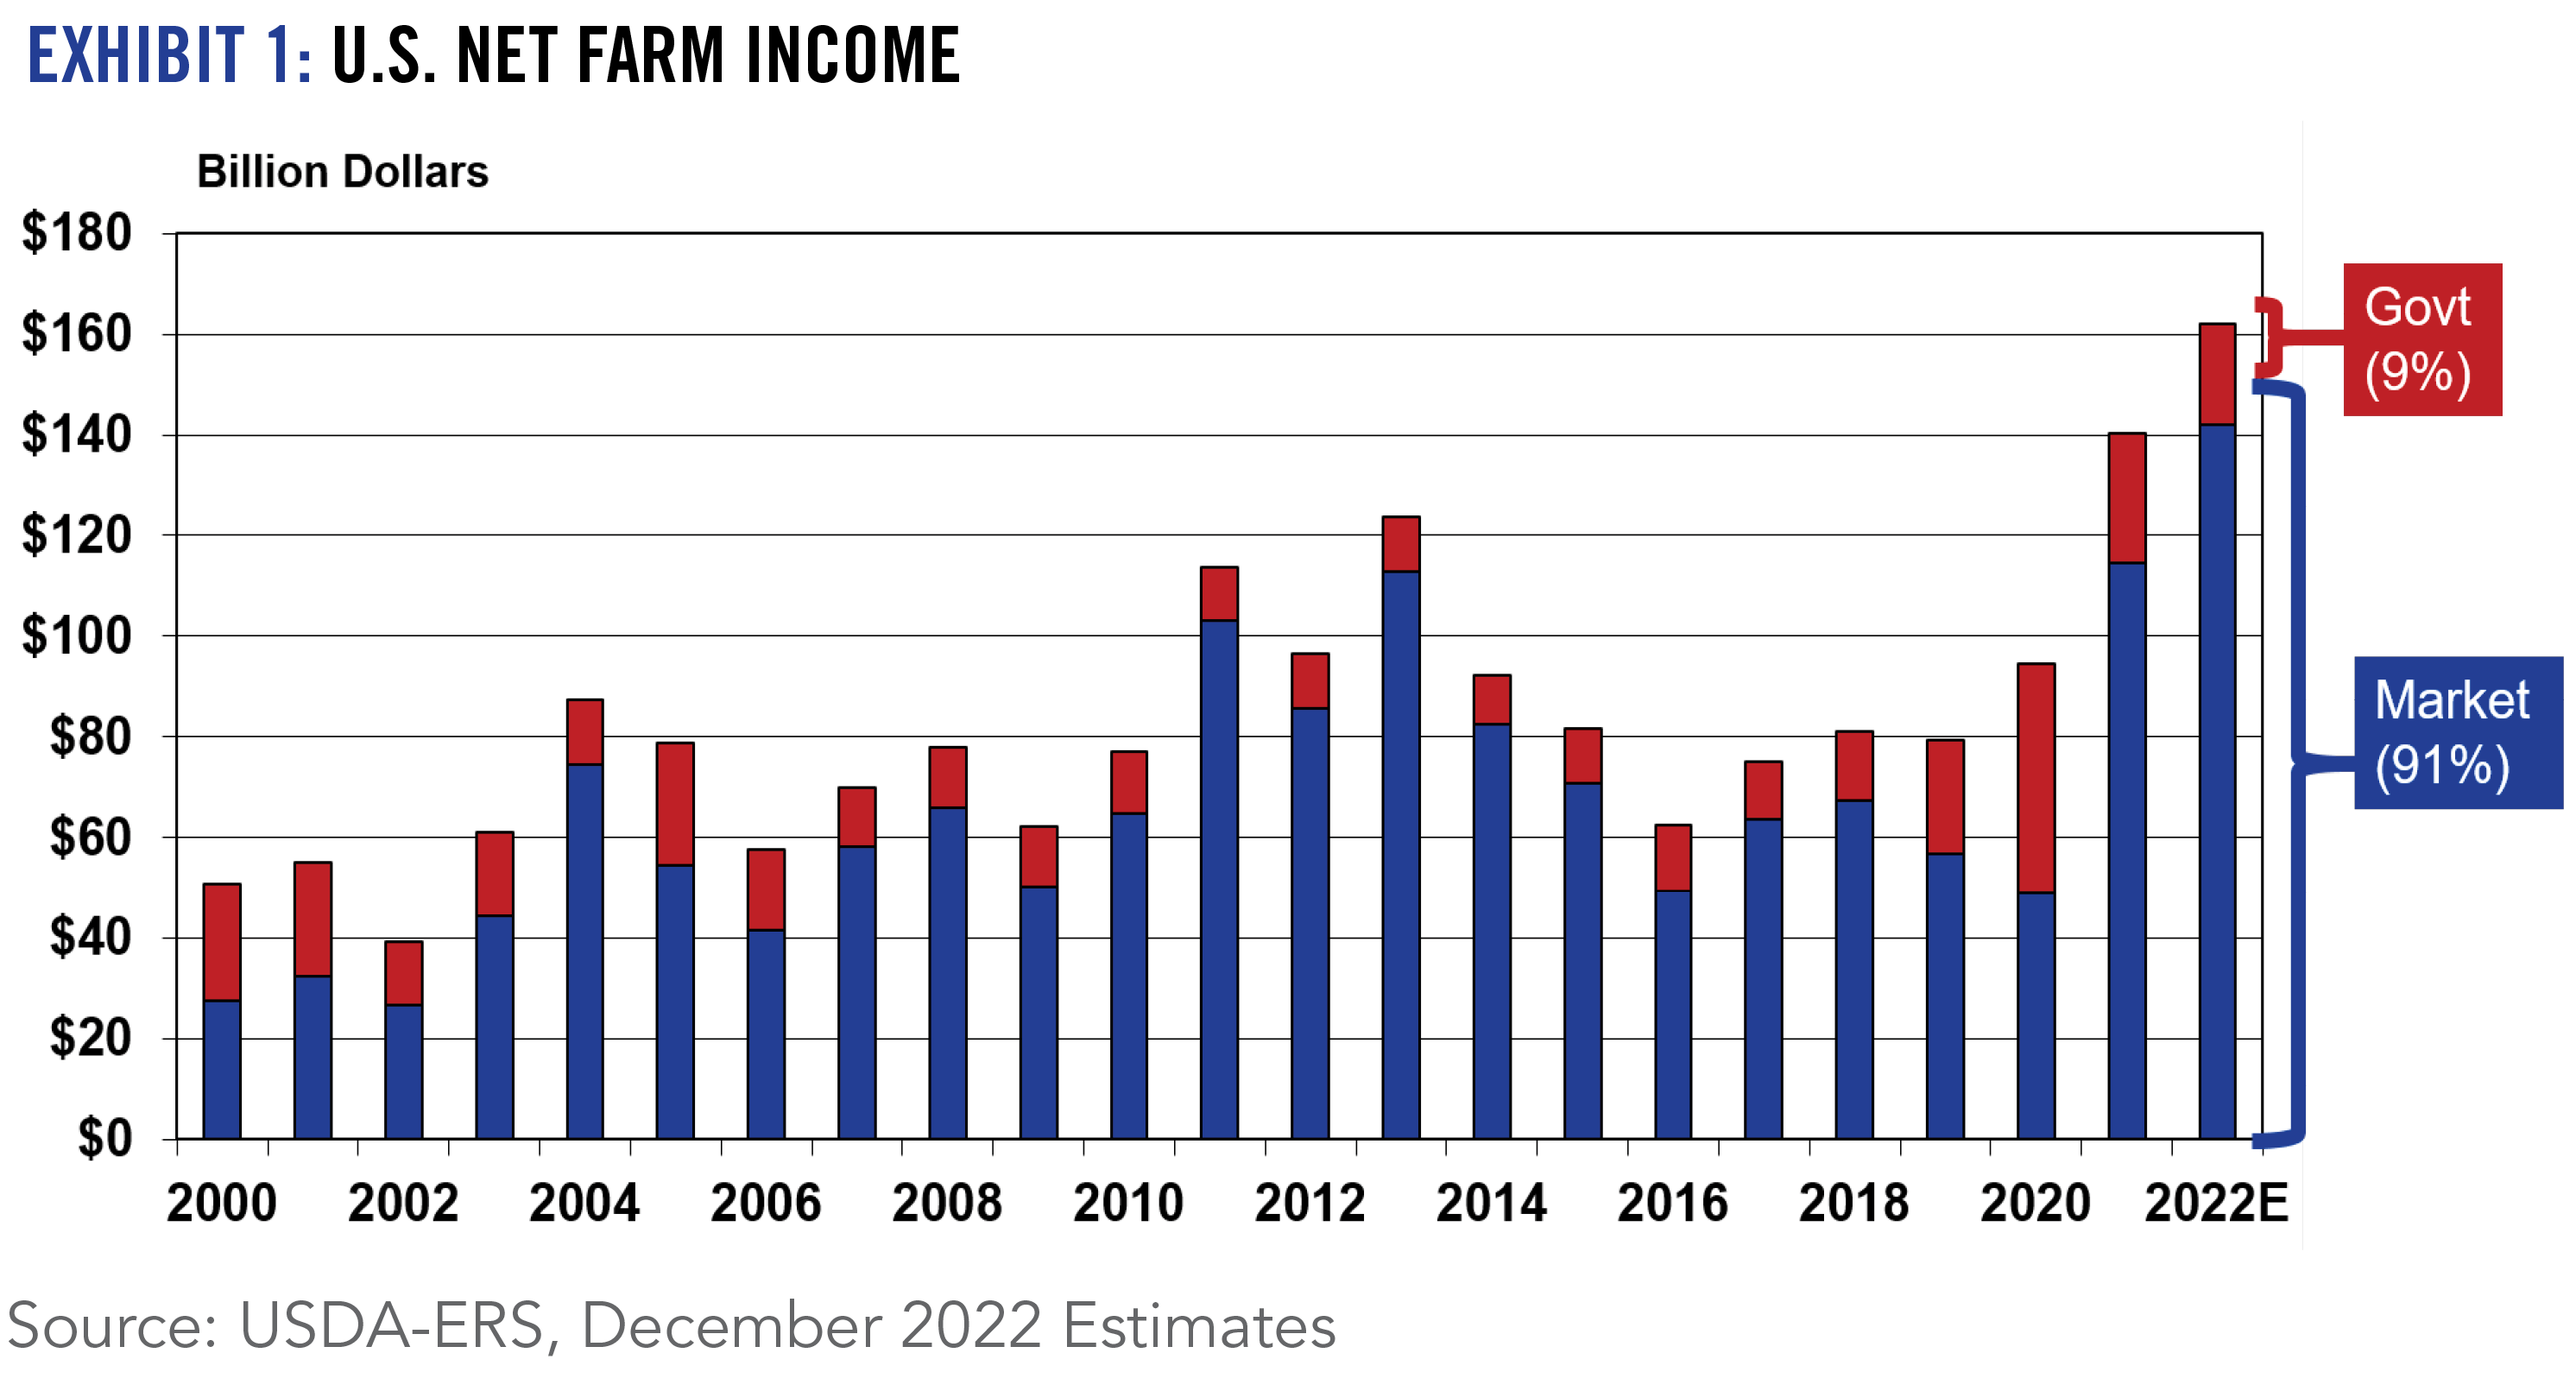
U.S. agriculture experienced another challenging year in 2024. After achieving record net farm income levels in 2021 and 2022 on the heels of strong commodity prices, exceptional crop yields, stable/declining input prices, and large government payments, U.S. net farm income fell 19.4% in 2023 and is expected to fall an additional 4.1% in 2024 according to the latest USDA estimates.
The downward trend in the U.S. farm economy this past year has slowed as growing livestock receipts (projected up 8.4% in 2024) have helped offset significantly lower crop receipts (projected down 9.2% in 2024).
Grain prices slumped in 2024 in response to large global crops and ample carryover inventories. Alternatively, beef prices are benefiting from the smallest cattle inventory in more than 60 years. The livestock sector is also being supported by higher dairy, poultry and hog prices/receipts in 2024.
Although U.S. net farm income has been declining, the current structure of the farm bill has not provided additional support as direct government payments have declined from $45.6 billion in 2020 (comprised primarily of ad hoc disaster, pandemic, and trade assistance payments) to averaging $11.4 billion over the past two years (primarily disaster and conservation funds).
Following record high export levels in 2022, the U.S. ag export value fell 11% in 2023, but has been relatively flat so far in 2024 through the first ten months. U.S. corn, beef and pork have experienced export value gains in 2024, poultry sales are relatively flat compared to last year, but soybeans exports have fallen significantly. China emerged as the largest U.S. ag export market hitting a record high $38 billion of ag purchases from the United States in 2022. However, U.S. ag trade to China has been trending downward the past two years (off 24% in 2023 and down another 19% through the first ten months of 2024) as this important ag/food importing nation is purchasing more ag/food products from South America while simultaneously attempting to boost domestic ag production. As a result. China has slipped from the top spot in 2022 to being the United States’ third largest export buyer with Canada and Mexico regaining their former status as our leading two export customers. Since the passage of the U.S.-Mexico-Canda (Trade) Agreement (USMCA) in January 2020, U.S. ag exports to these two top markets have increased by nearly 50%. Alternatively, U.S. ag exports to China have declined by nearly 25% since the two-year Phase One trade deal between the two nations ended in 2021.
In addition to falling prices, government payments, and exports, net farm income has also been plagued in recent years by input price inflation. While labor, animal replacement, and interest costs have continued to increase, U.S. farmers have benefitted from lower feed, fertilizer, and chemical expenses as they are coming off relatively high levels.
While the U.S. farm economy is trending lower, the farm balance sheet has remained relatively strong in response to strong asset values. Despite falling income and relatively high interest rates, farmland values have continued to increase in certain areas, although at a notable slower pace. Development opportunities, outside investors/buyers, and limited farmland for sale are driving the market -- not anticipated future farm income streams. Over the past five years farm debt has increased 5.8%, while average farmland values have increased by 7.5% nationally. Despite relatively strong balance sheets, shrinking working capital, along with liquidity and cash flow challenges are major concerns among a growing number of farmers in meeting short-term debt obligations. Following a tighter monetary policy by the Federal Reserve to battle inflation in 2022 and 2023, interest rates on farm operating and real estate purchases soared above 8% for the first time in nearly twenty years. Despite recent reductions in interest rates by the Fed, farm interest rates have generally remained in the 8 to 9% range.
Similar to the national scene, the Kentucky farm economy has been challenged by the downturn in the overall ag economy. However, the diversity of our ag sector has enabled Kentucky agriculture to weather the storm much better than other many other states that are primarily dependent on row crop income
Certainly, depressed grain prices initiated a blow to Kentucky grain farmers in 2024 with mixed outcomes on grain yields across the state depending on rainfall amounts received during the growing season. Cattle prices have been the major bright spot for Kentucky agriculture in 2024, but marketing quantities have constrained additional growth in cattle income. Poultry and dairy producers have benefitted from a rebound in prices and lower feed costs. The equine market has remained relatively strong, while tobacco sales and the number of farms growing the crop continue to shrink.
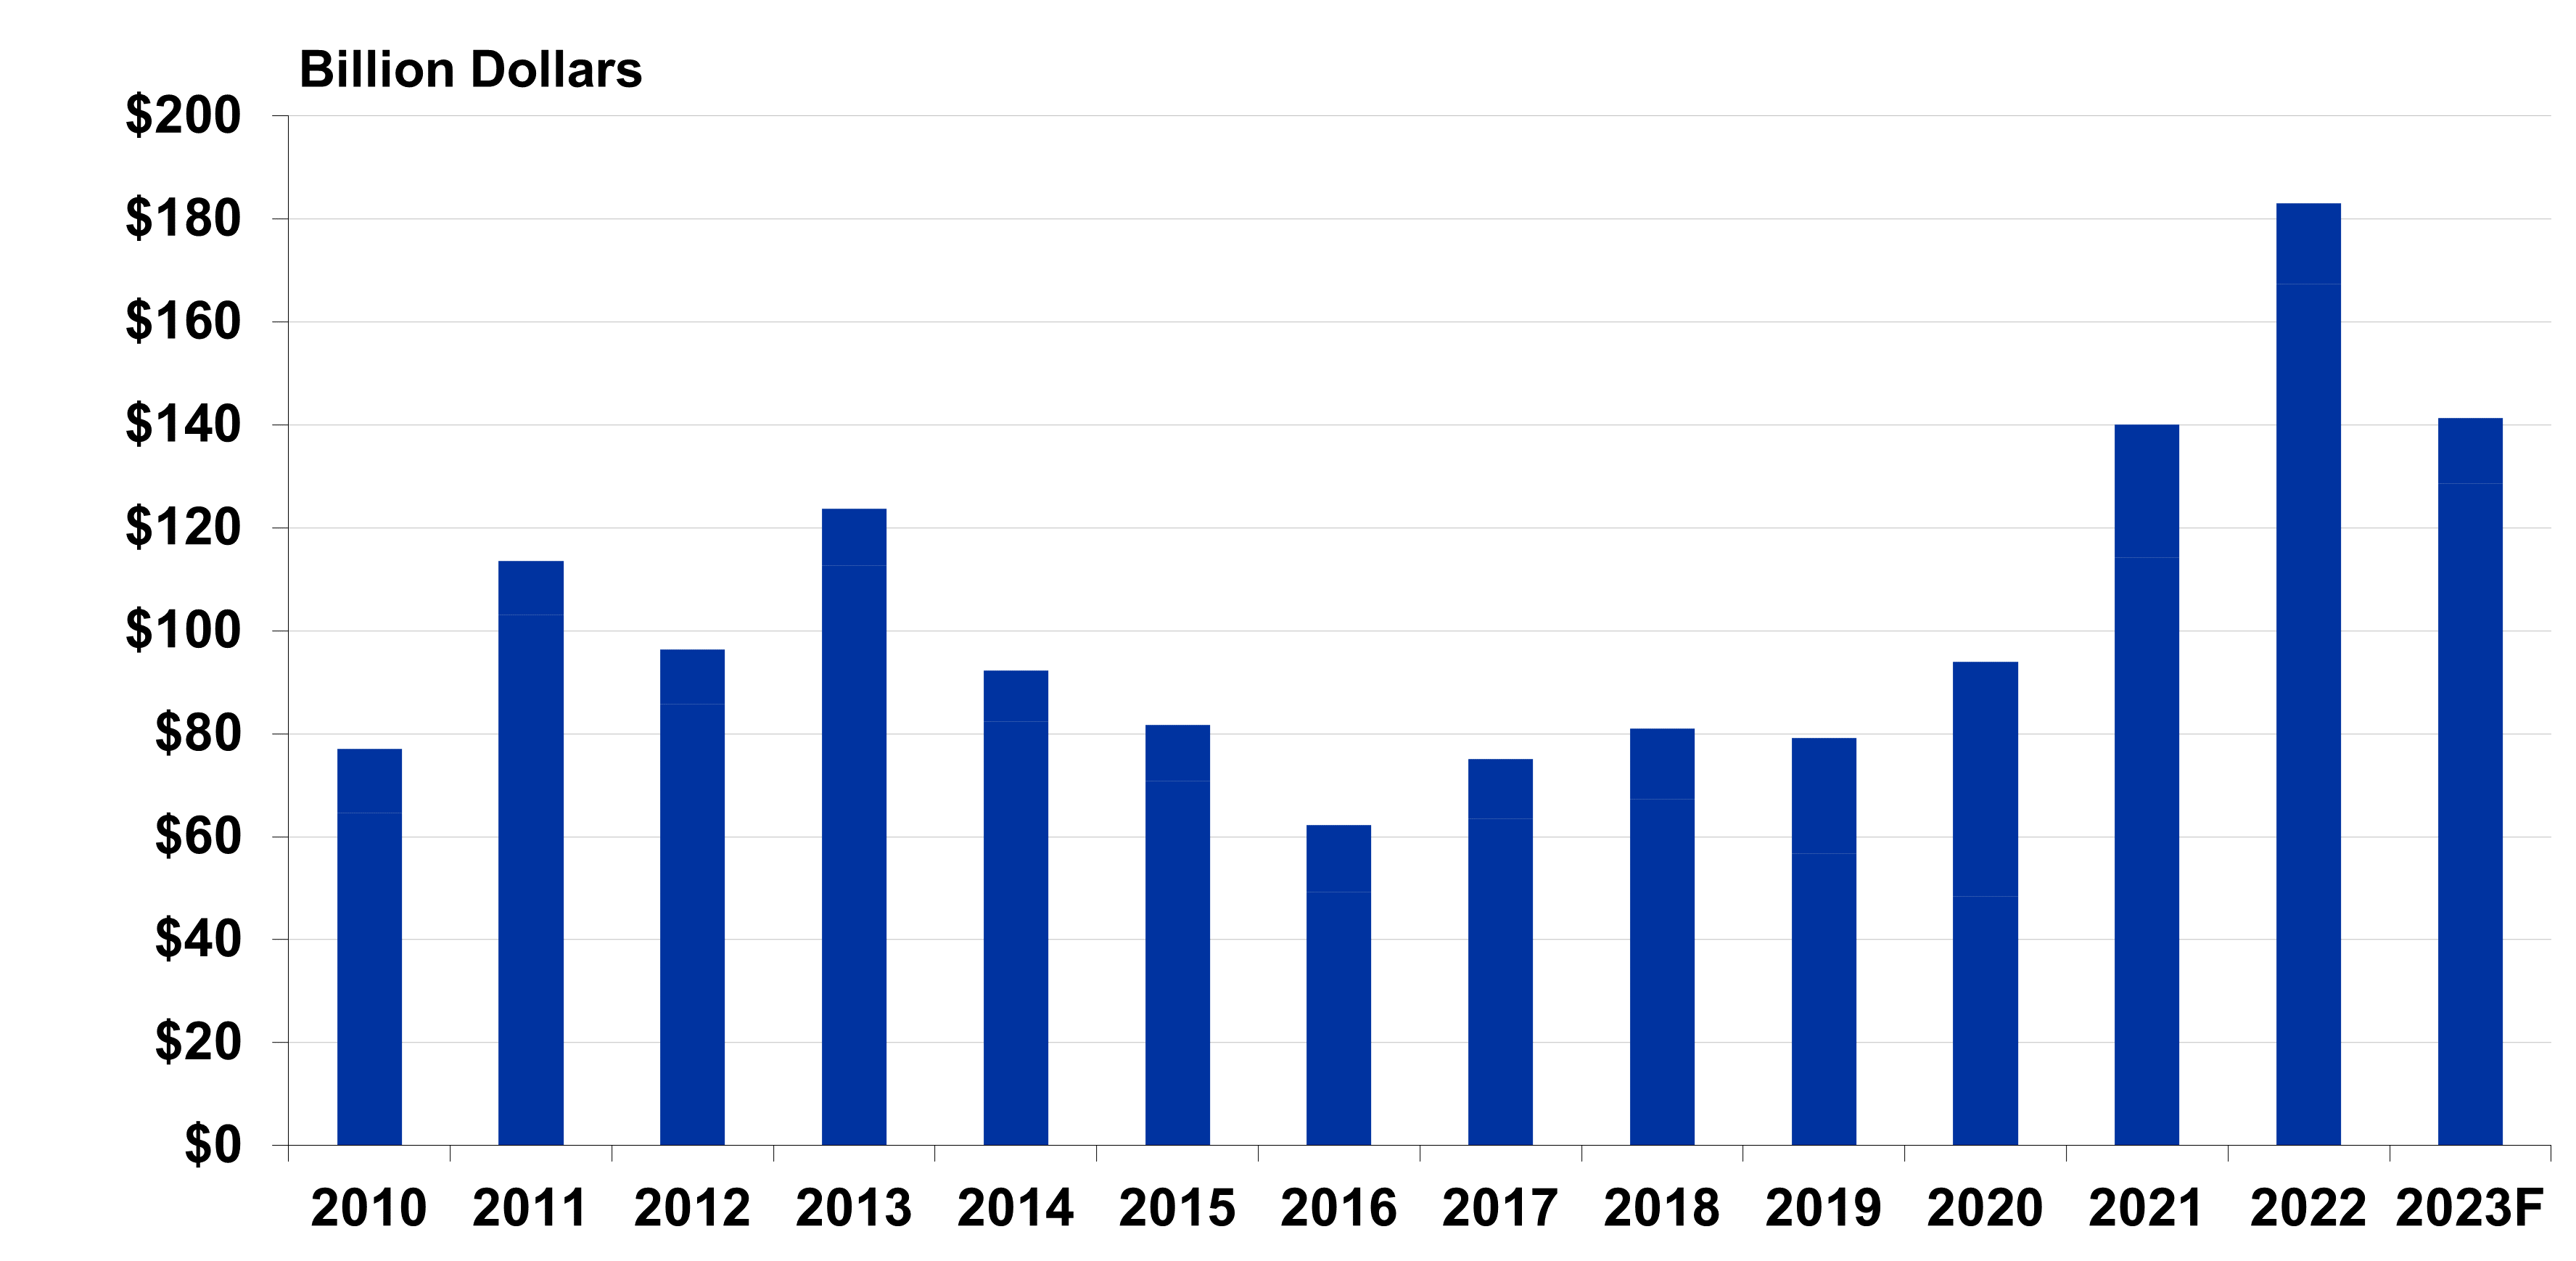
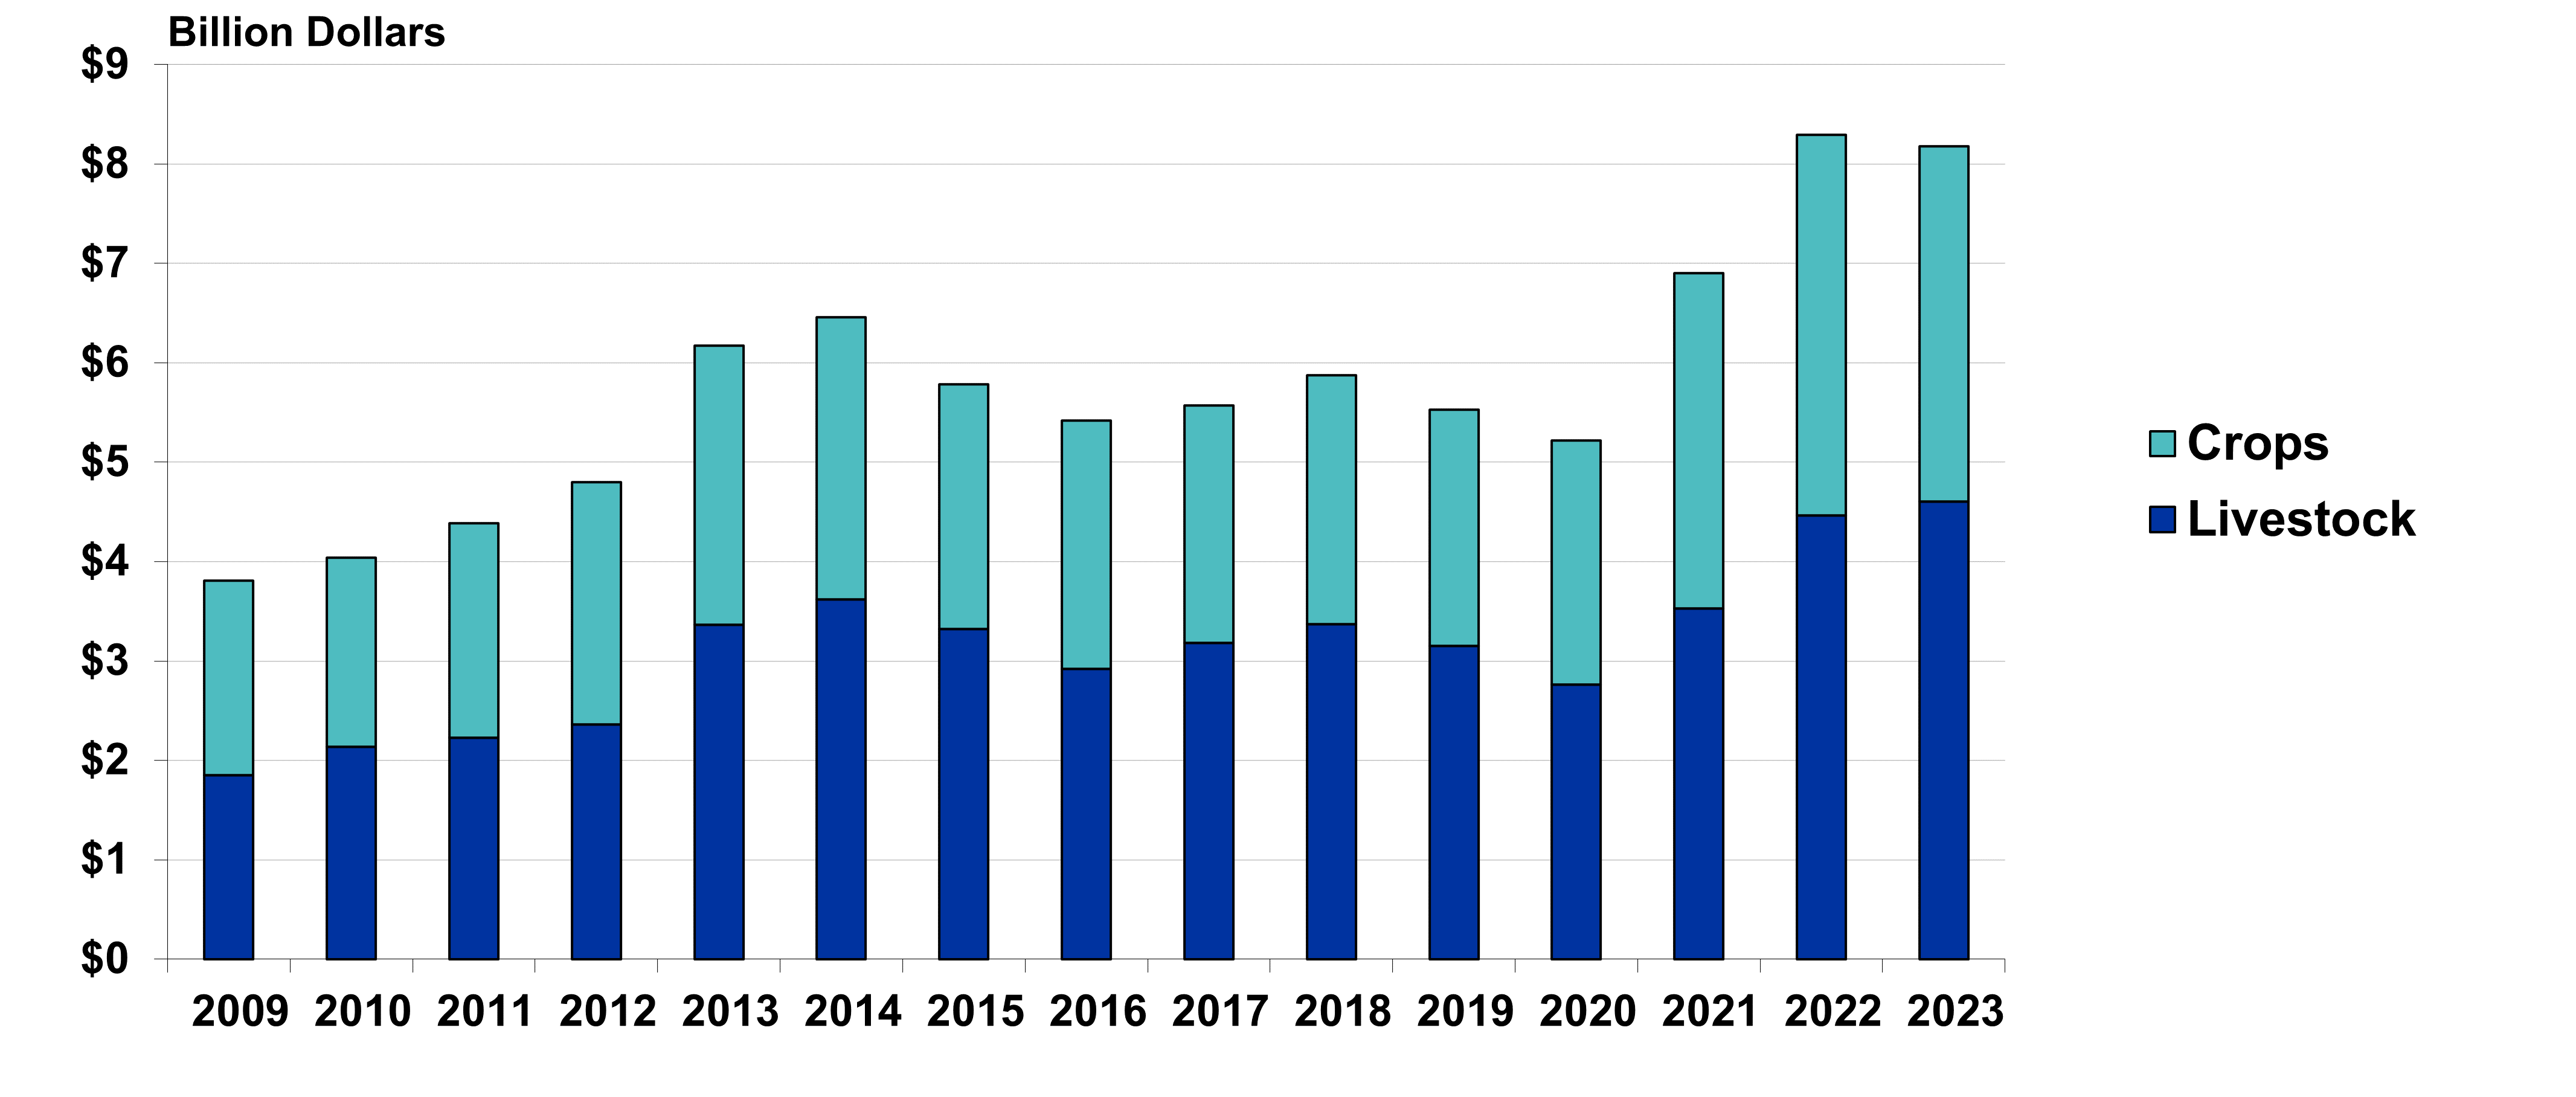
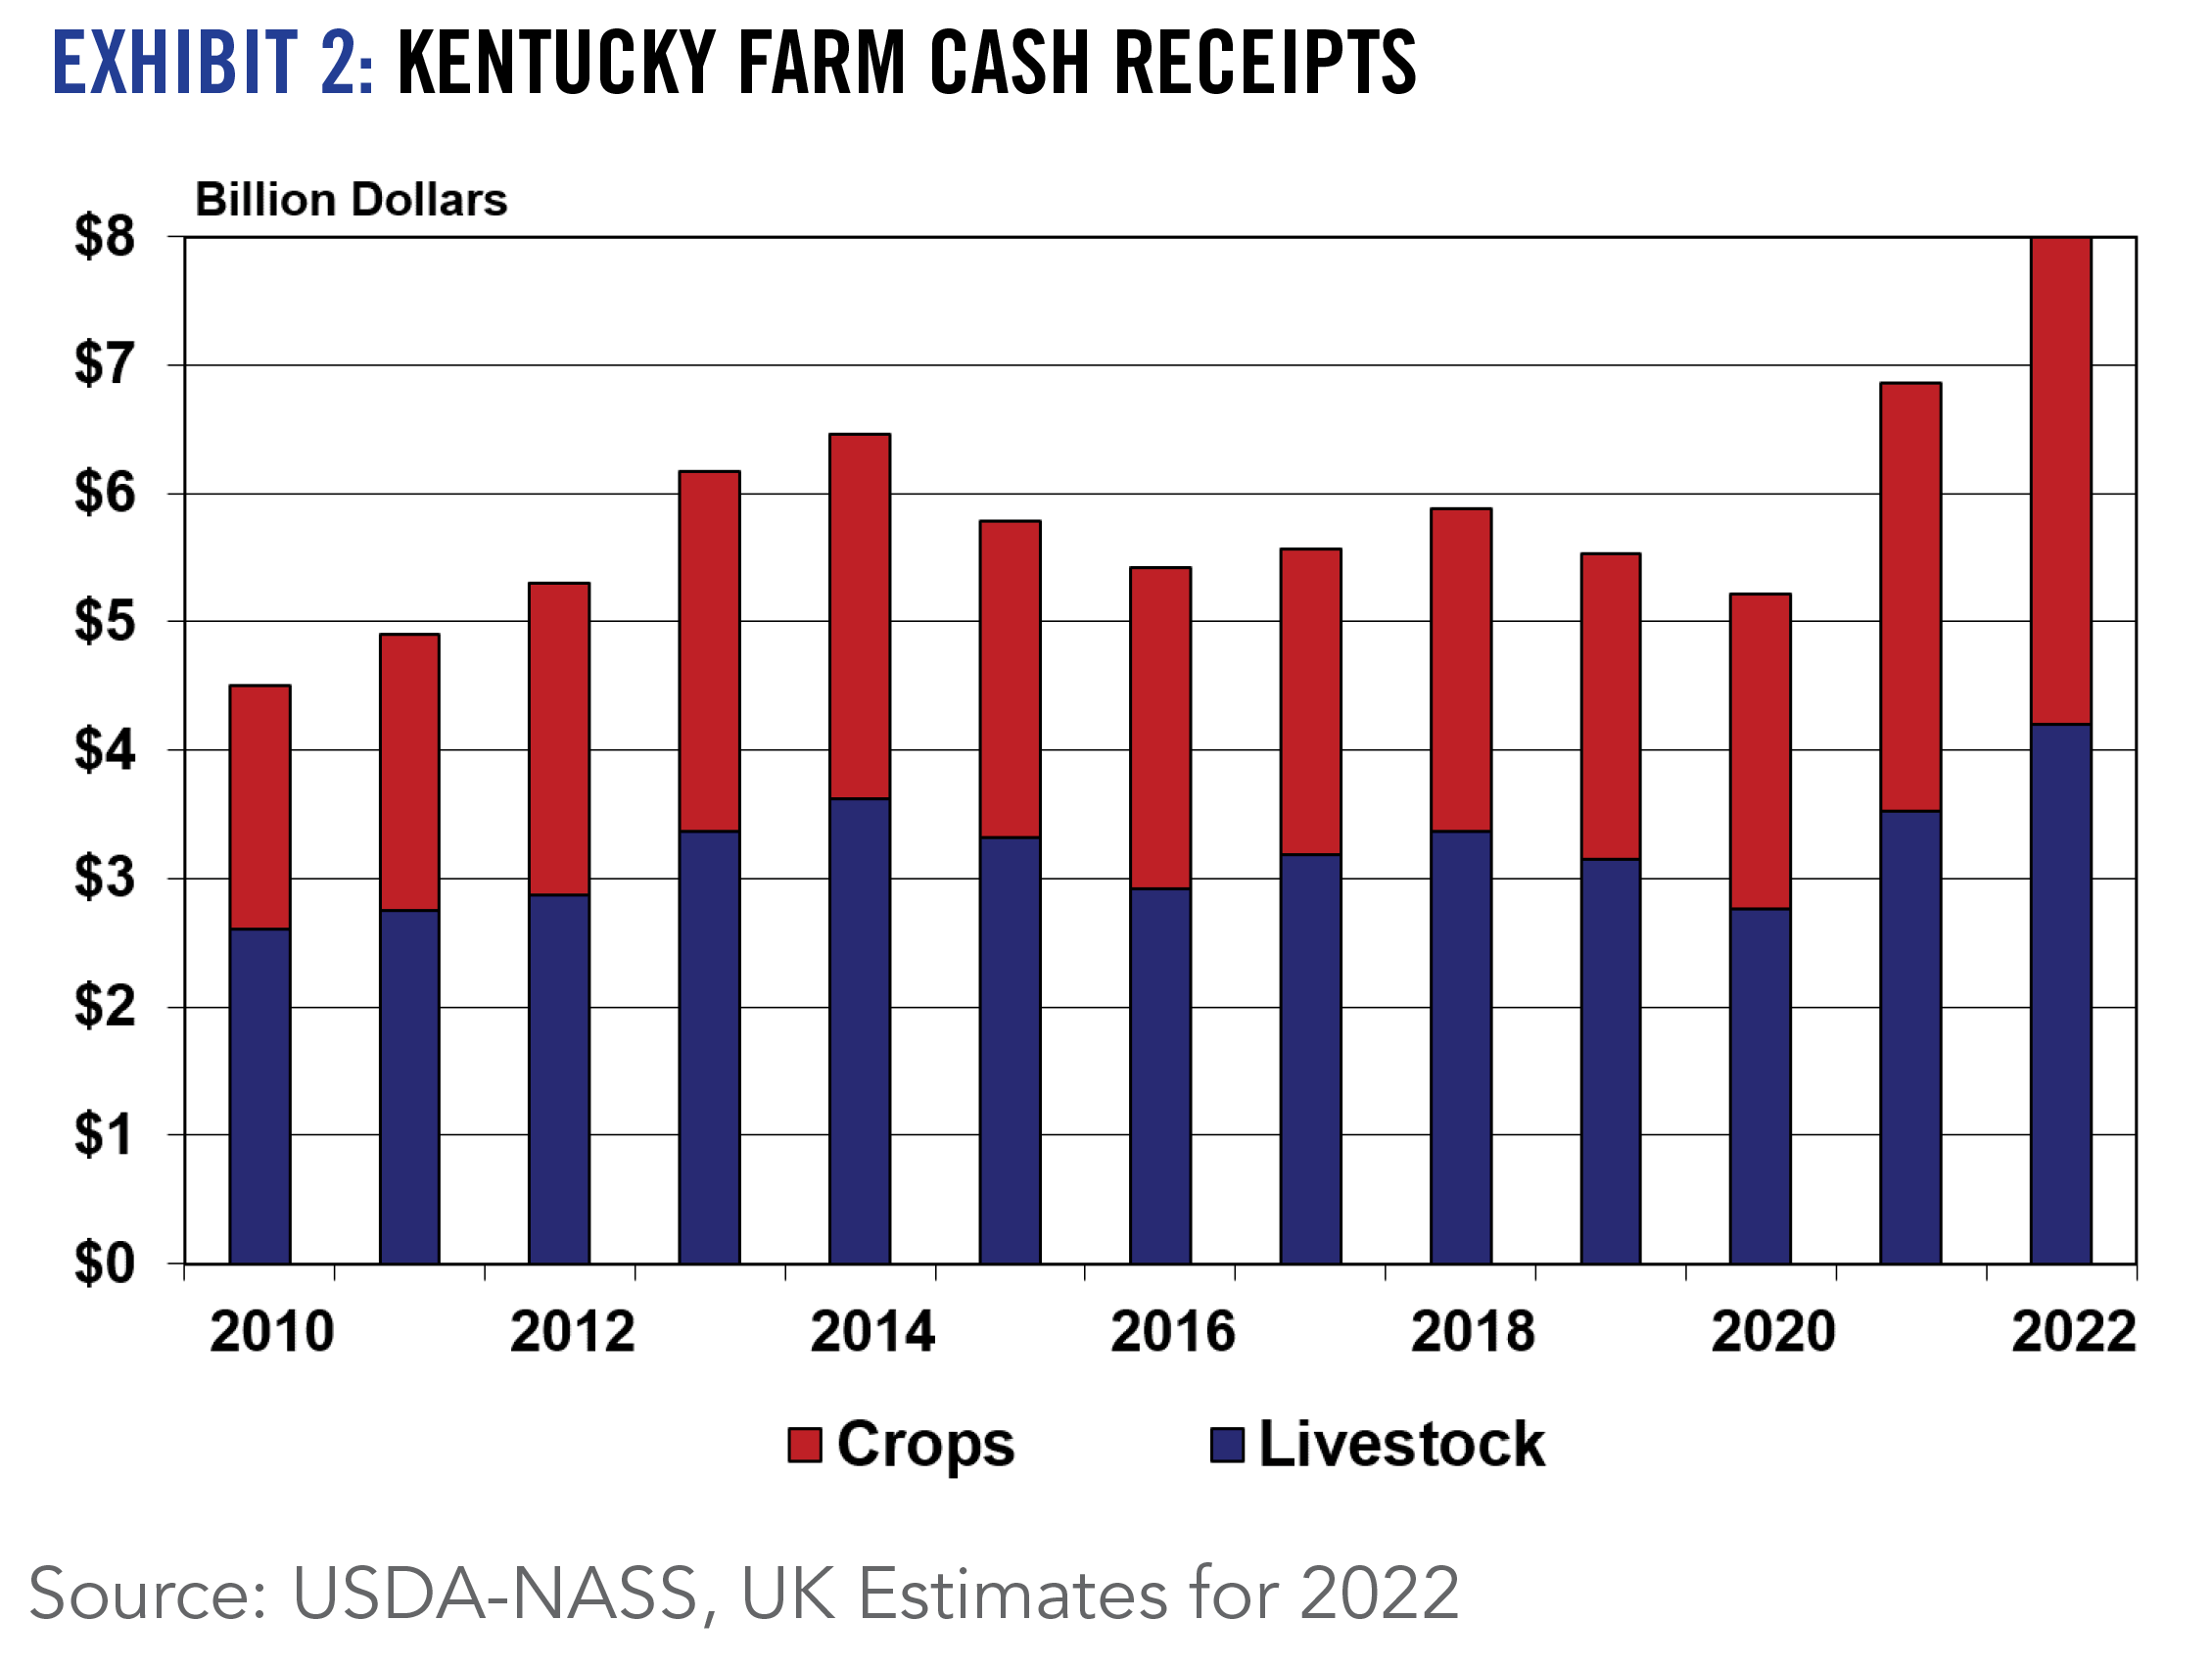
Despite slumping grain prices and weather-related challenges this past growing season, agricultural economists at the UK Martin-Gatton College of Agriculture, Food, and Environment are forecasting that Kentucky ag cash receipts may have actually increased in 2024 to near record high levels. While Kentucky crop receipts are expected to fall by 12.6% in 2024, livestock receipts are projected to increase by 16.8%. Consequently, Kentucky’s 2024 estimated ag cash receipts of $8.3 billion may challenge a similar record high level achieved in 2022. Official state ag cash receipts will be released by USDA in September 2025. Keep in mind that these data represent gross cash sales, and thus do not reflect a large and growing sale of value-added ag/food products and agritourism dollars along with forestry receipts.
Kentucky net farm income averaged $1.7 billion from 2015-2020, and more than doubled to $3.5 billion in 2021-2022, before slipping to $2.7 billion in 2023. Even with anticipated higher cash receipts, net farm income for Kentucky farmers will likely follow national trends by declining in 2024 in response to higher input costs, limited government payments and lower valued crop inventories. Nevertheless, Kentucky net farm income should hover around $2.5 billion in 2024, much lower than the 2021/2022 record levels, but still above the pre-Covid years, even after adjusting for inflation.
2025 Outlook
Kentucky farmers, especially grain farmers, will enter 2025 on a very concerning note. Grain prices are not expected to rebound, unless there is a significant global weather event depleting excess supplies. Cash remains tight and rental rates are slow to adjust to changing market conditions. Fortunately for Kentucky agriculture, current national cattle inventories will allow cattle prices to remain relatively high in 2025 as the industry awaits any signs of expansion.
While feed and fuel prices may remain at favorable levels, labor and animal replacement costs will likely remain relatively high. Interest rates could slide modestly, but interest expenses may still increase with higher rates of borrowing in response to depleted cash levels.
Markets entering 2025 remain cautious depending on a lot of heightened regulatory and farm/trade policy uncertainty as farmers and other ag businesses attempt to navigate the potential outcomes evolving from a change in the White House and Congress.
- Will our trade policy lead to a large increase in tariffs and if so, how will our competitors/customers respond?
- What about a farm bill – will one be passed? If so, what will be the structure of the farm safety net?
- What about changes in U.S. energy and immigration policies? How much, if any, will the Federal Reserve lower interest rates, amidst expected lower, but continuing stubborn inflation which could be reignited in a potential trade war? How will this impact the value of the U.S. dollar and exports?
- Will land values and balance sheets remain relatively strong?
- Will China, Mexico, and Canada remain strong export markets for U.S. agriculture. Can the U.S. further diversify its export base?
- What about outcomes for ag markets from ongoing geopolitical events Ukraine/Russia and Middle East, and perhaps others that evolve?
U.S. Net Farm Income
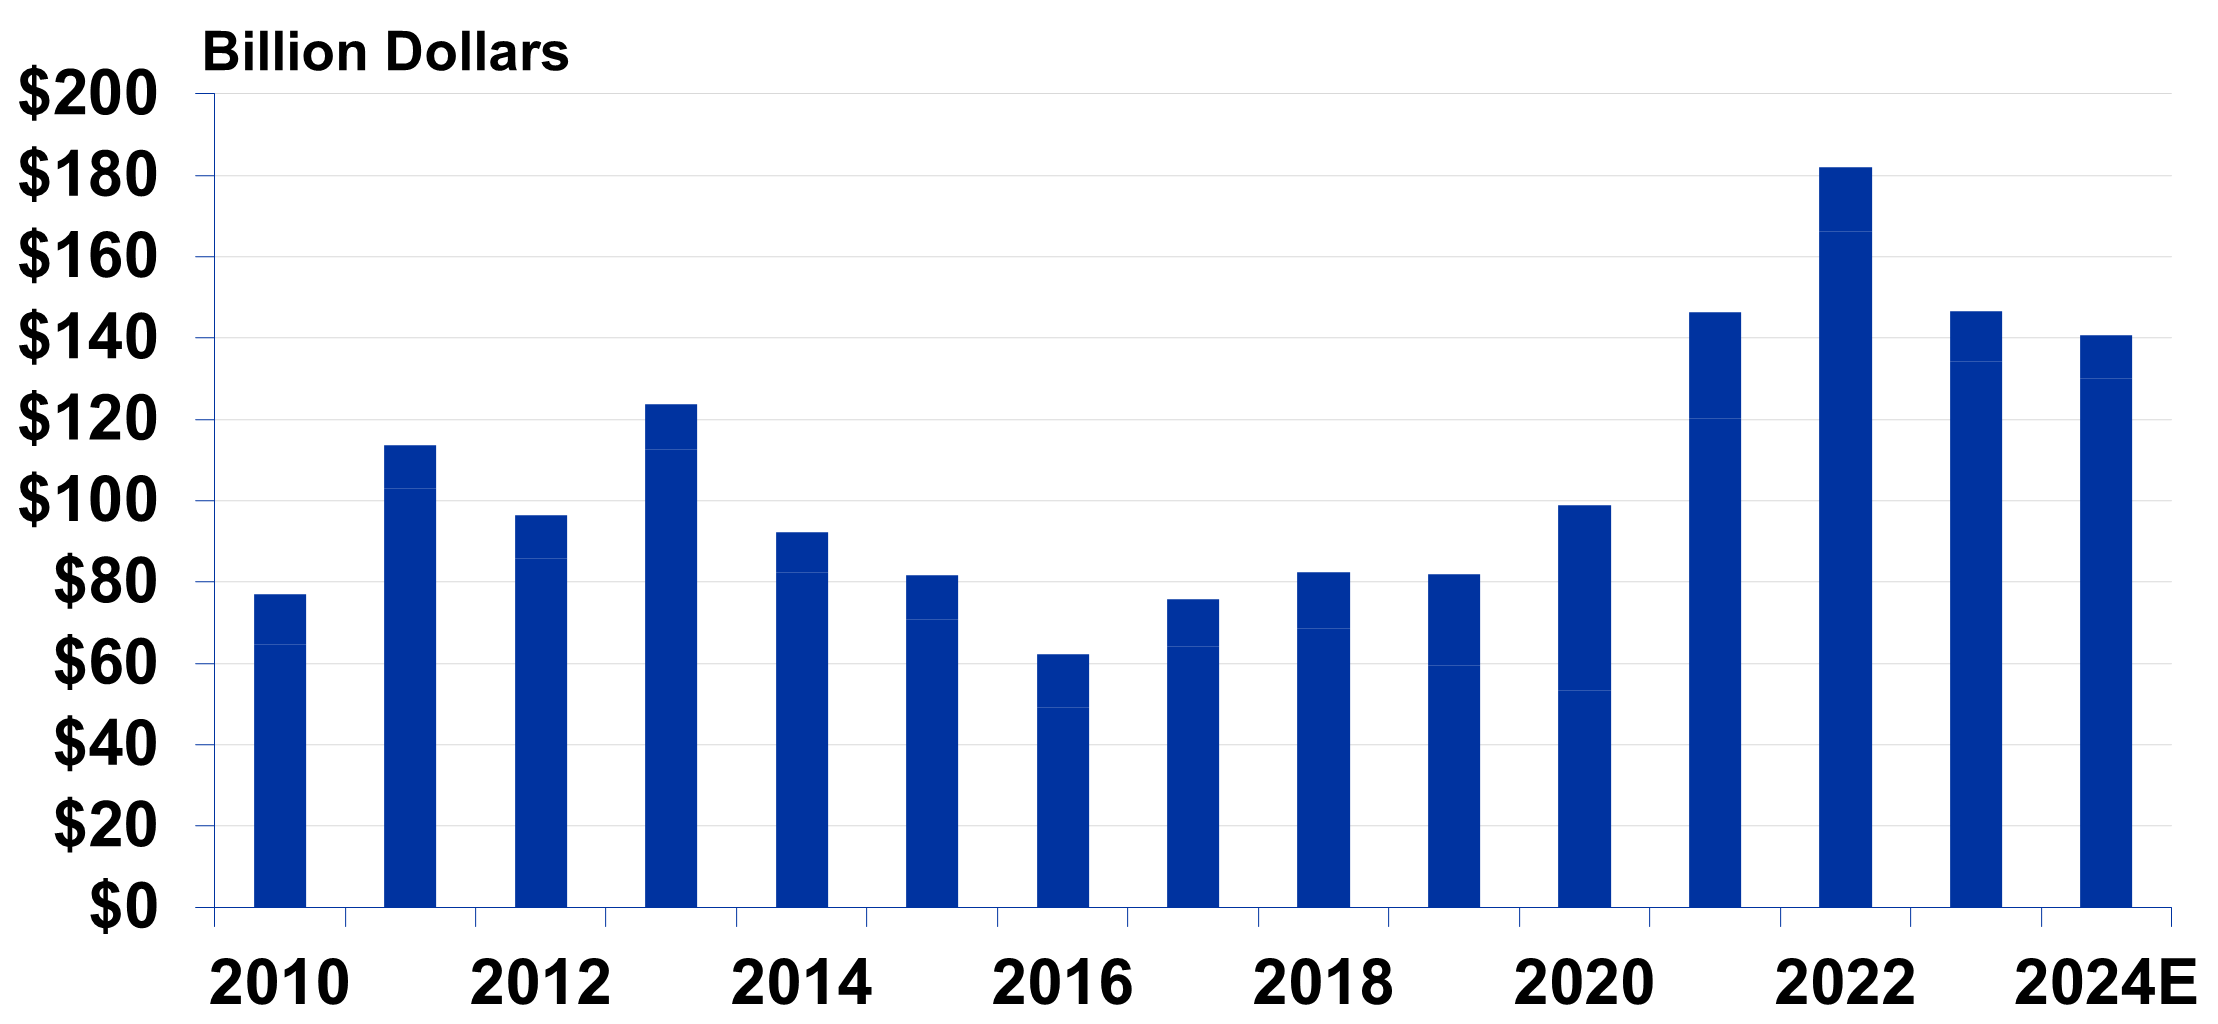
Source: ERS/USDA
Kentucky Farm Cash Receipts
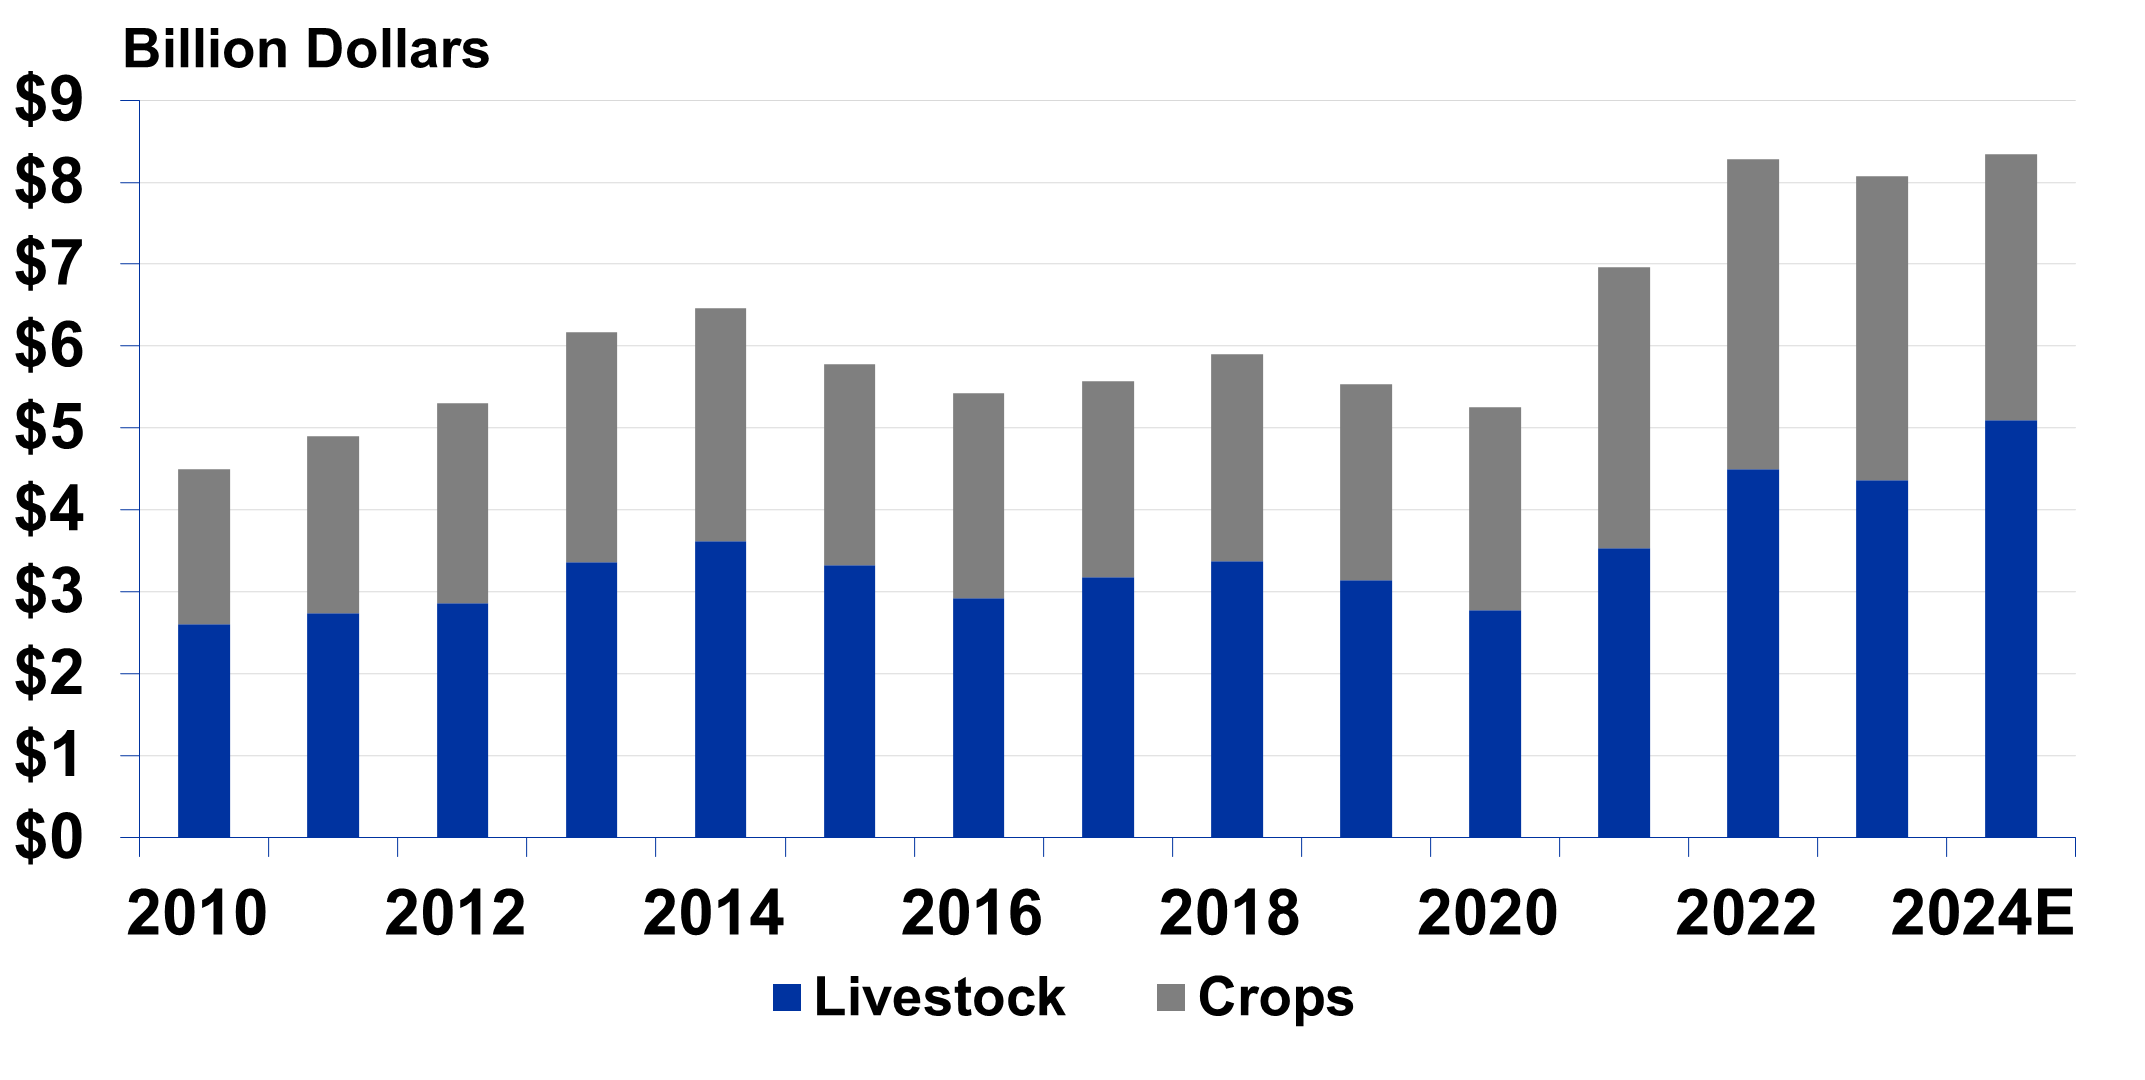
Source: KY Ag Stats/NASS and UK Estimates for 2024 (12/5/2024)
2024 Overview
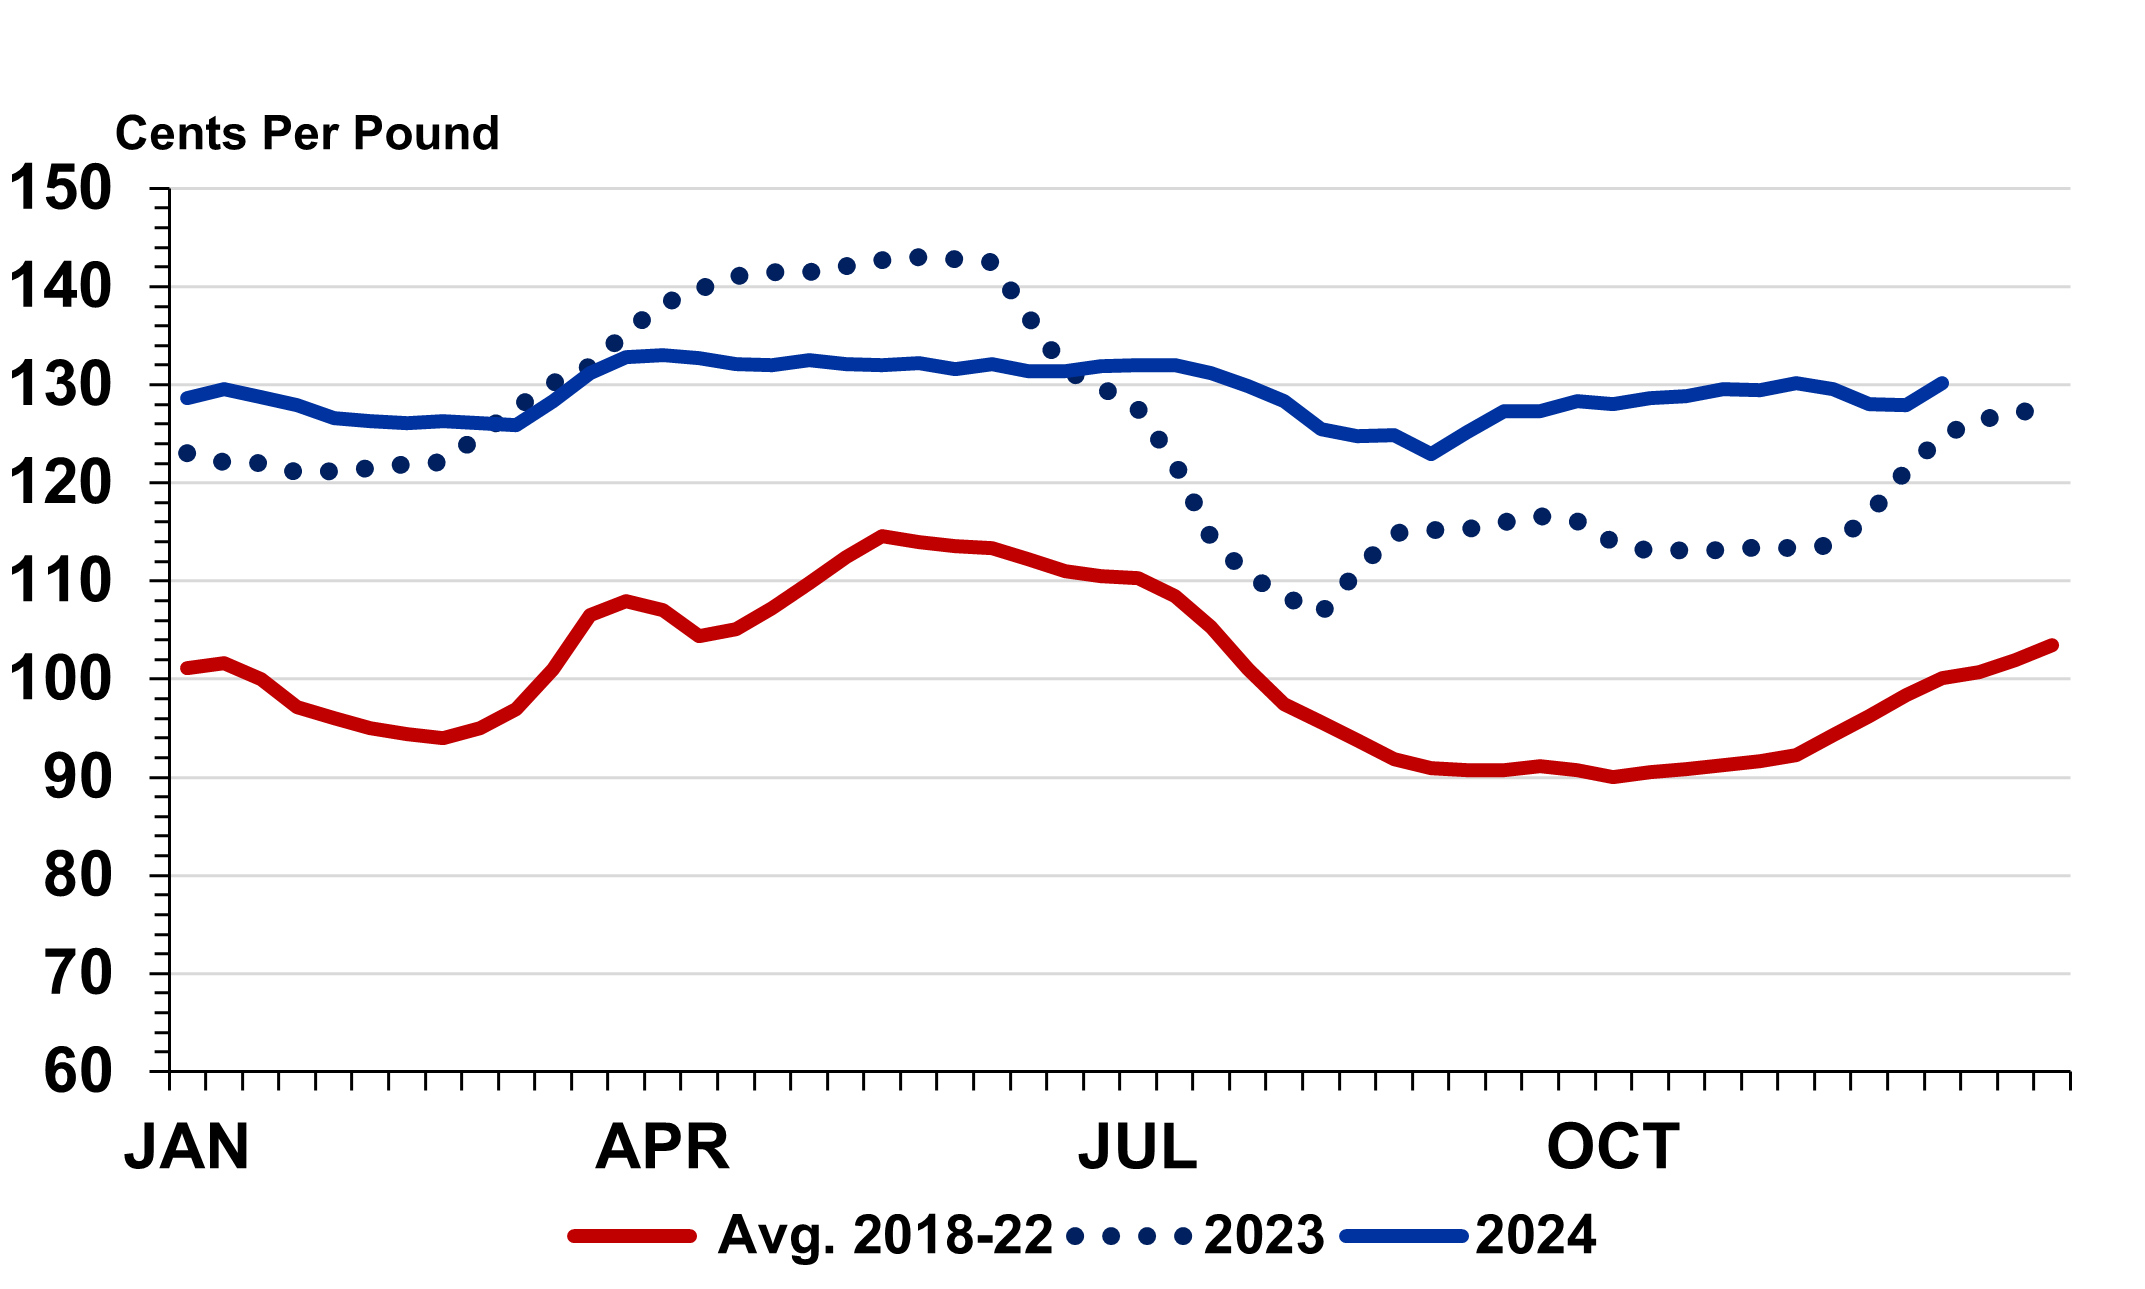
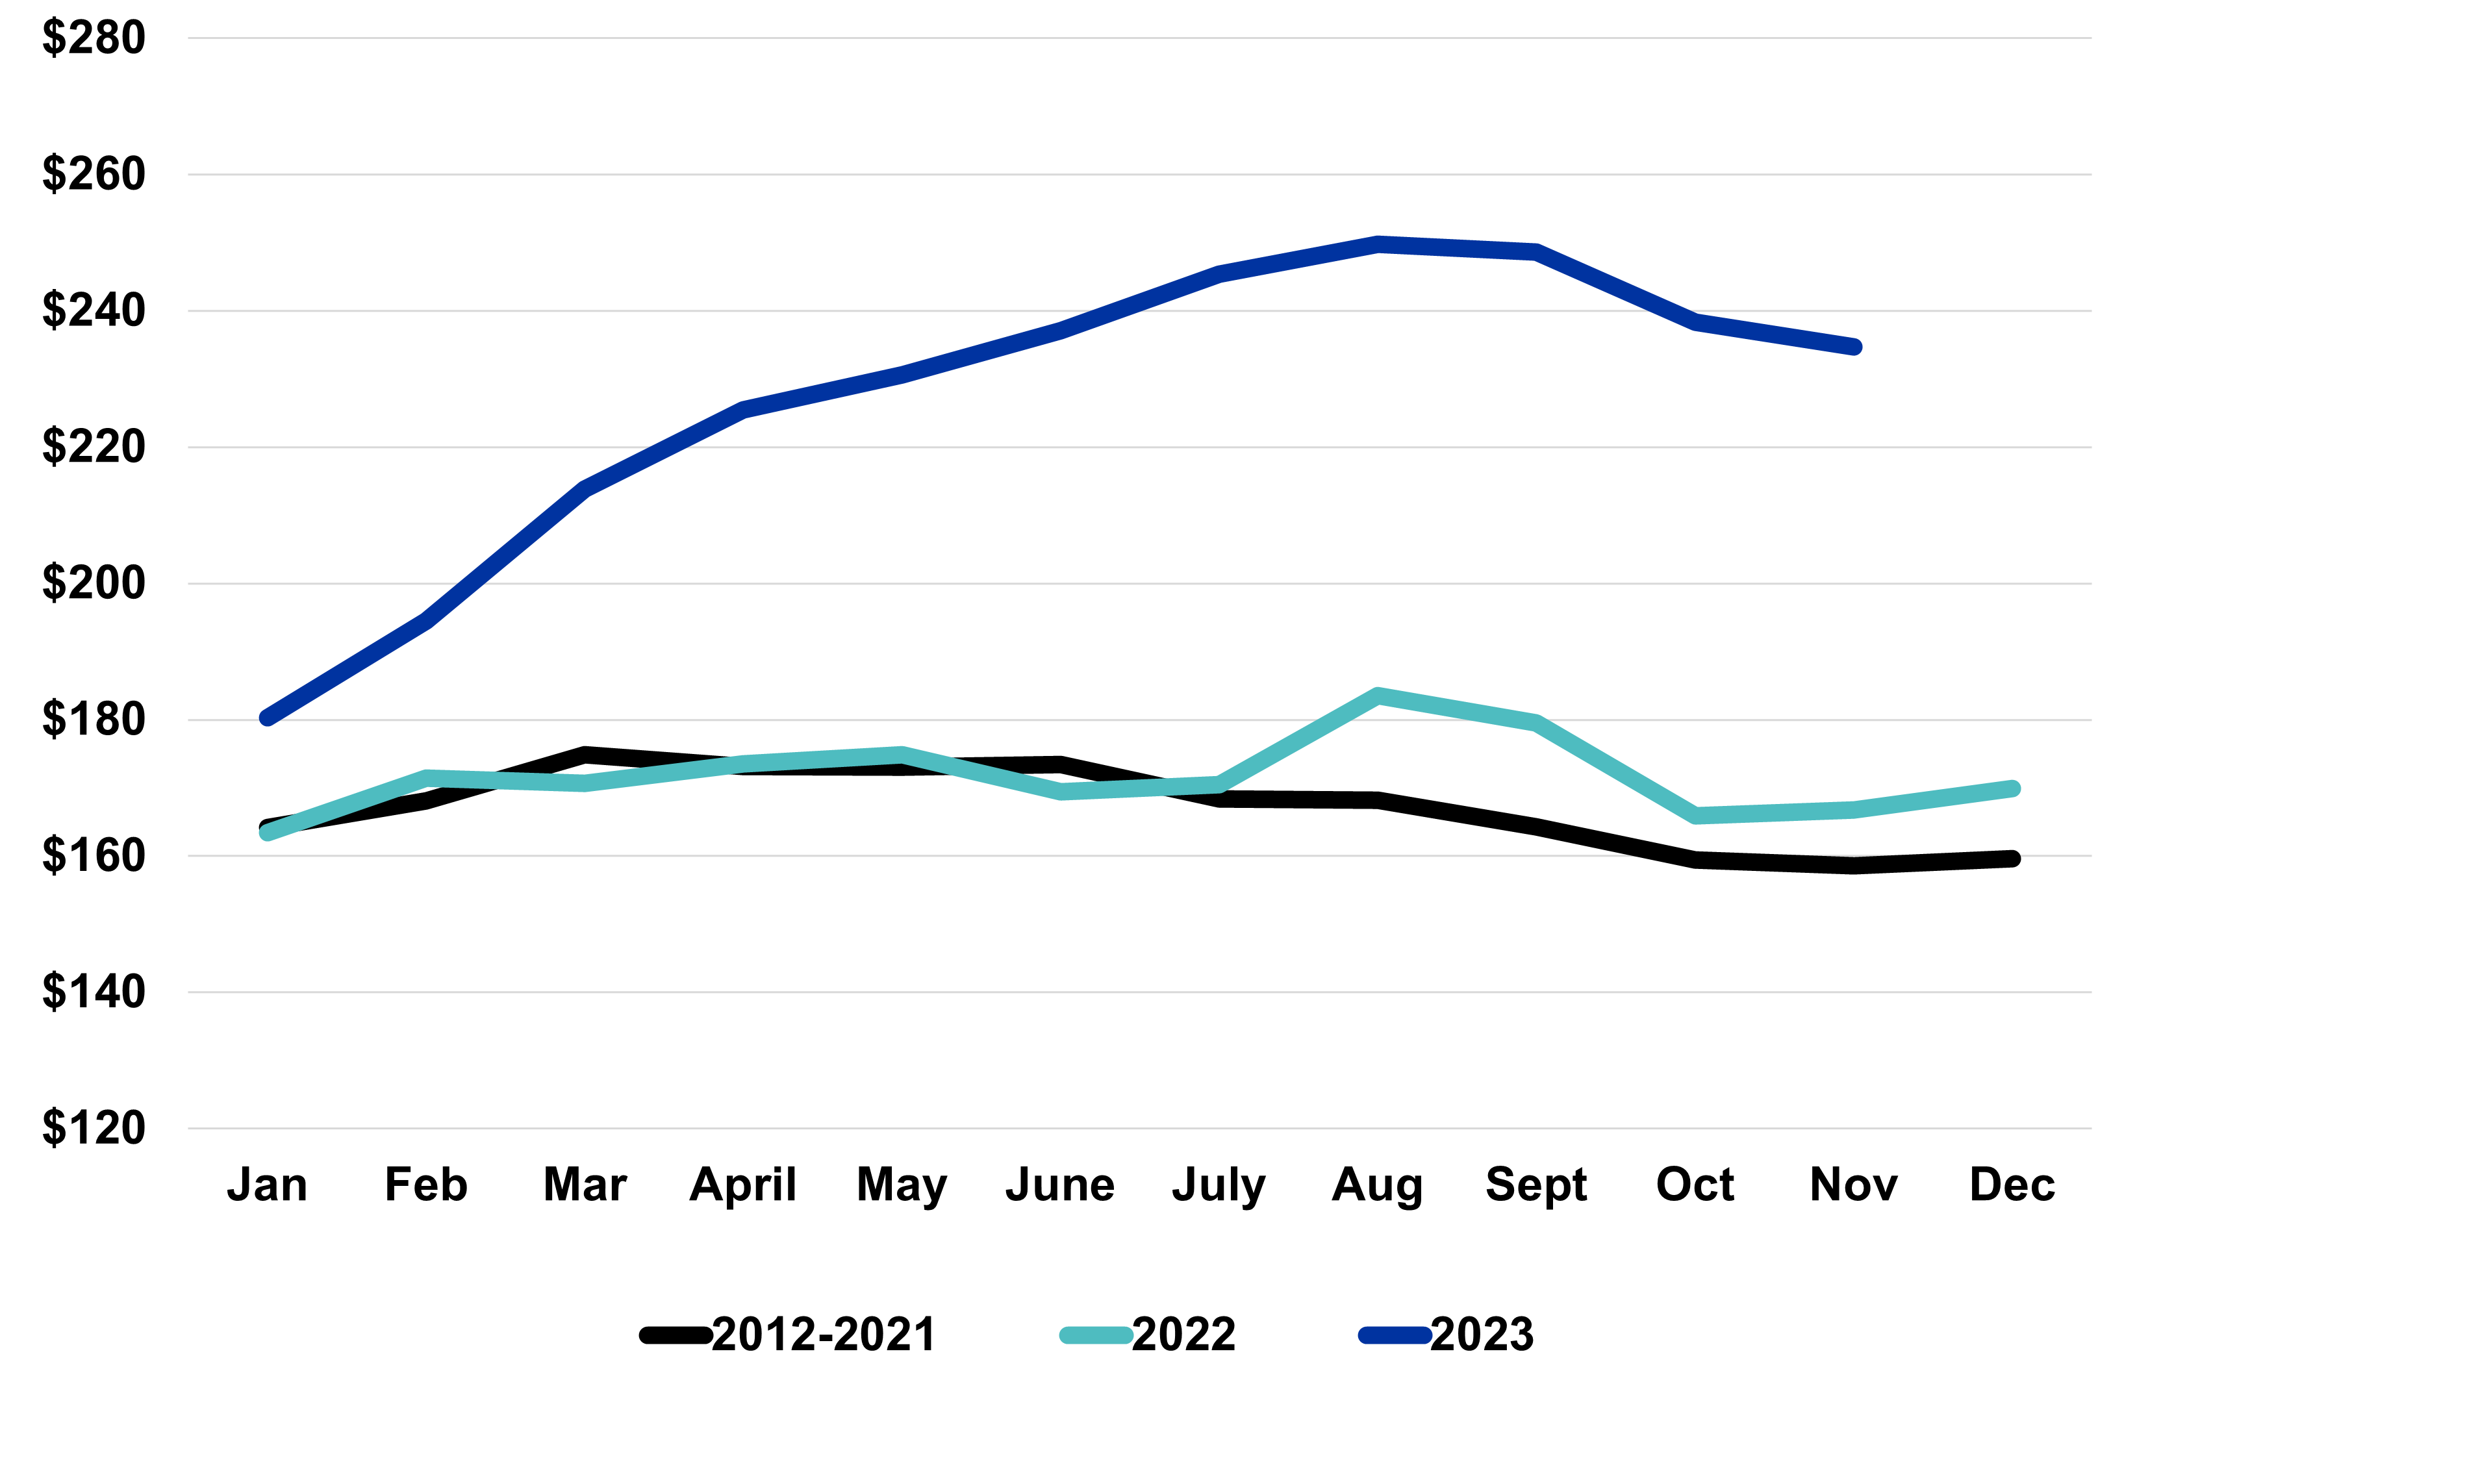
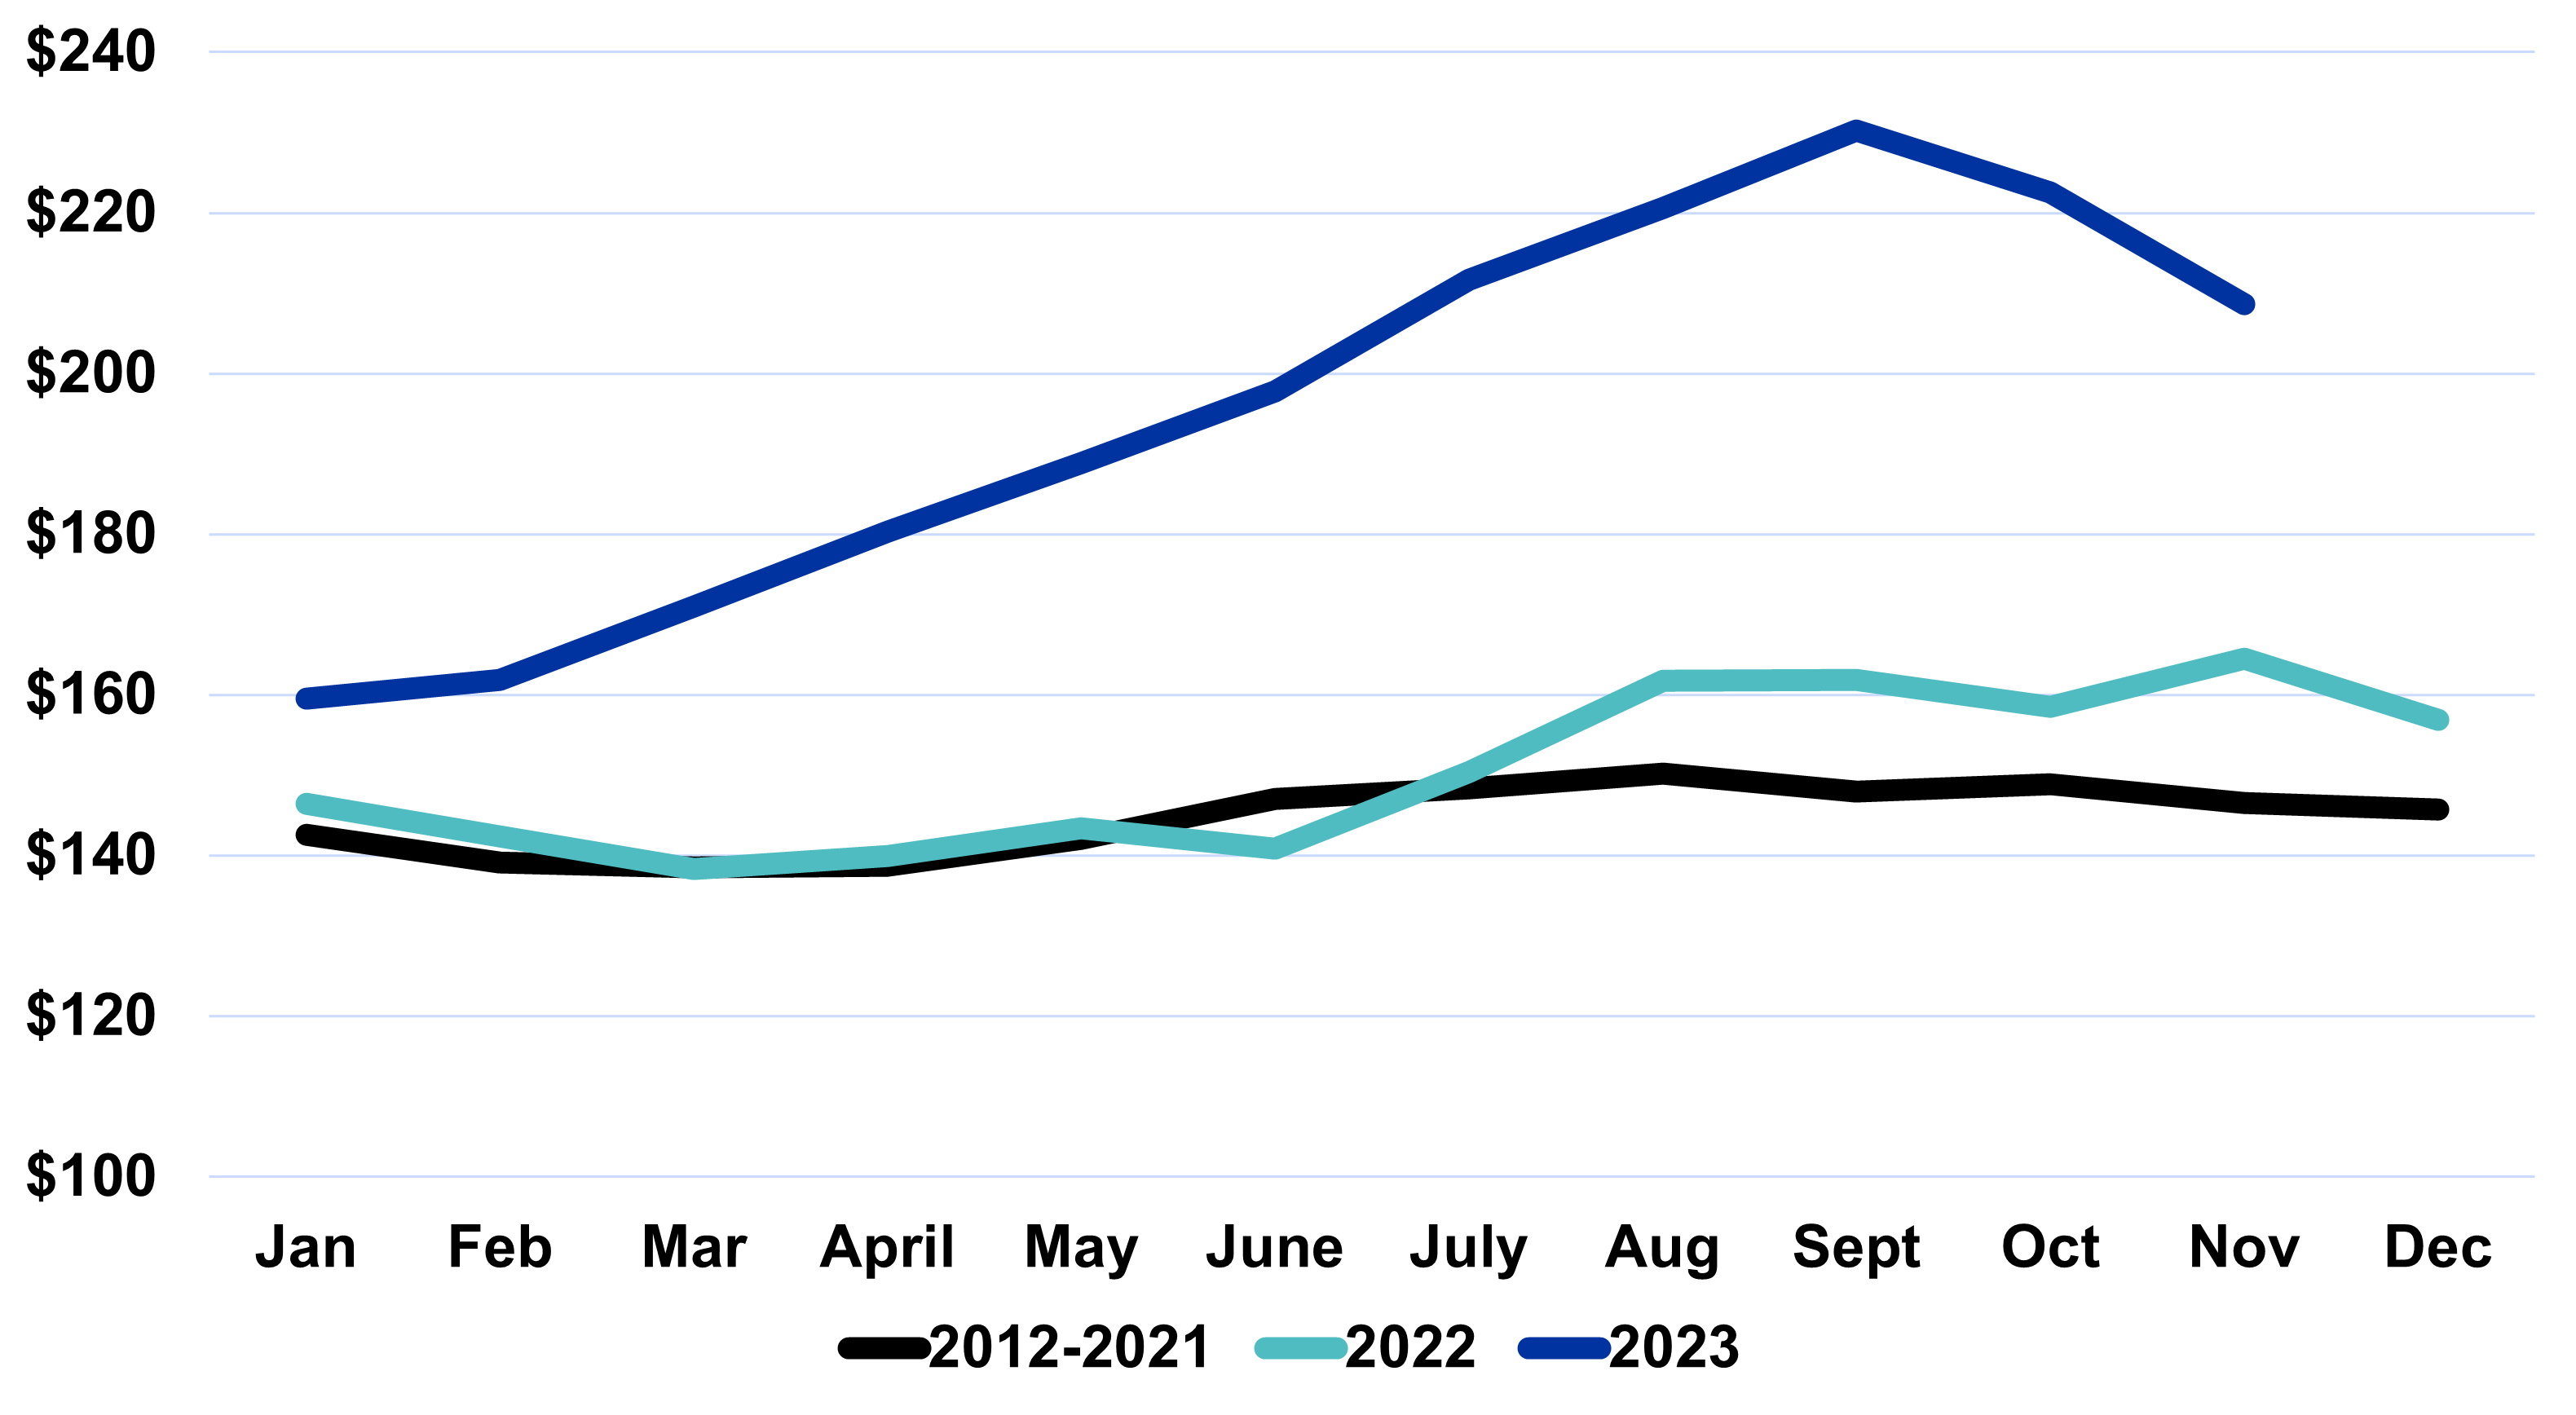
The beef cattle sector entered 2024 with beef cow inventory at a 63-year low. Tight supplies drove cattle markets during the year with calf and feeder cattle prices $30-$50 per cwt higher than 2023. Beef production was essentially unchanged from last year as cheaper feed led to longer feeding periods and higher finished weights. An increase was also seen in live cattle imports. Feeder cattle prices did pull back sharply from summer to early fall but increased counter-seasonally as we moved through fall and into winter as winter wheat grazing prospects improved. In late November, cattle markets moved higher again after New World Screwworm was found in Southern Mexico, leading to bans on the importation of live cattle originating from there.
2025 Outlook
Despite the strong calf markets, there is little indication that herd expansion has begun. A large number of factors are at play here including higher production costs, weather challenges, strong cull cow prices, and high interest rates. The beef cow herd will be smaller in 2025 than it was in 2024, which means calf supply will be even tighter. If weather cooperates and heifer retention does begin in 2025, this will only further tighten calf supplies. While there are always factors that can negatively impact markets (geopolitical concerns, inflation, etc.), the supply fundamentals are very encouraging for the next couple of years. Beef cattle producers should consider risk management strategies to protect themselves from downside risk but should also consider these markets as opportunities to invest in their operations to get where they want to be long term. For some farms, this may mean herd expansion. But for others this could mean investment in genetics, facilities, grazing systems or other things to improve efficiency and ability to add value to their cattle.
Kentucky Auction Prices, 550 lb. M/L #1-2 Steers ($ per cwt)
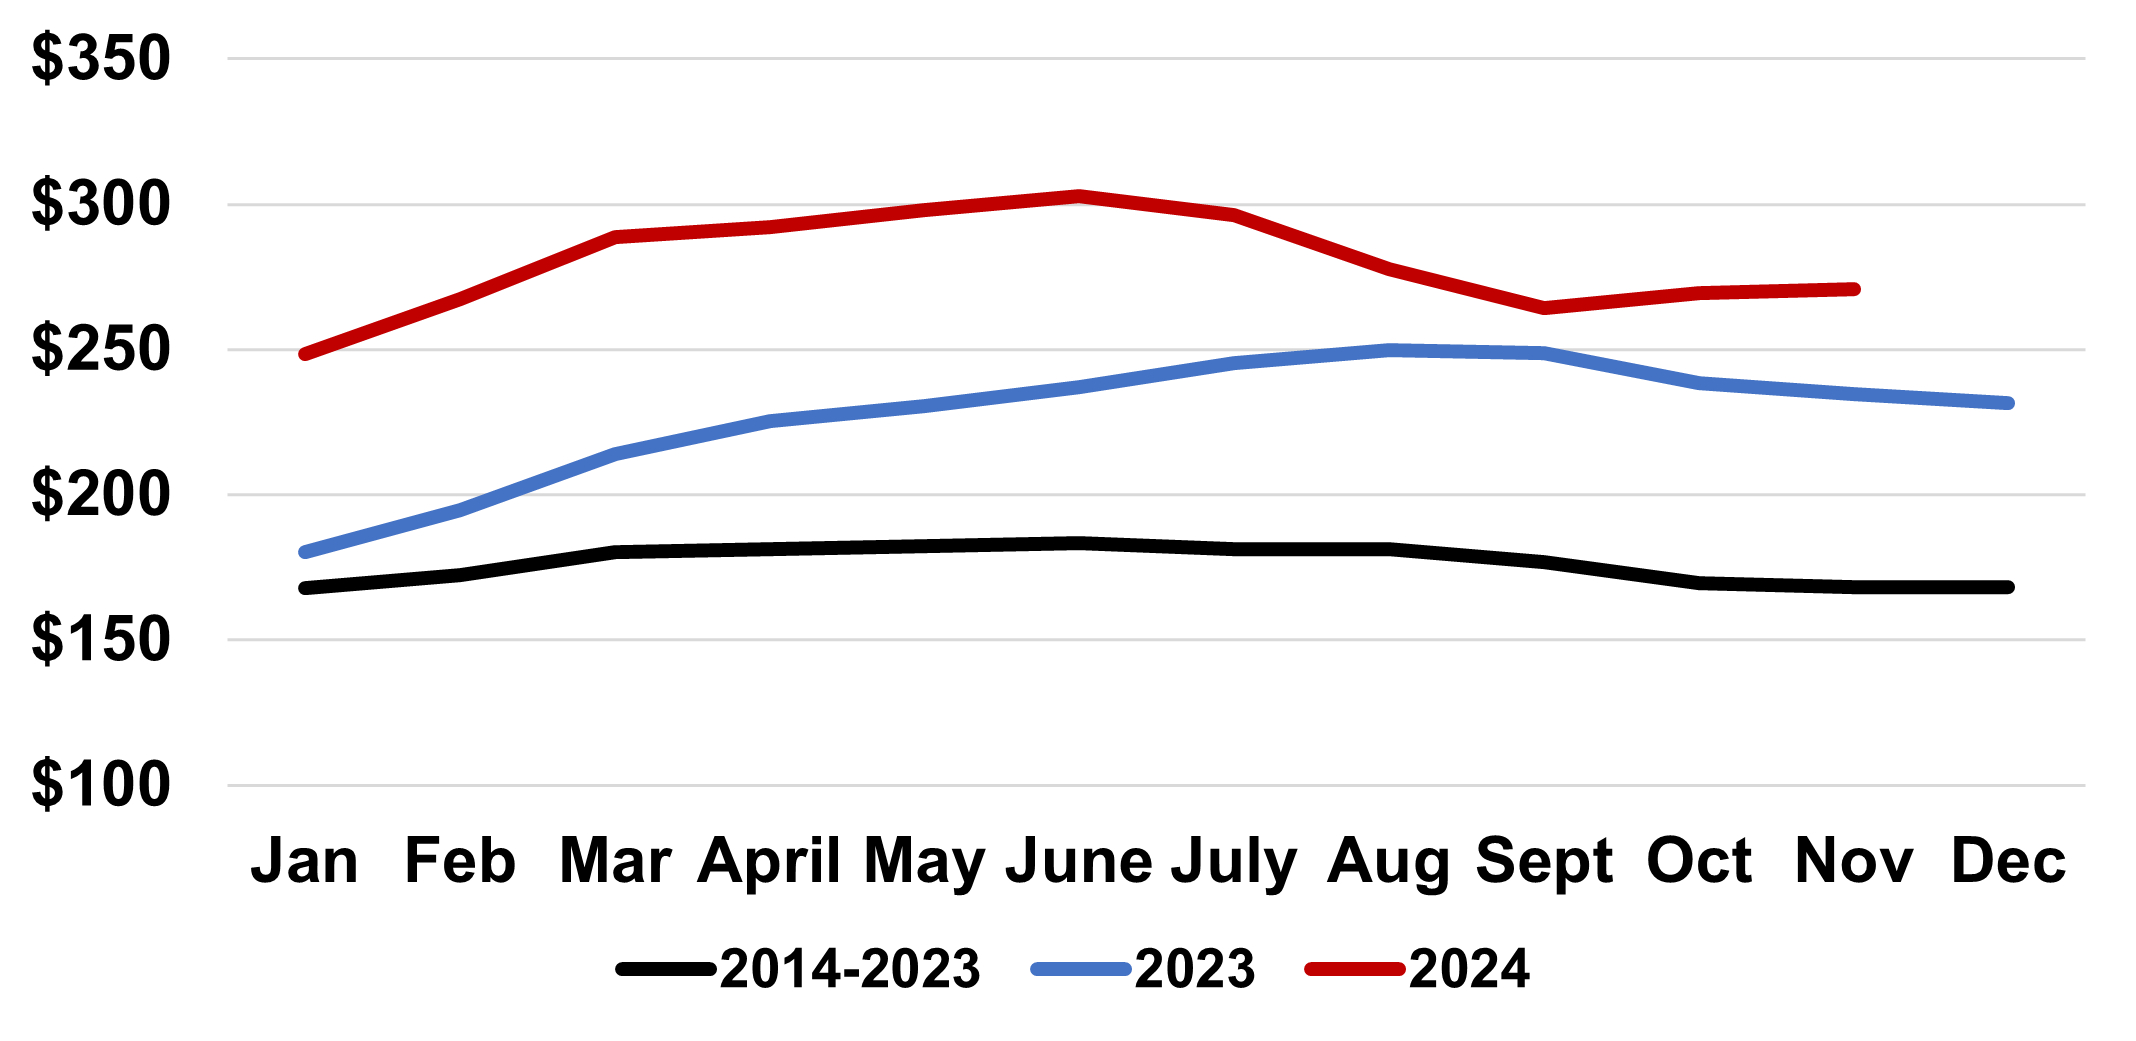
Source: USDA-AMS, author calculations
Kentucky Auction Prices, 850 Ib M/L #1-2 Steers ($ per cwt)
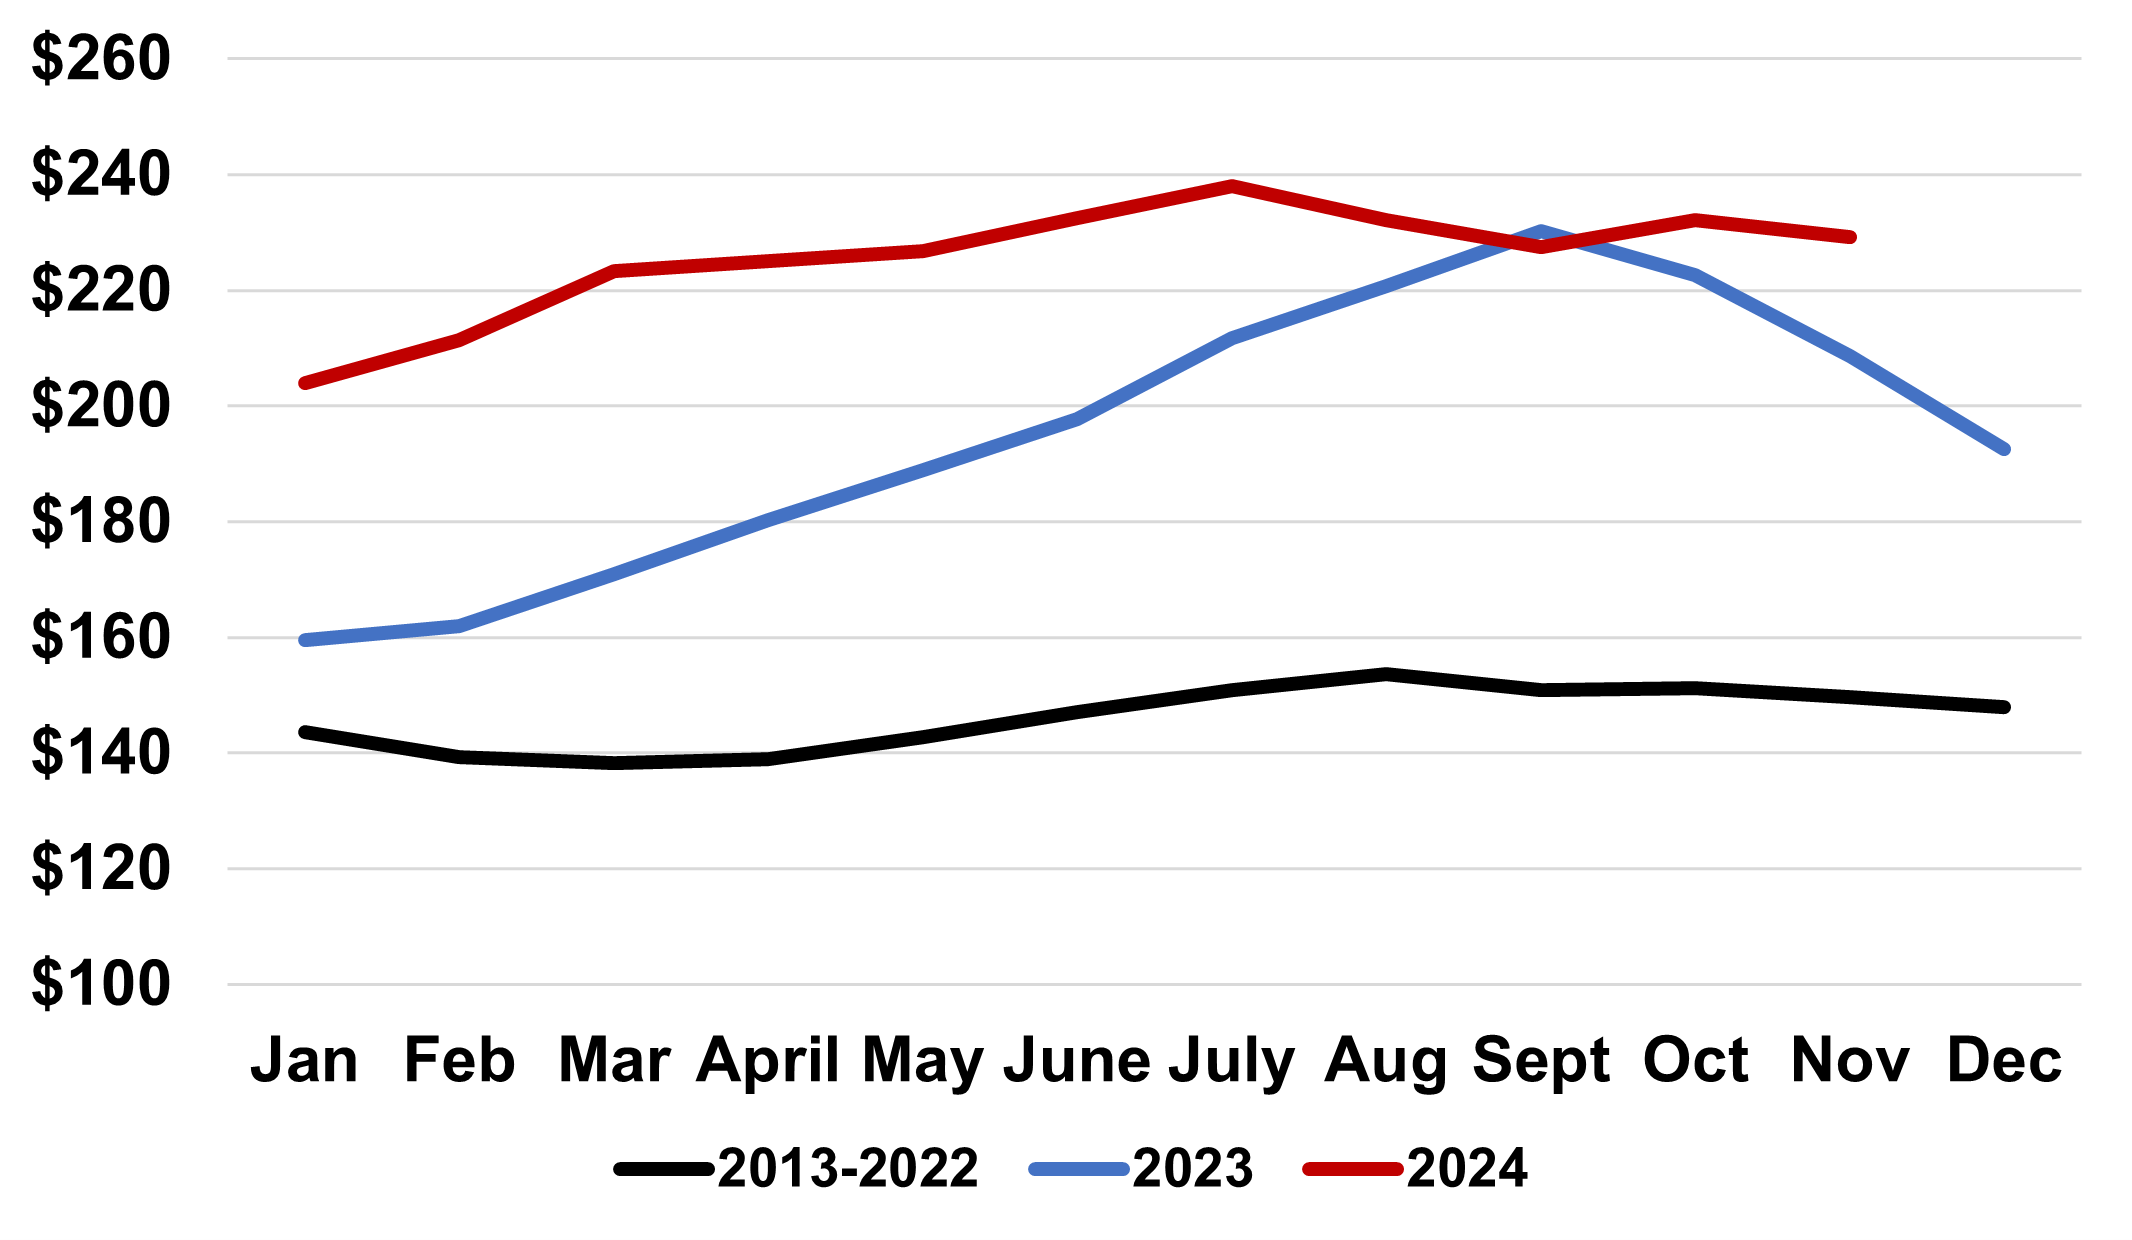
Source: USDA-AMS, author calculations
2024 Overview
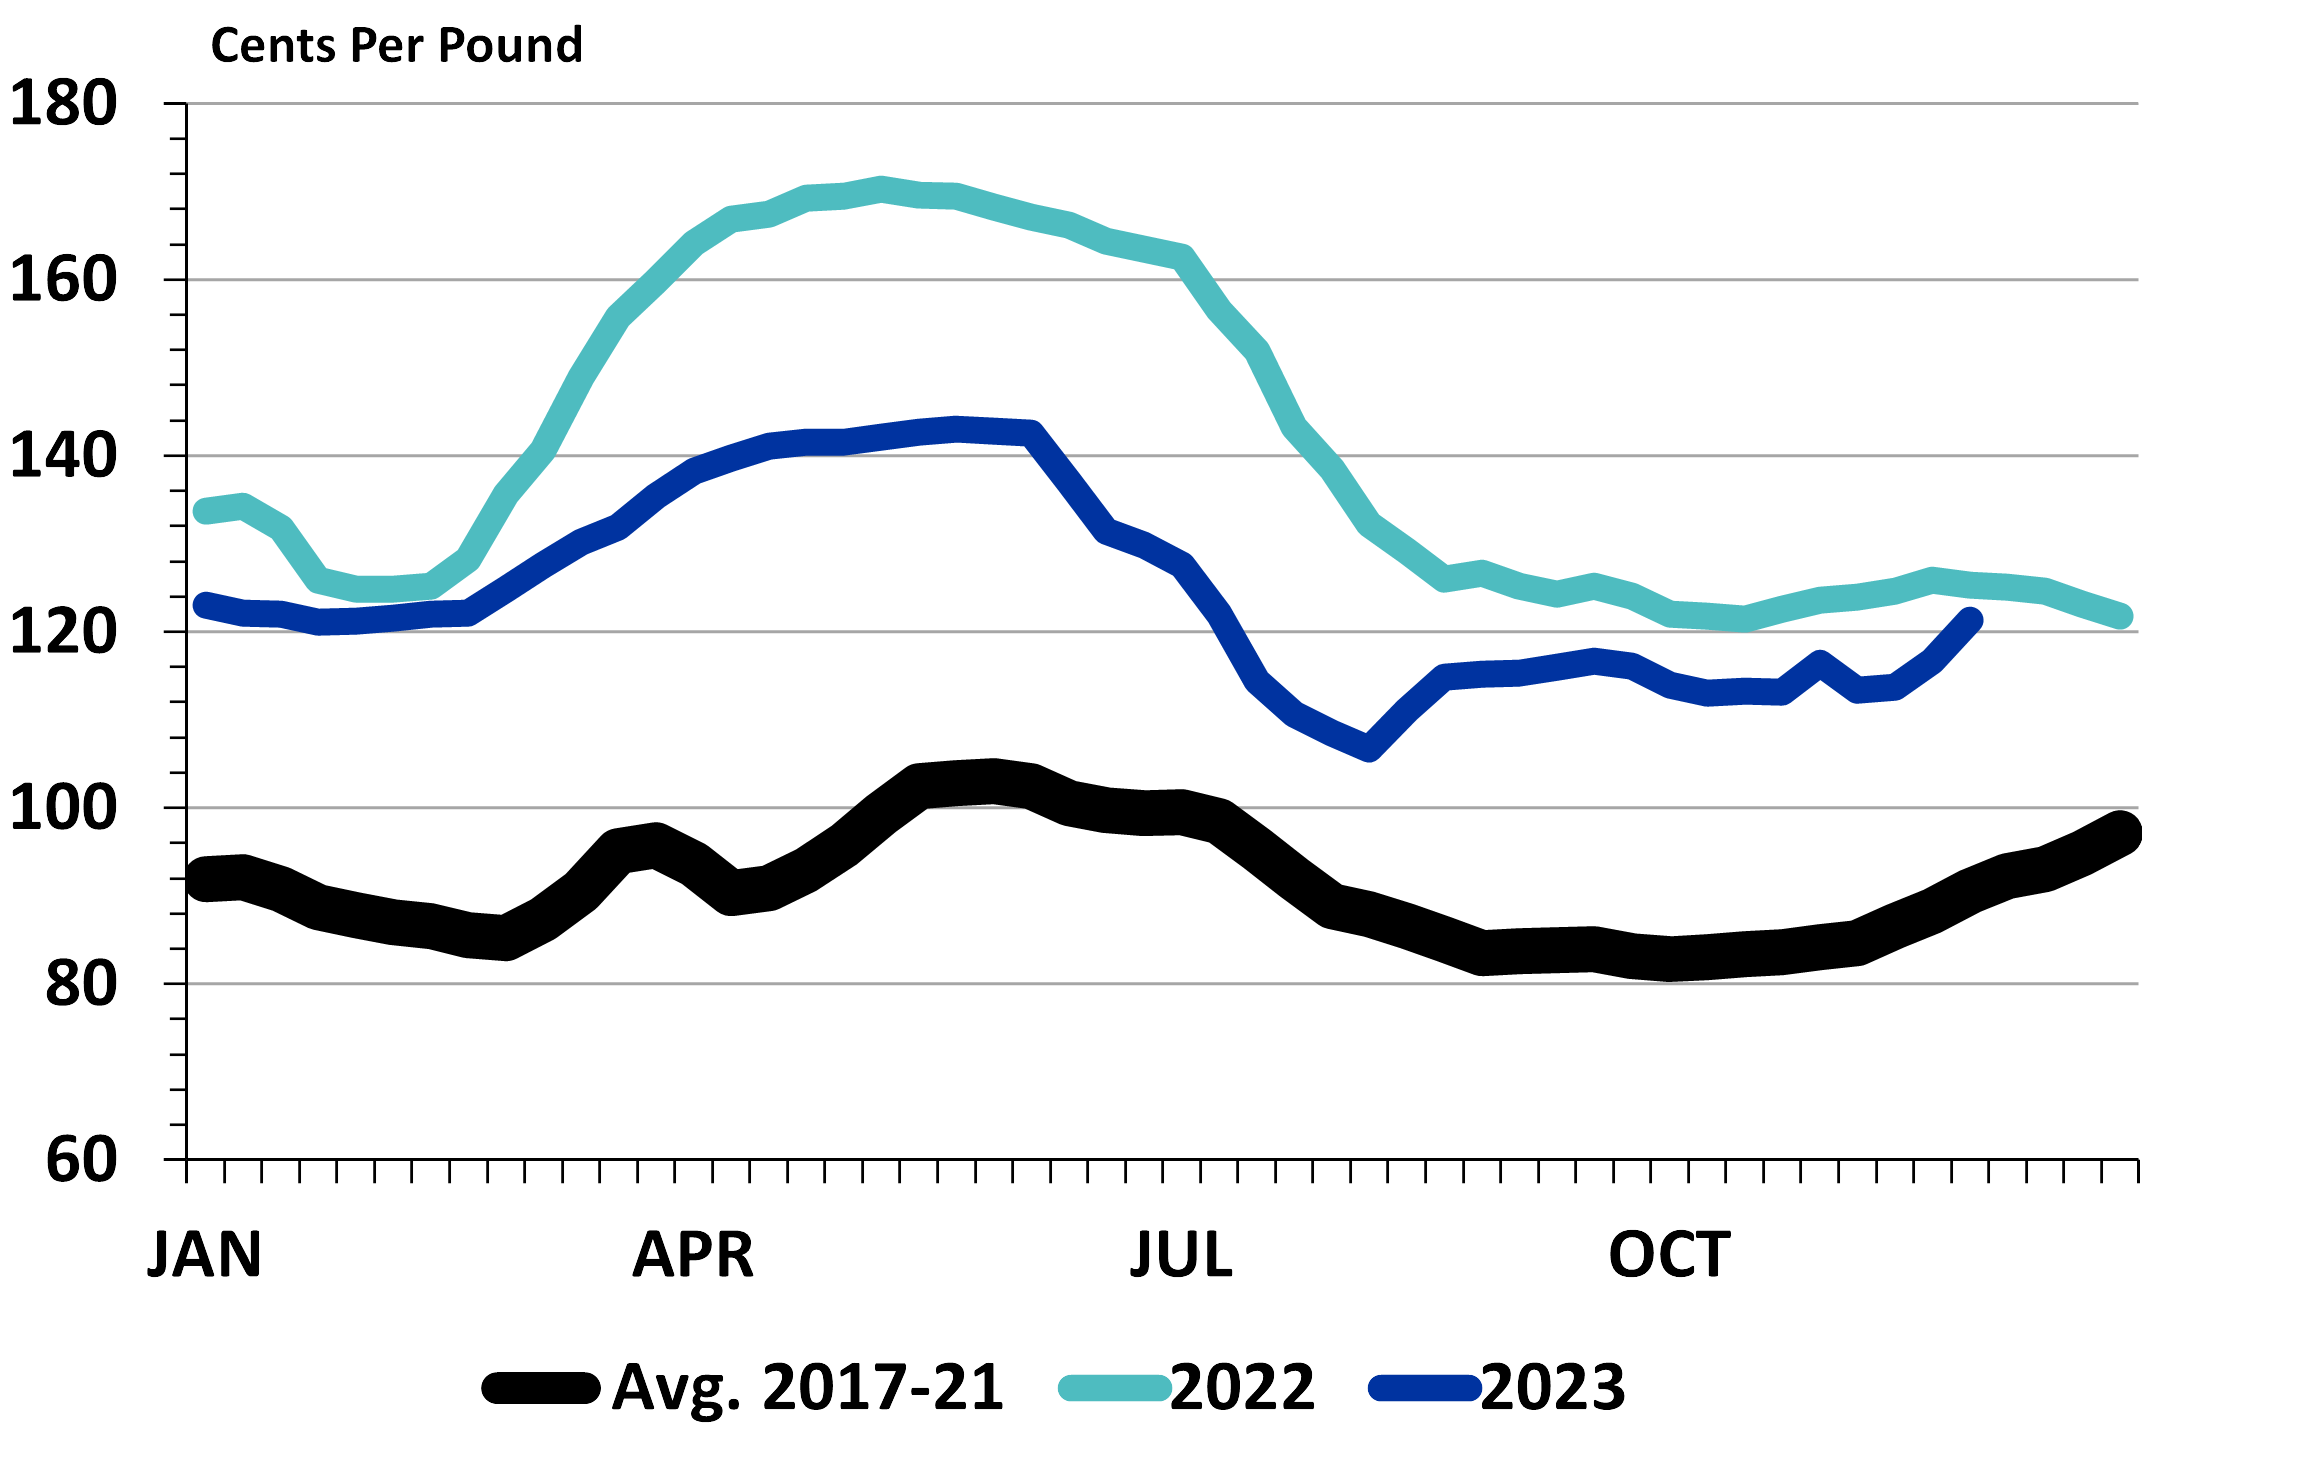
The story of 2023 was one of poultry plant closures and Avian Influenza. Fortunately, neither has dominated the discussion to the same extent in 2024. At the national level, broiler production will be up 1.5% to 2.0% for the year, while wholesale prices will be up by about 4% year-over-year. Higher production levels and stronger wholesale prices contributed to another increase in the value of broiler production in the Commonwealth. While a smaller share of the total market, egg prices were also up sharply (+72%) in 2024. Highly Pathogenic Avian Influenza hitting the layer sector was a major contributor nationally but was also lagged due to the time it takes for a layer to mature into producing eggs. Out times and operating costs continue to be a challenge for growers, but lower feed costs are positively impacting integrators.
2025 Outlook
Higher material and construction costs, combined with higher interest rates, continue to create challenges for new growers and those wishing to upgrade existing facilities. But at the same time, lower feed prices are improving profitability across the sector as a whole. This, combined with continued strength in protein values suggests that growth is again likely for 2025. While Avian Influenza cases are much less prevalent going into 2025, this always bears watching. Disease outbreaks and national disasters have proven to be the primary risk factors for the poultry sector over the last few years.
Broiler Prices, National Composite (Whole Bird), Weekly
Source: USDA-AMS, Livestock Marketing Information Center
2024 Overview
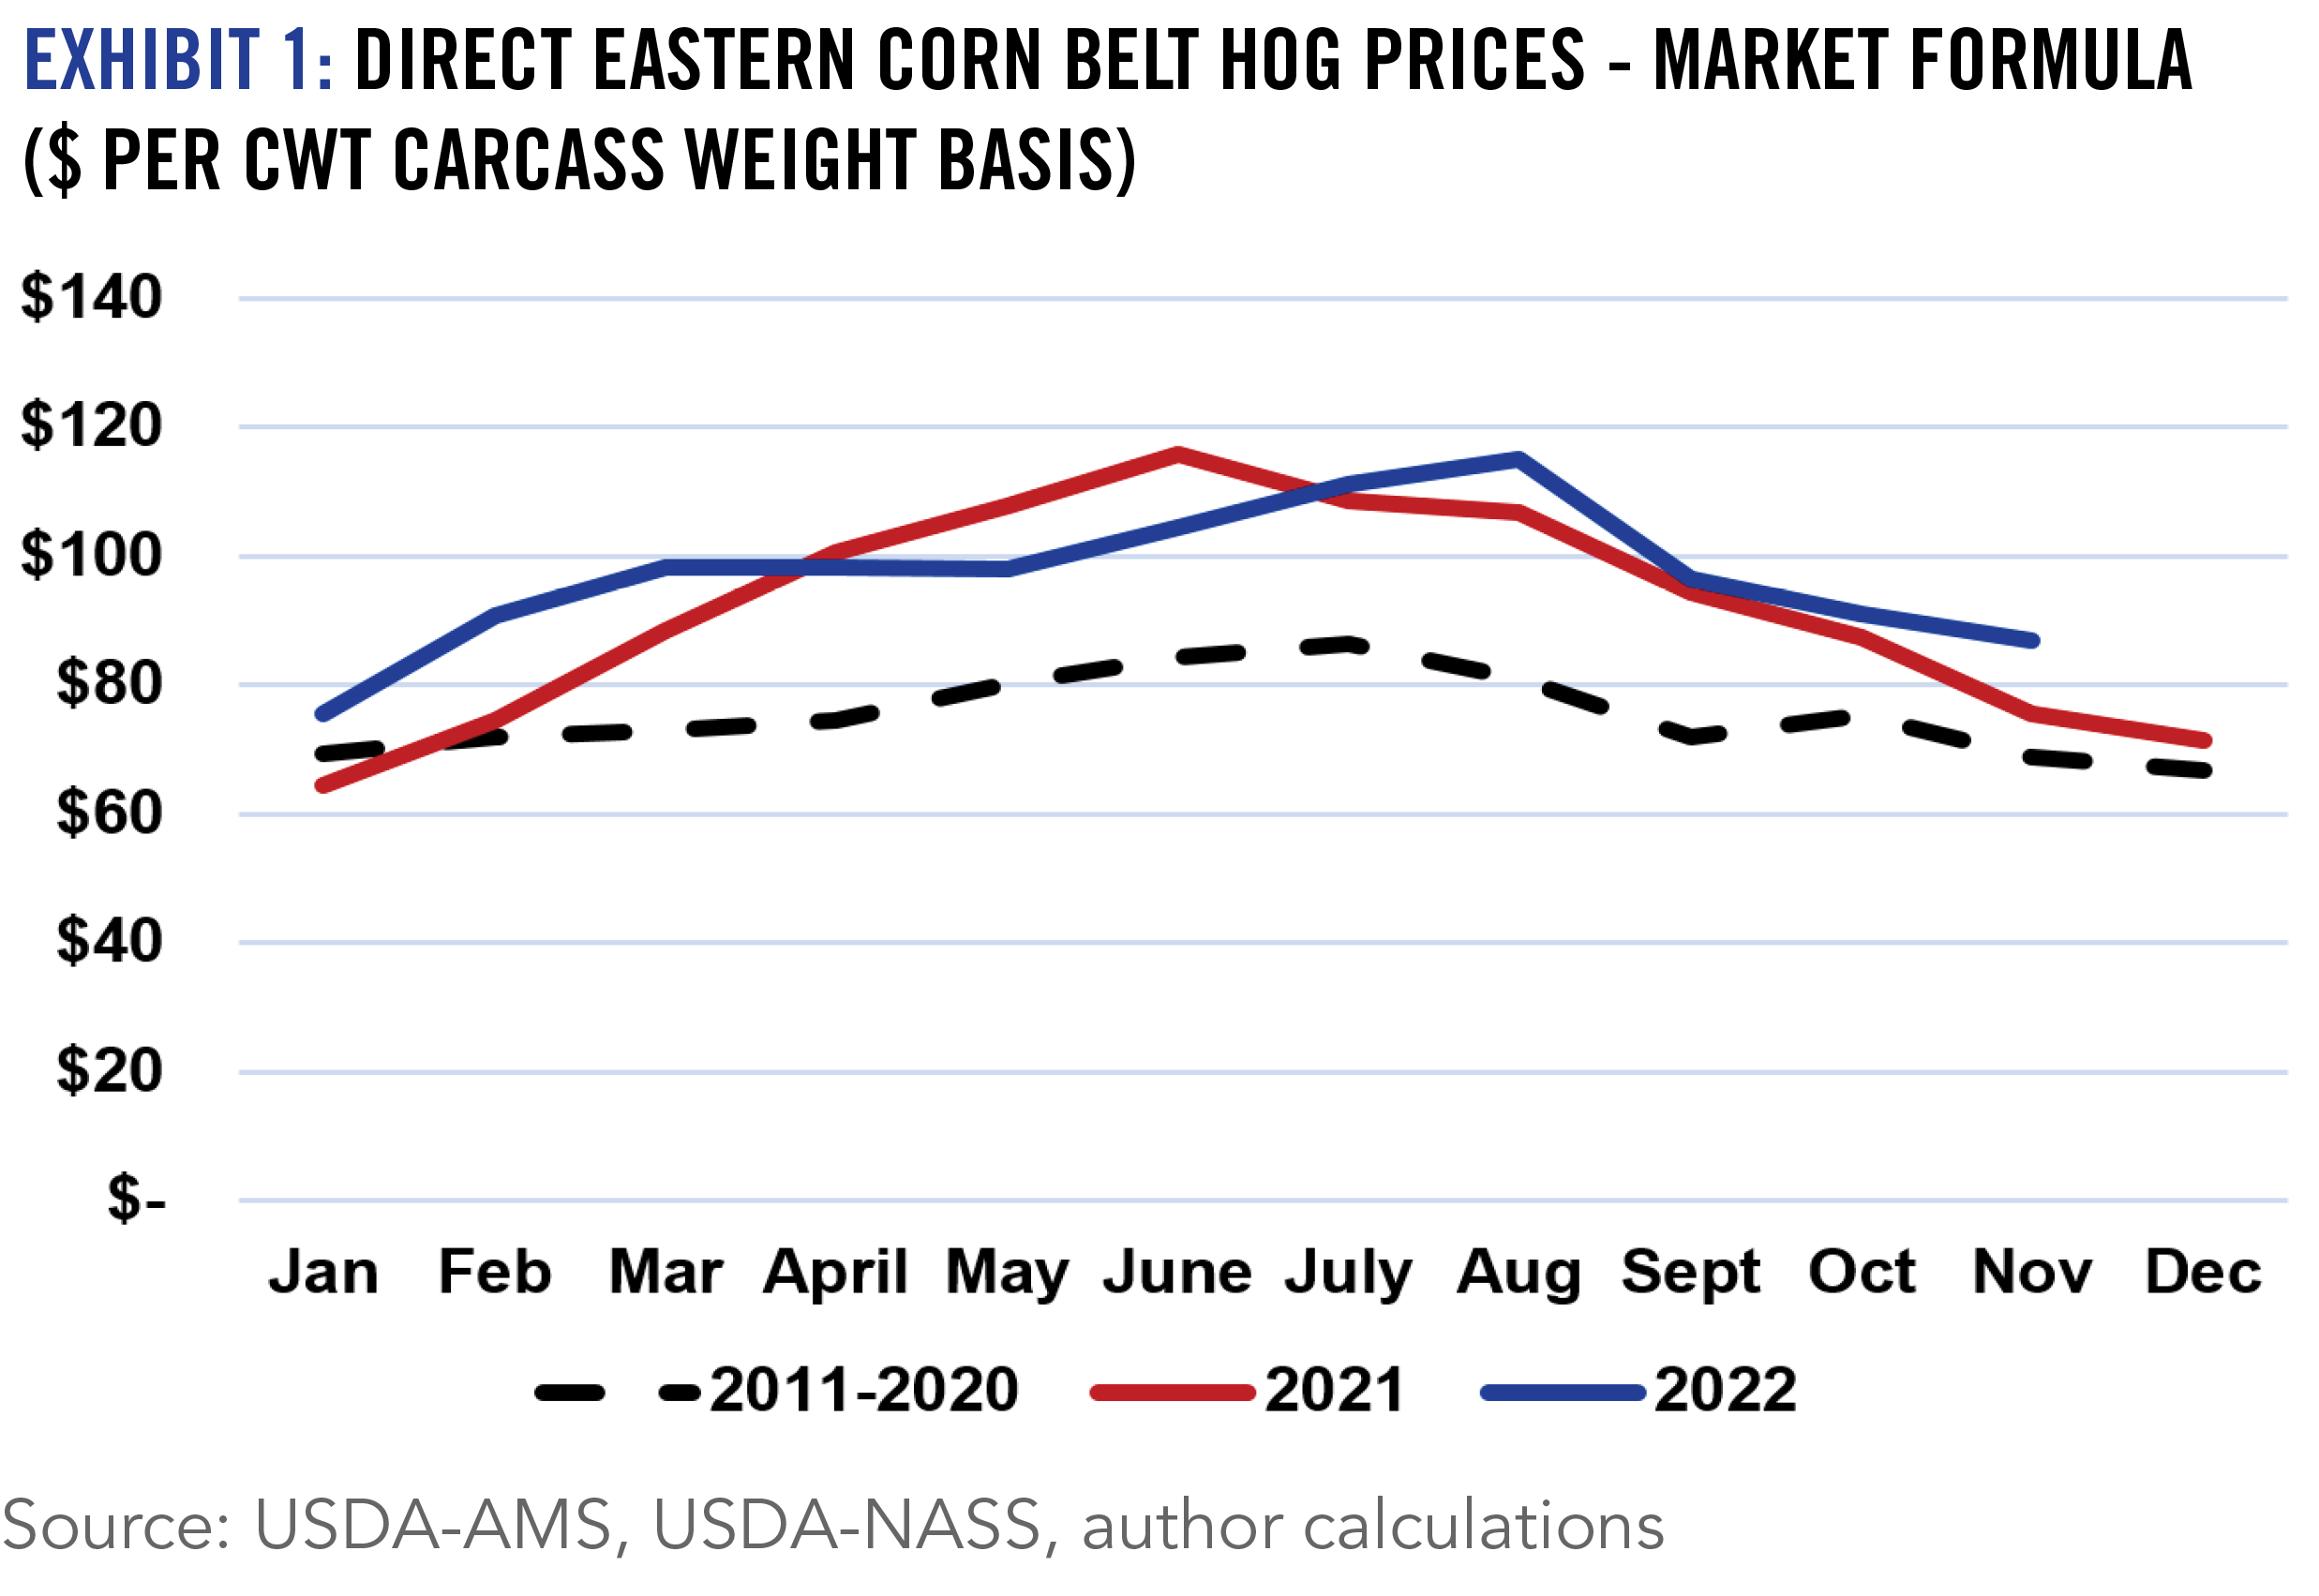
After a brutal 2023, farrow-to-finish margins showed some improvement in 2024 as hog prices increased and lower feed prices persisted. Exports have continued to be a bright spot and are on track to be up by more than 4% from the strong levels seen last year. US pork production increased by 2% during 2024 but was driven by productivity gains; breeding hog inventory has been dropping since 2020. Much like 2023, Kentucky came into 2024 with steady breeding hog inventory, but an increase in market hog numbers. Through November 2024 Eastern Cornbelt Hog prices were roughly 6% higher than 2023.
2025 Outlook
Productivity gains in the hog sector continue to impress and are likely to result in another pork production increase for 2025. Despite higher production levels, a year-over-year hog price increase is very possible next year and should be combined with continued lower feed prices. As a result, Kentucky’s independent operations should see continued margin improvement in 2025 and the same factors should lead to continued opportunities for contract integrated operations.
Direct Eastern Corn Belt Hog Prices, Market Formula ($ per cwt carcass weight basis)
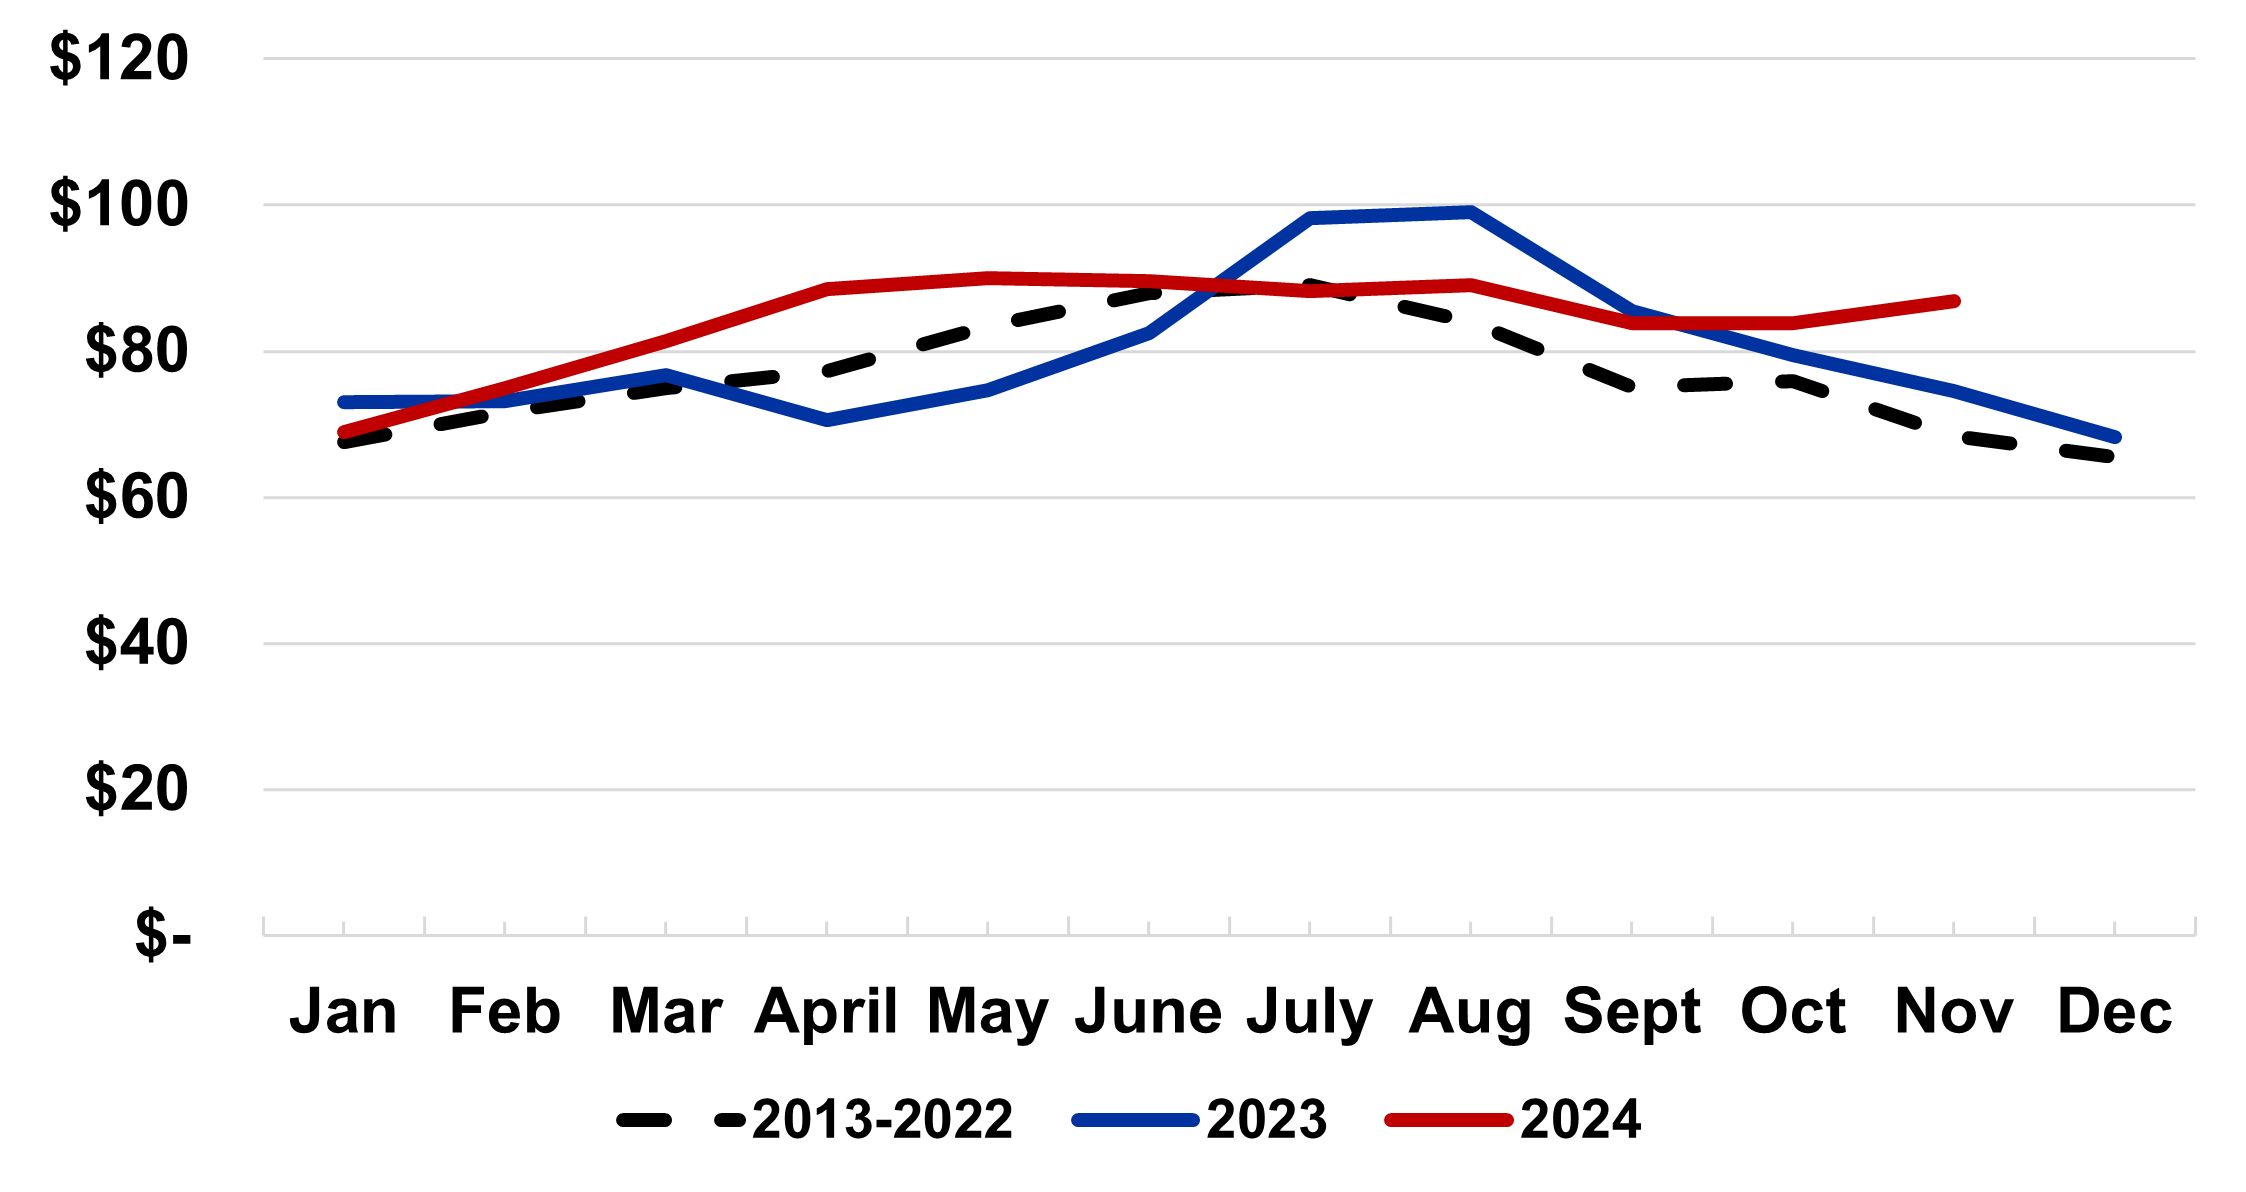
Source: USDA-AMS, USDA-NASS, author calculations
2024 Overview
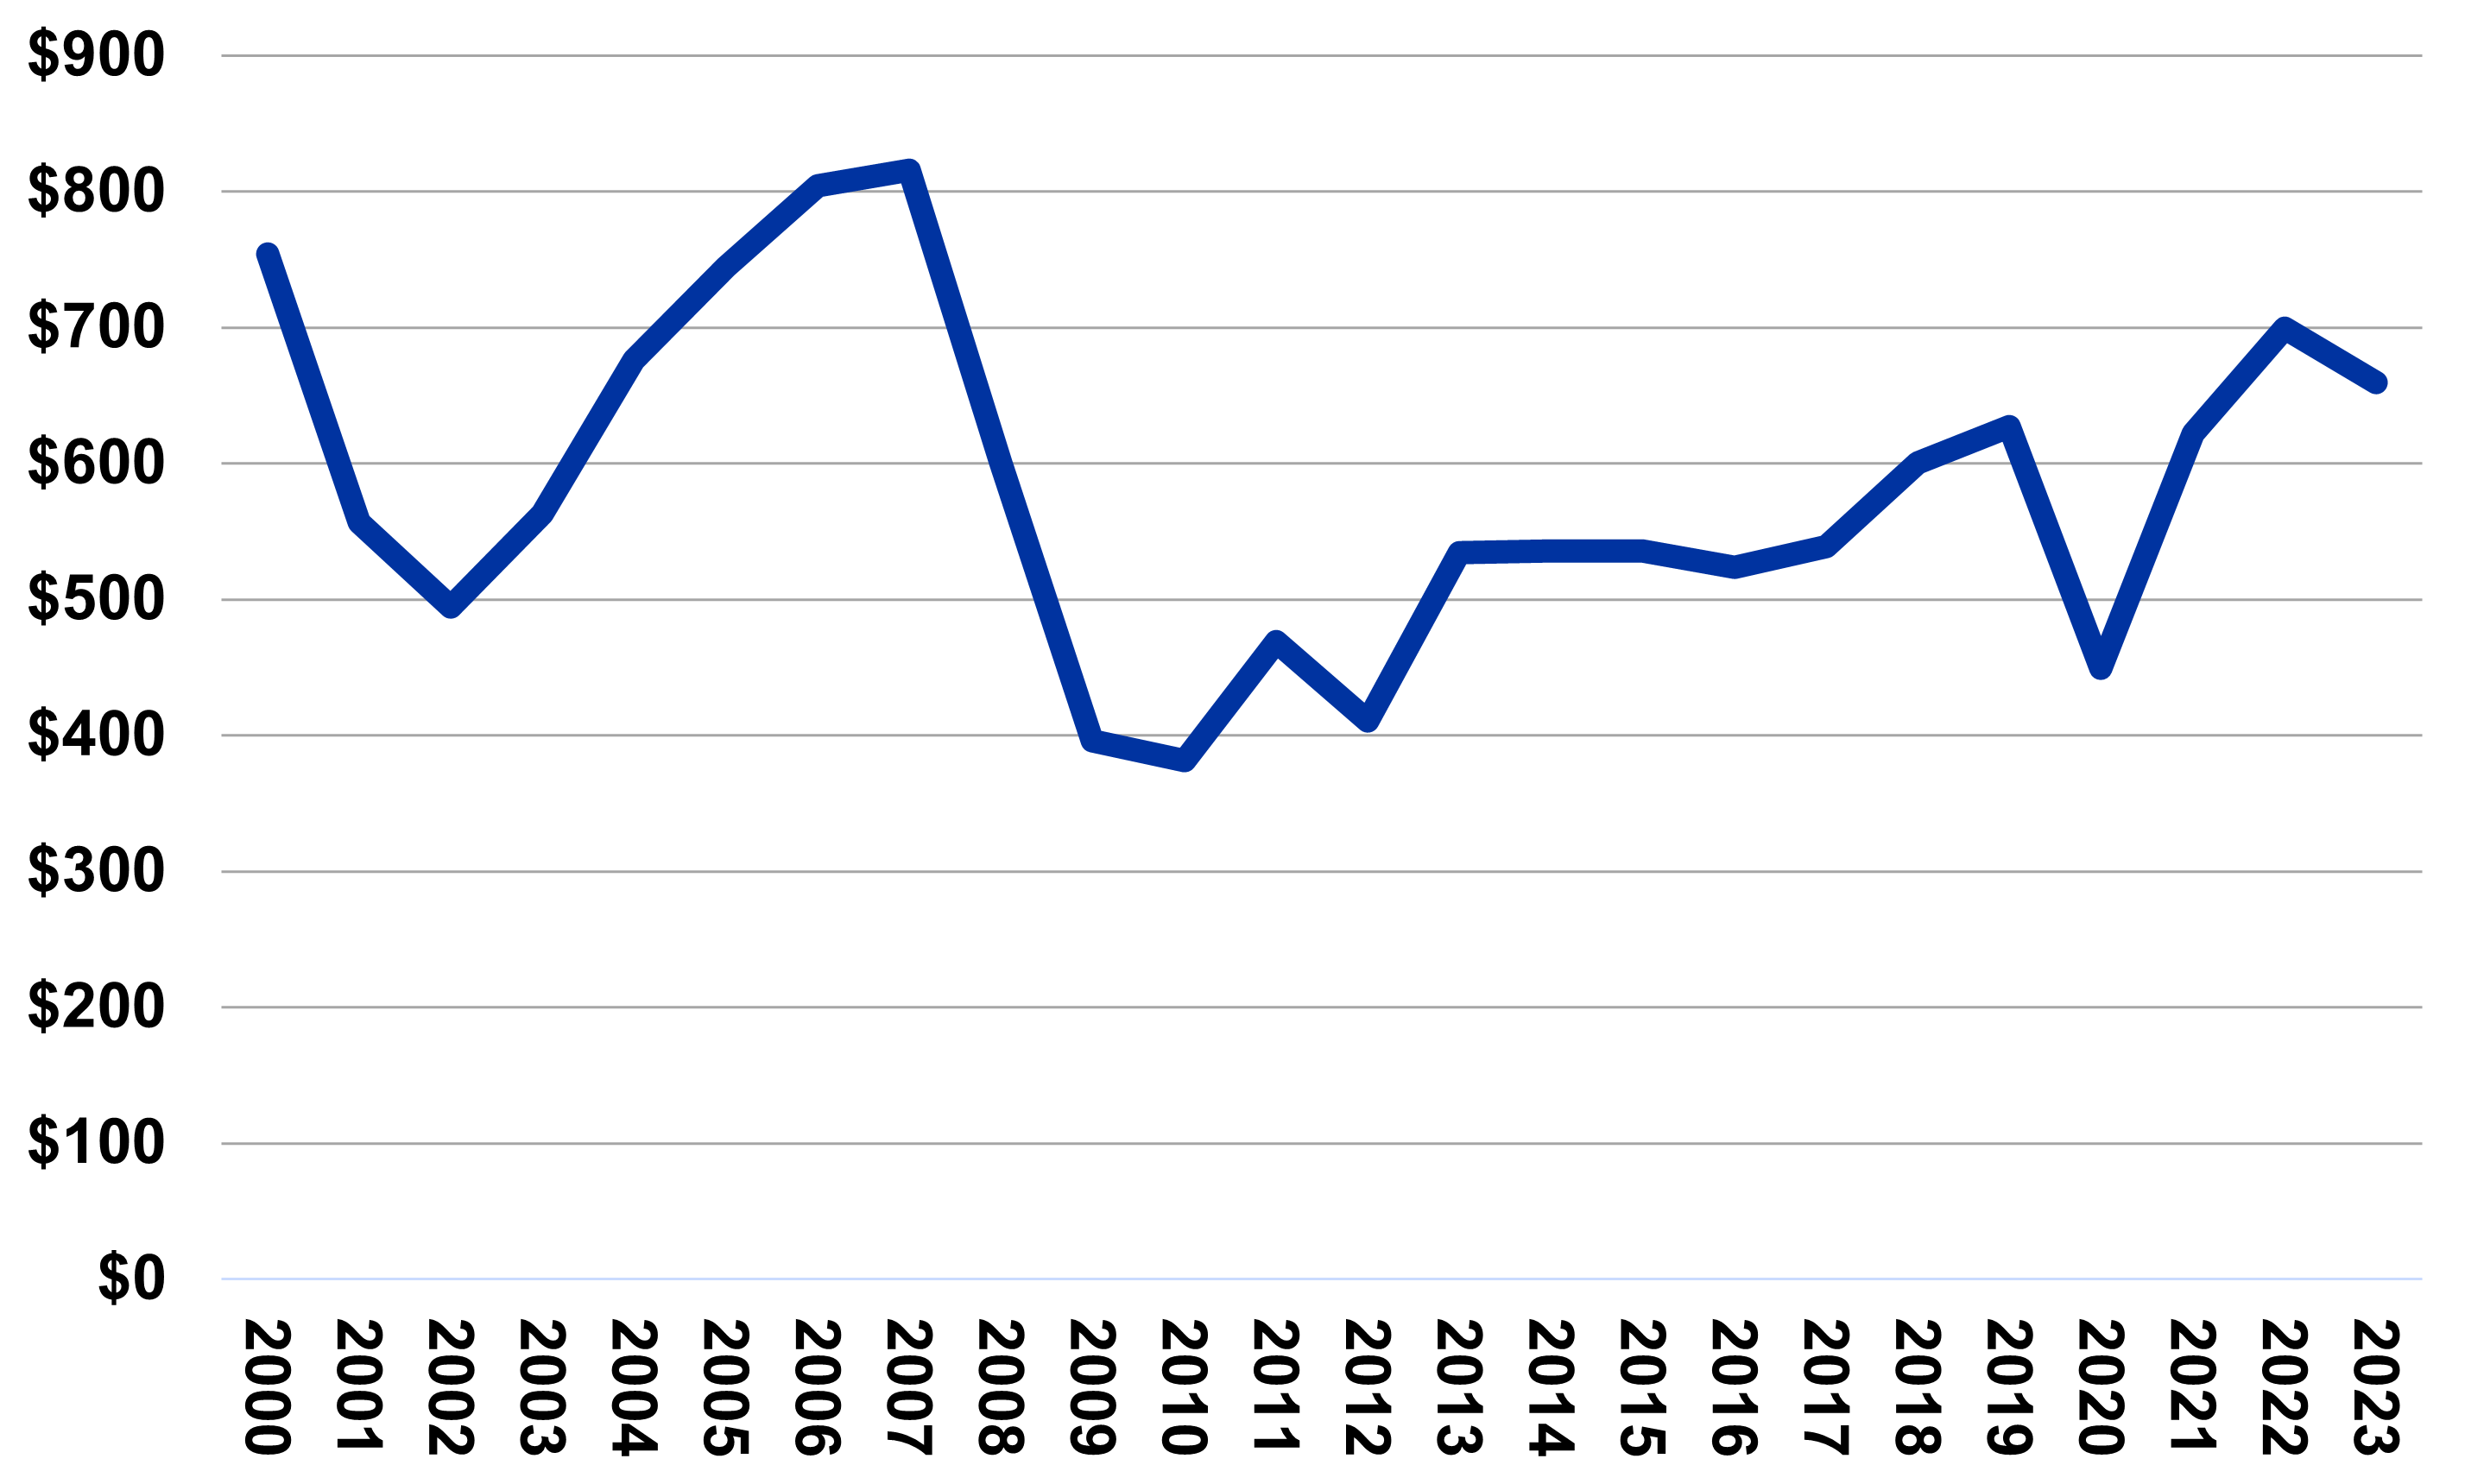
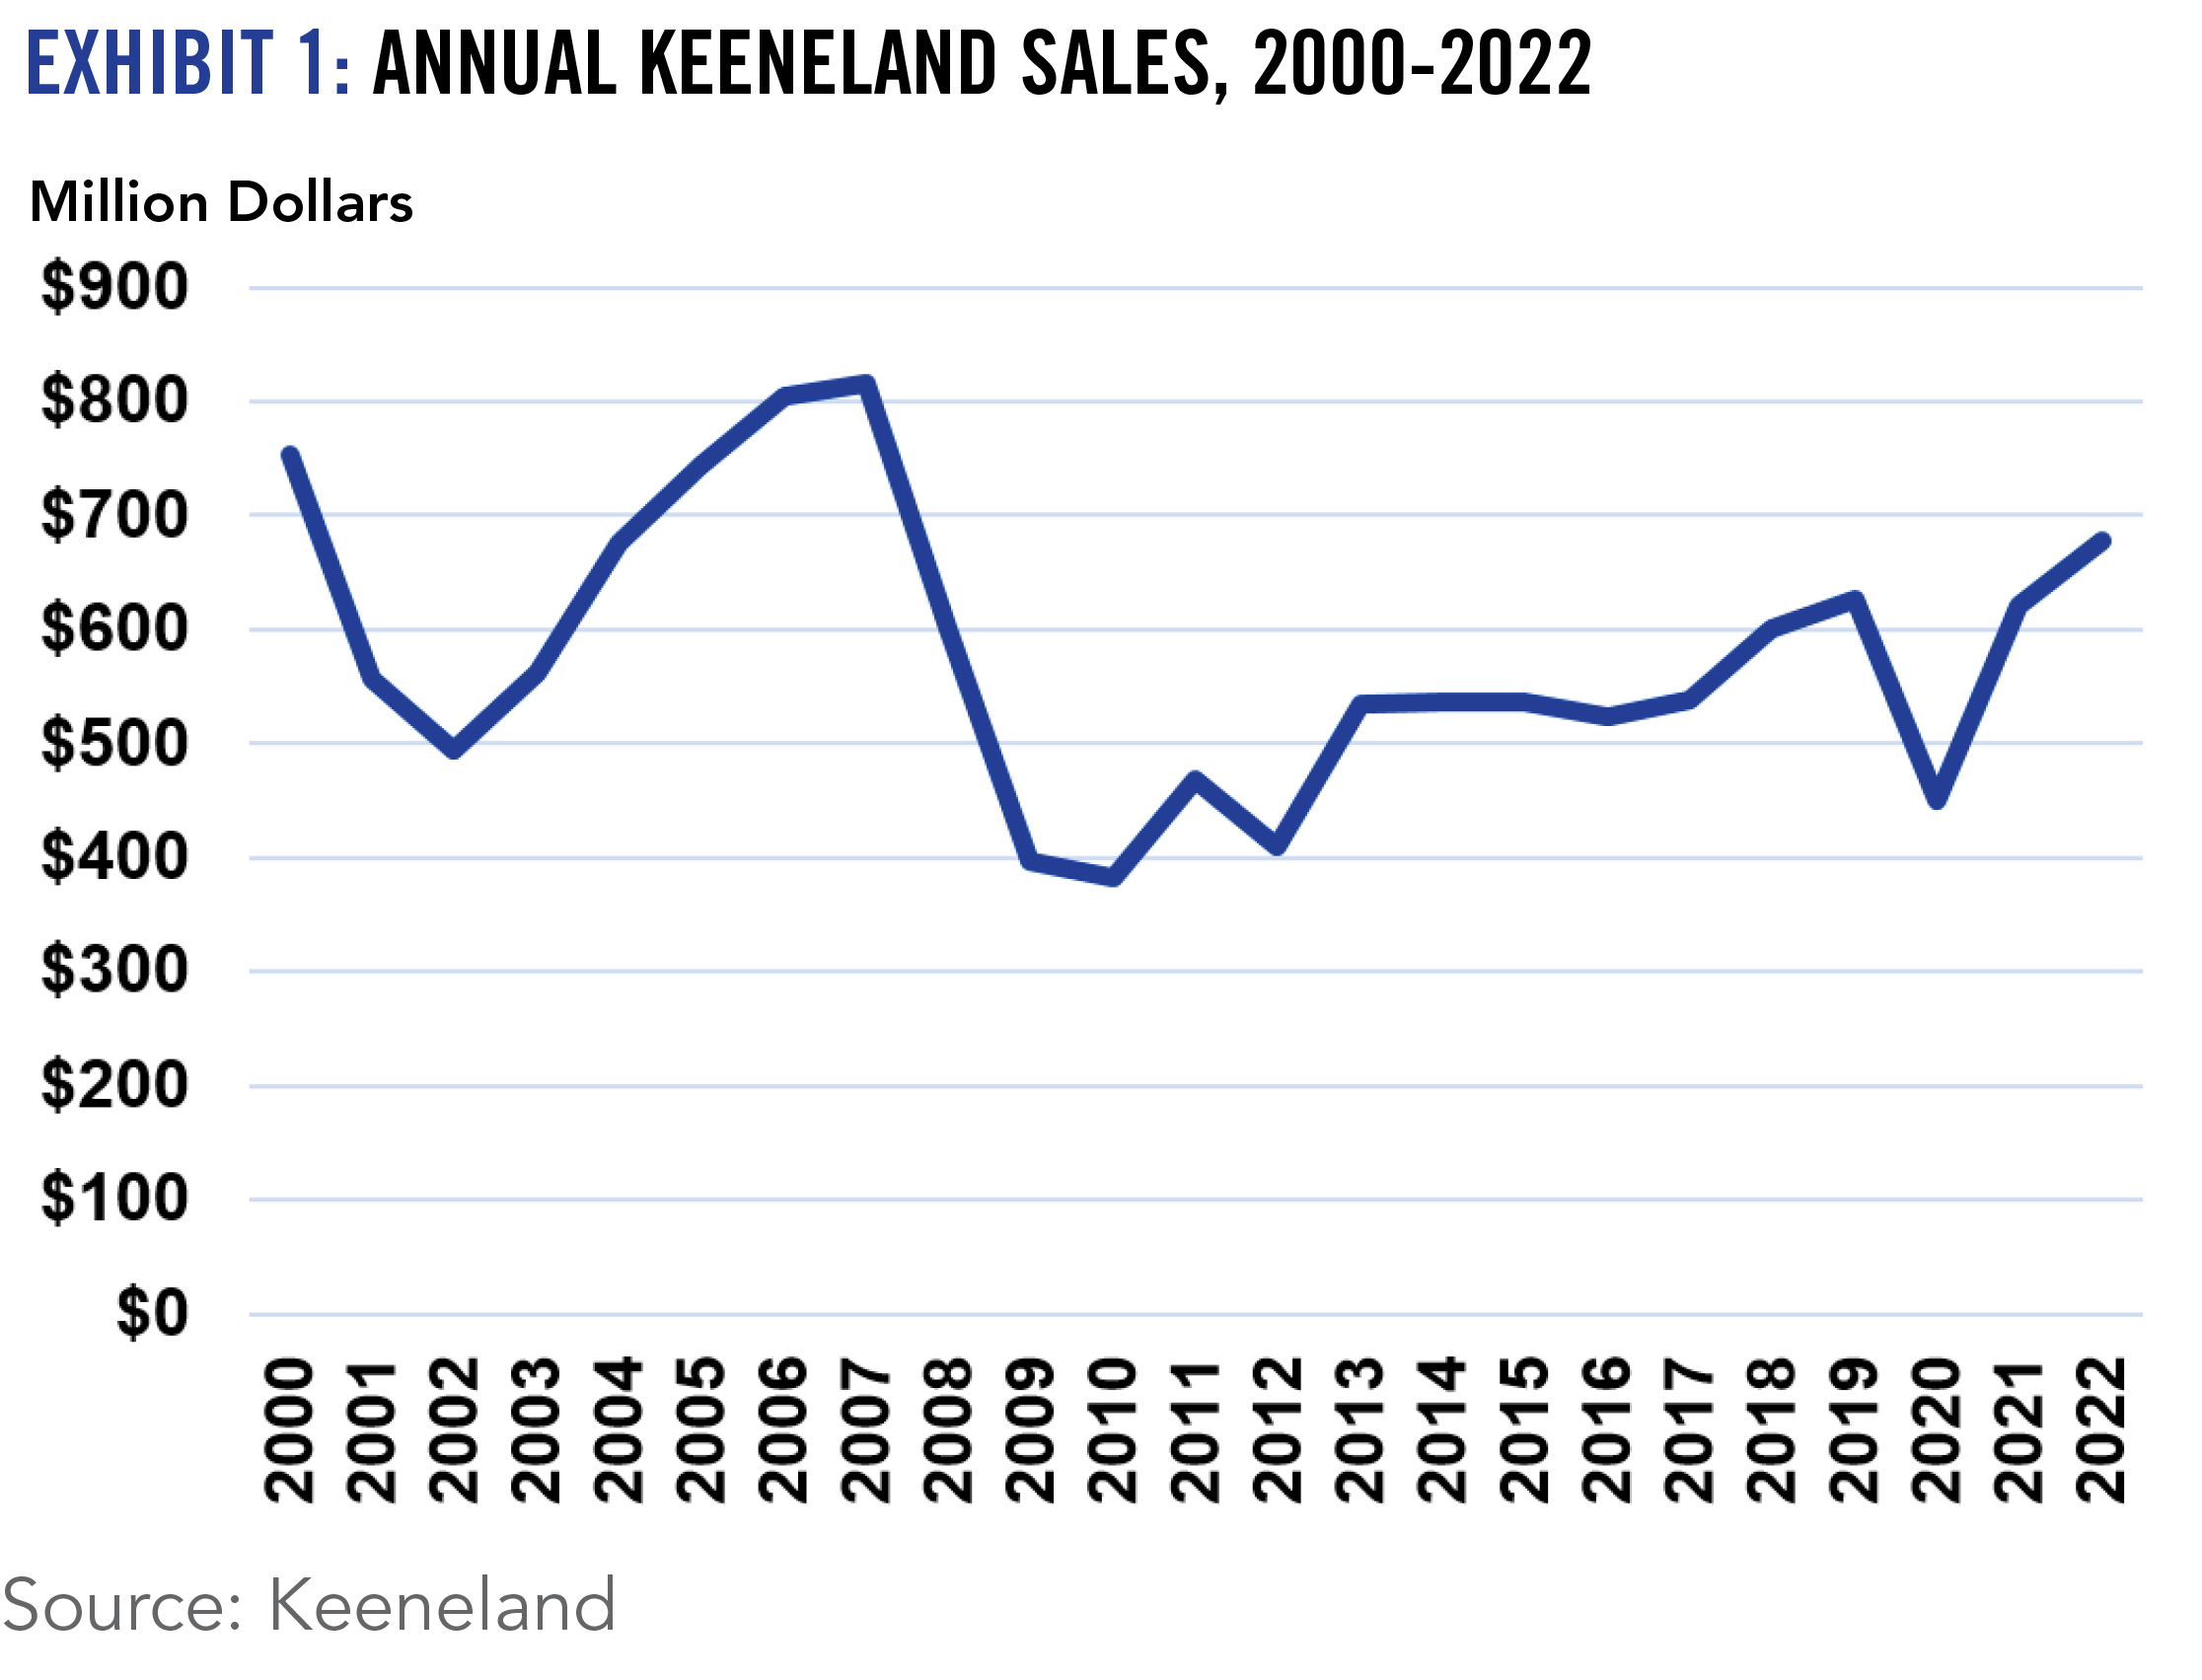
After a 6% decrease in 2023, Keeneland sales revenue increased by more than 3% during 2024. This occurred in spite of a 6% decrease in the number of horses sold through the venue. While the $682 million total was less than 2022, it was the second highest annual total since 2007. Consistent with the national trend, a 2% decrease was seen in the number of mares bred in Kentucky (The Jockey Club). This decrease in mares bred will partially offset the stronger sales and moderate the impact on equine cash receipts for the state.
2025 Outlook
Stronger sales in 2024 provide optimism for next year, as does continued gaming revenues and the associated impact on purses. Higher average sale values in 2024 may also have impacts on stud fees in 2025, which represent a significant share of equine receipts for the state. Inflationary pressures will continue to weigh on equine markets and non-racing horses may be disproportionately impacted. Still, the momentum from a relatively strong sales year, combined with the potential for stability in stud fees would suggest another increase in equine receipts is very possible
Annual Keeneland Sales: 2000 to 2024 (millions of dollars)
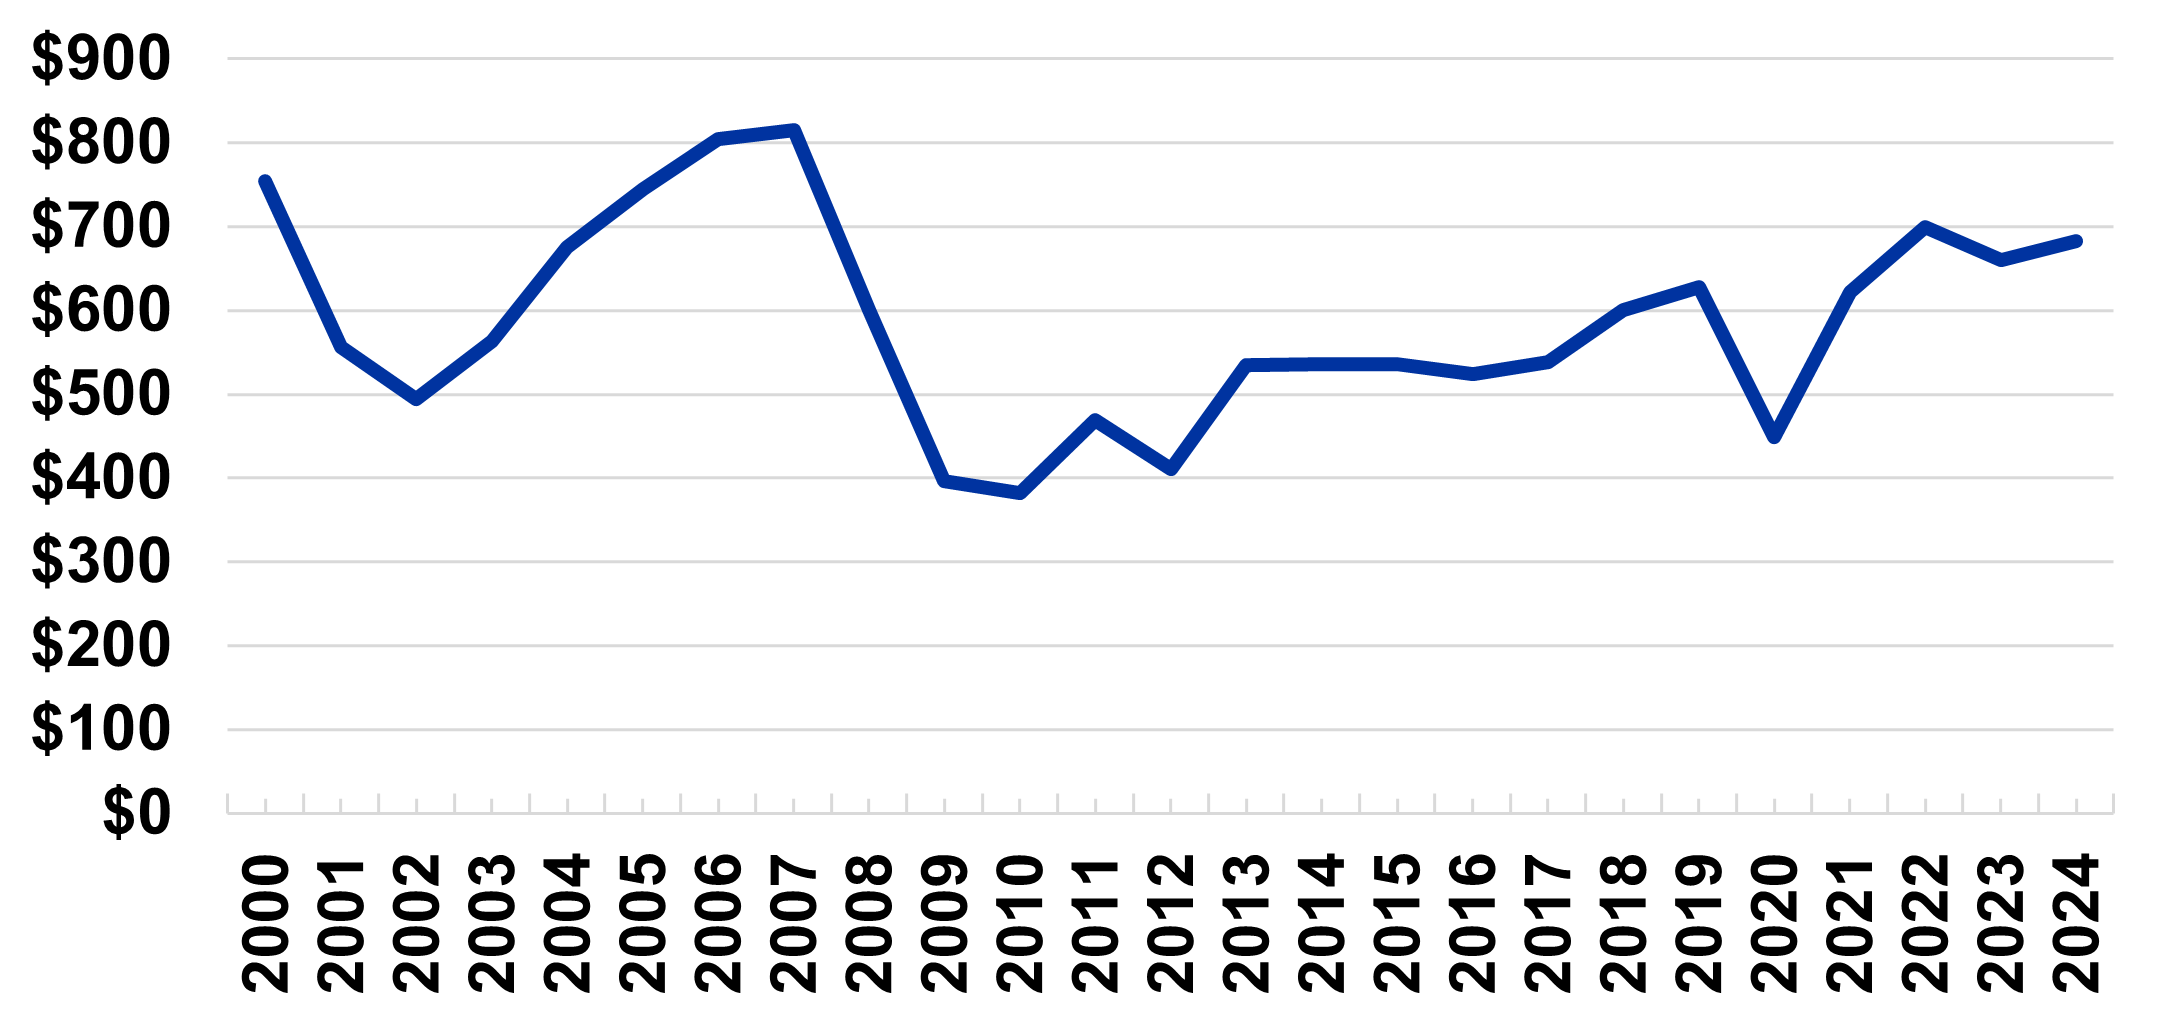
Source: Keeneland website
2024 Overview
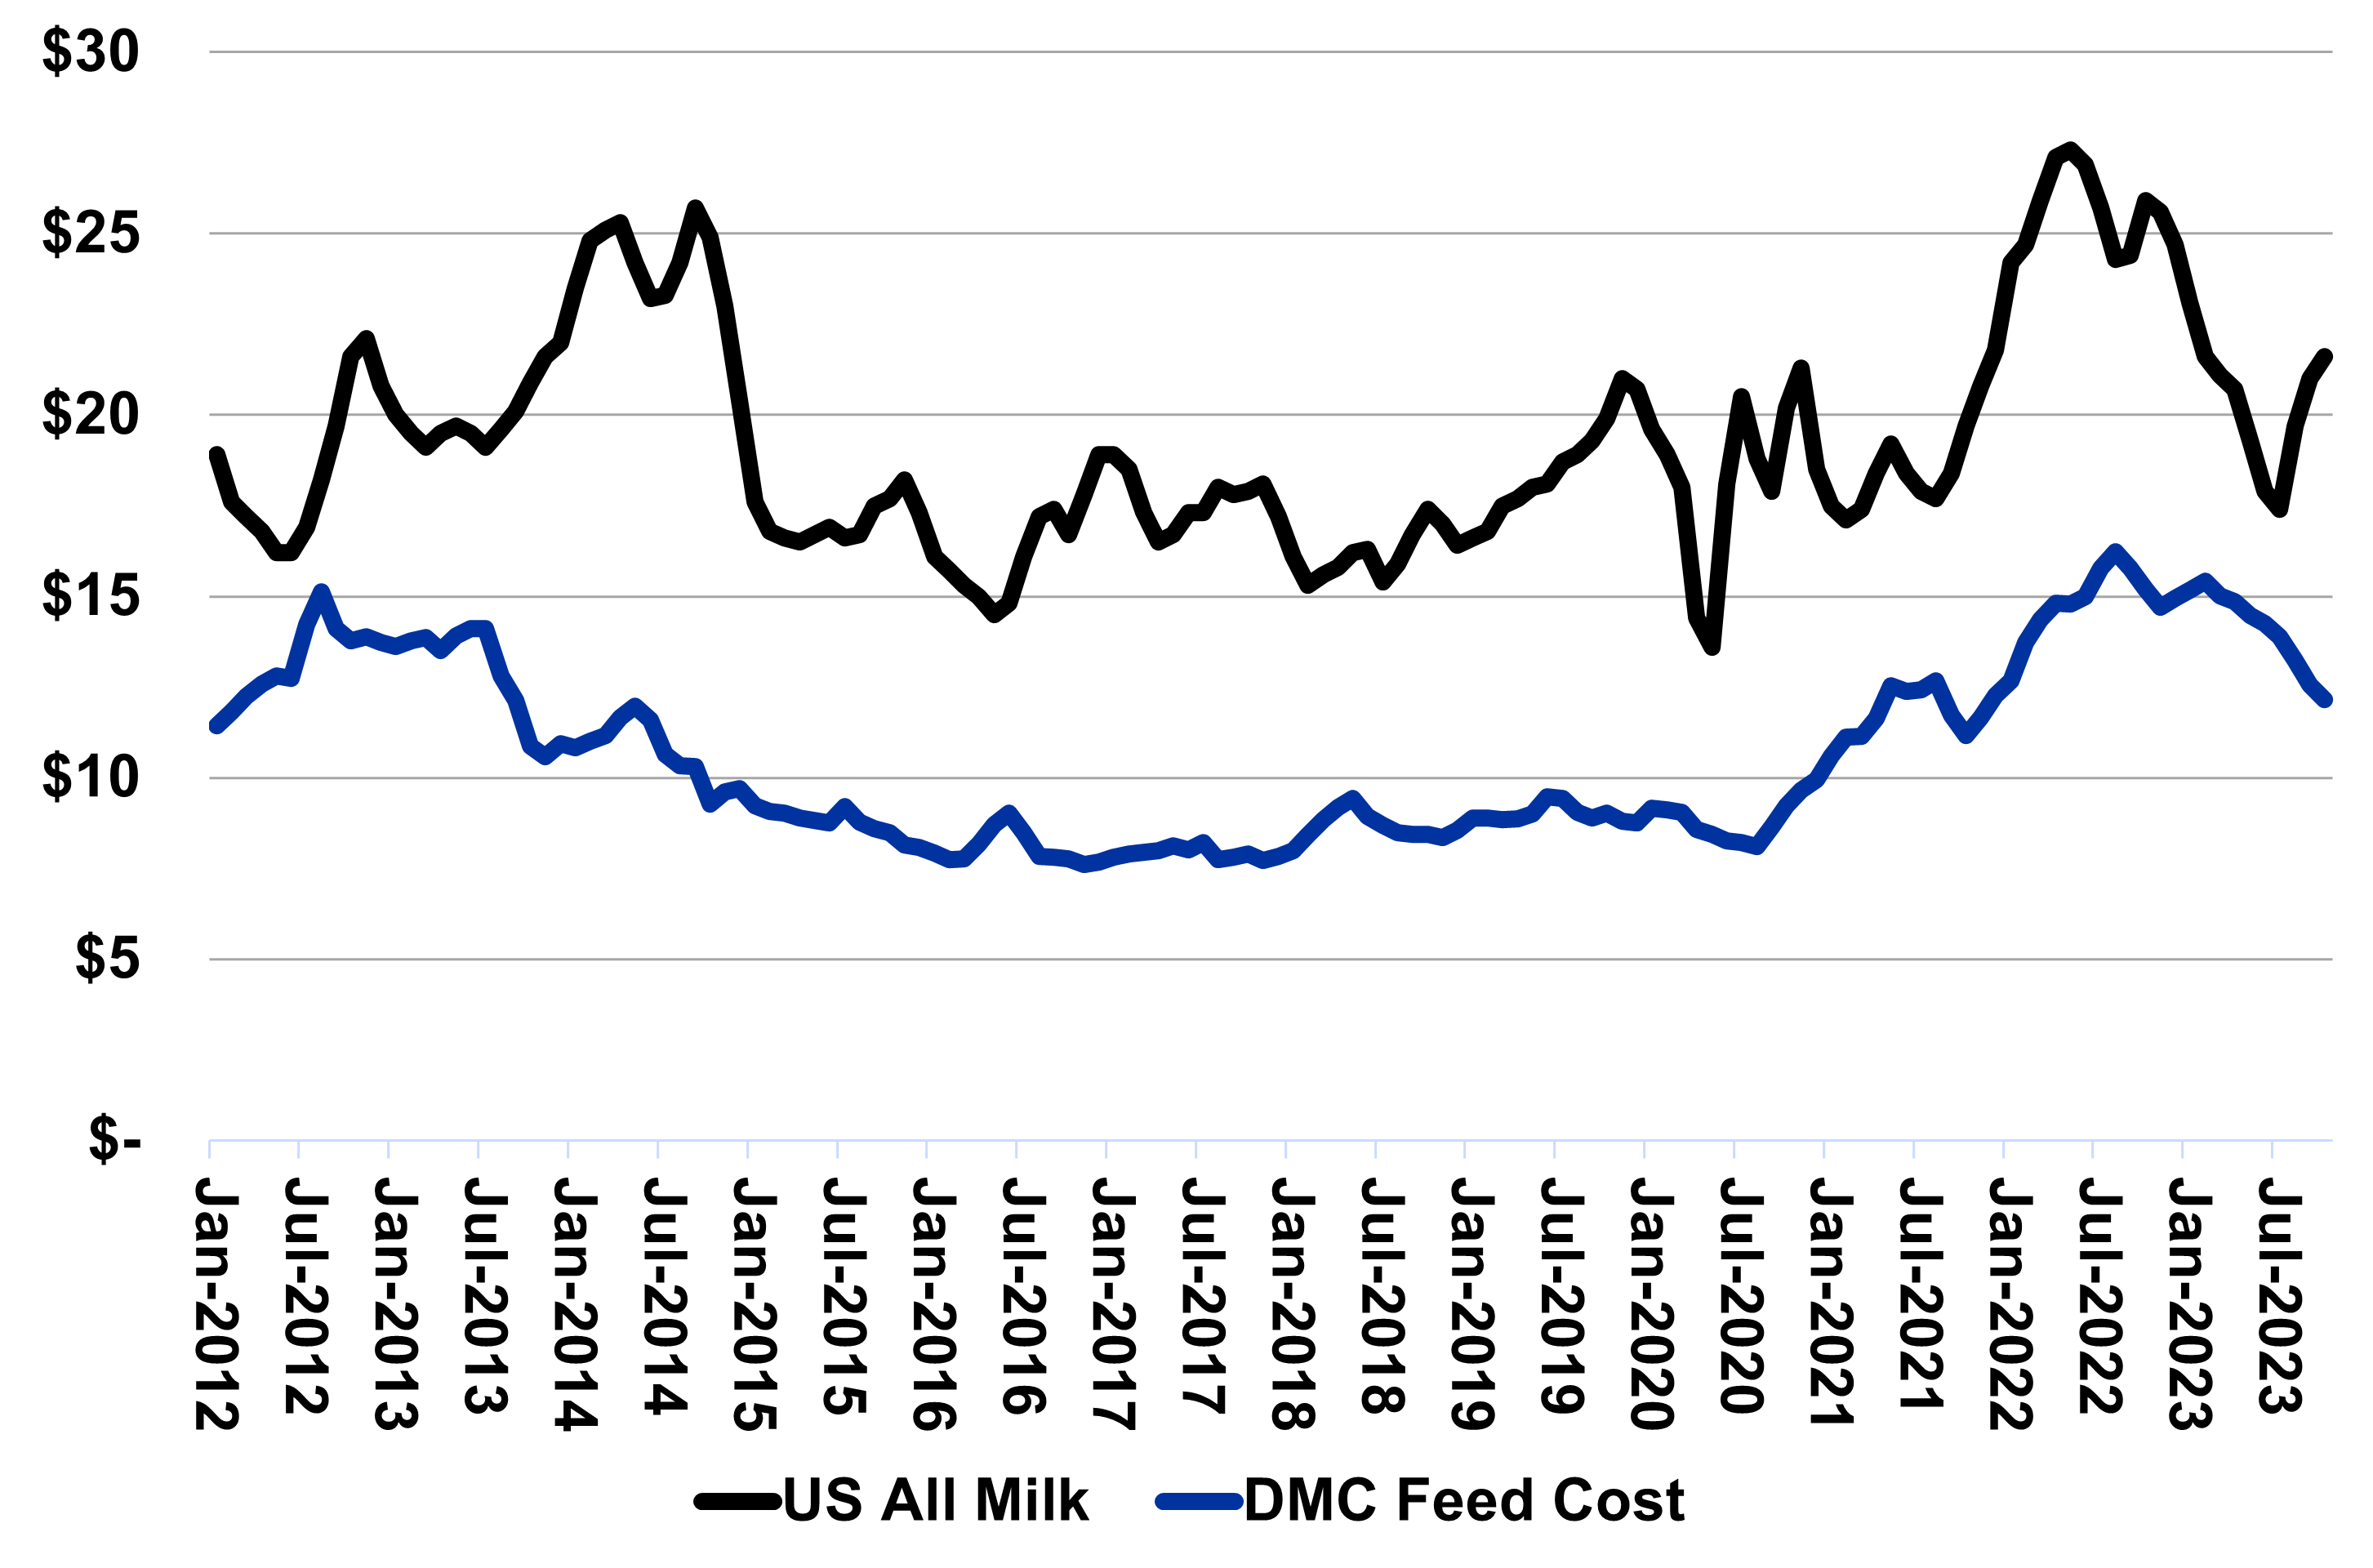
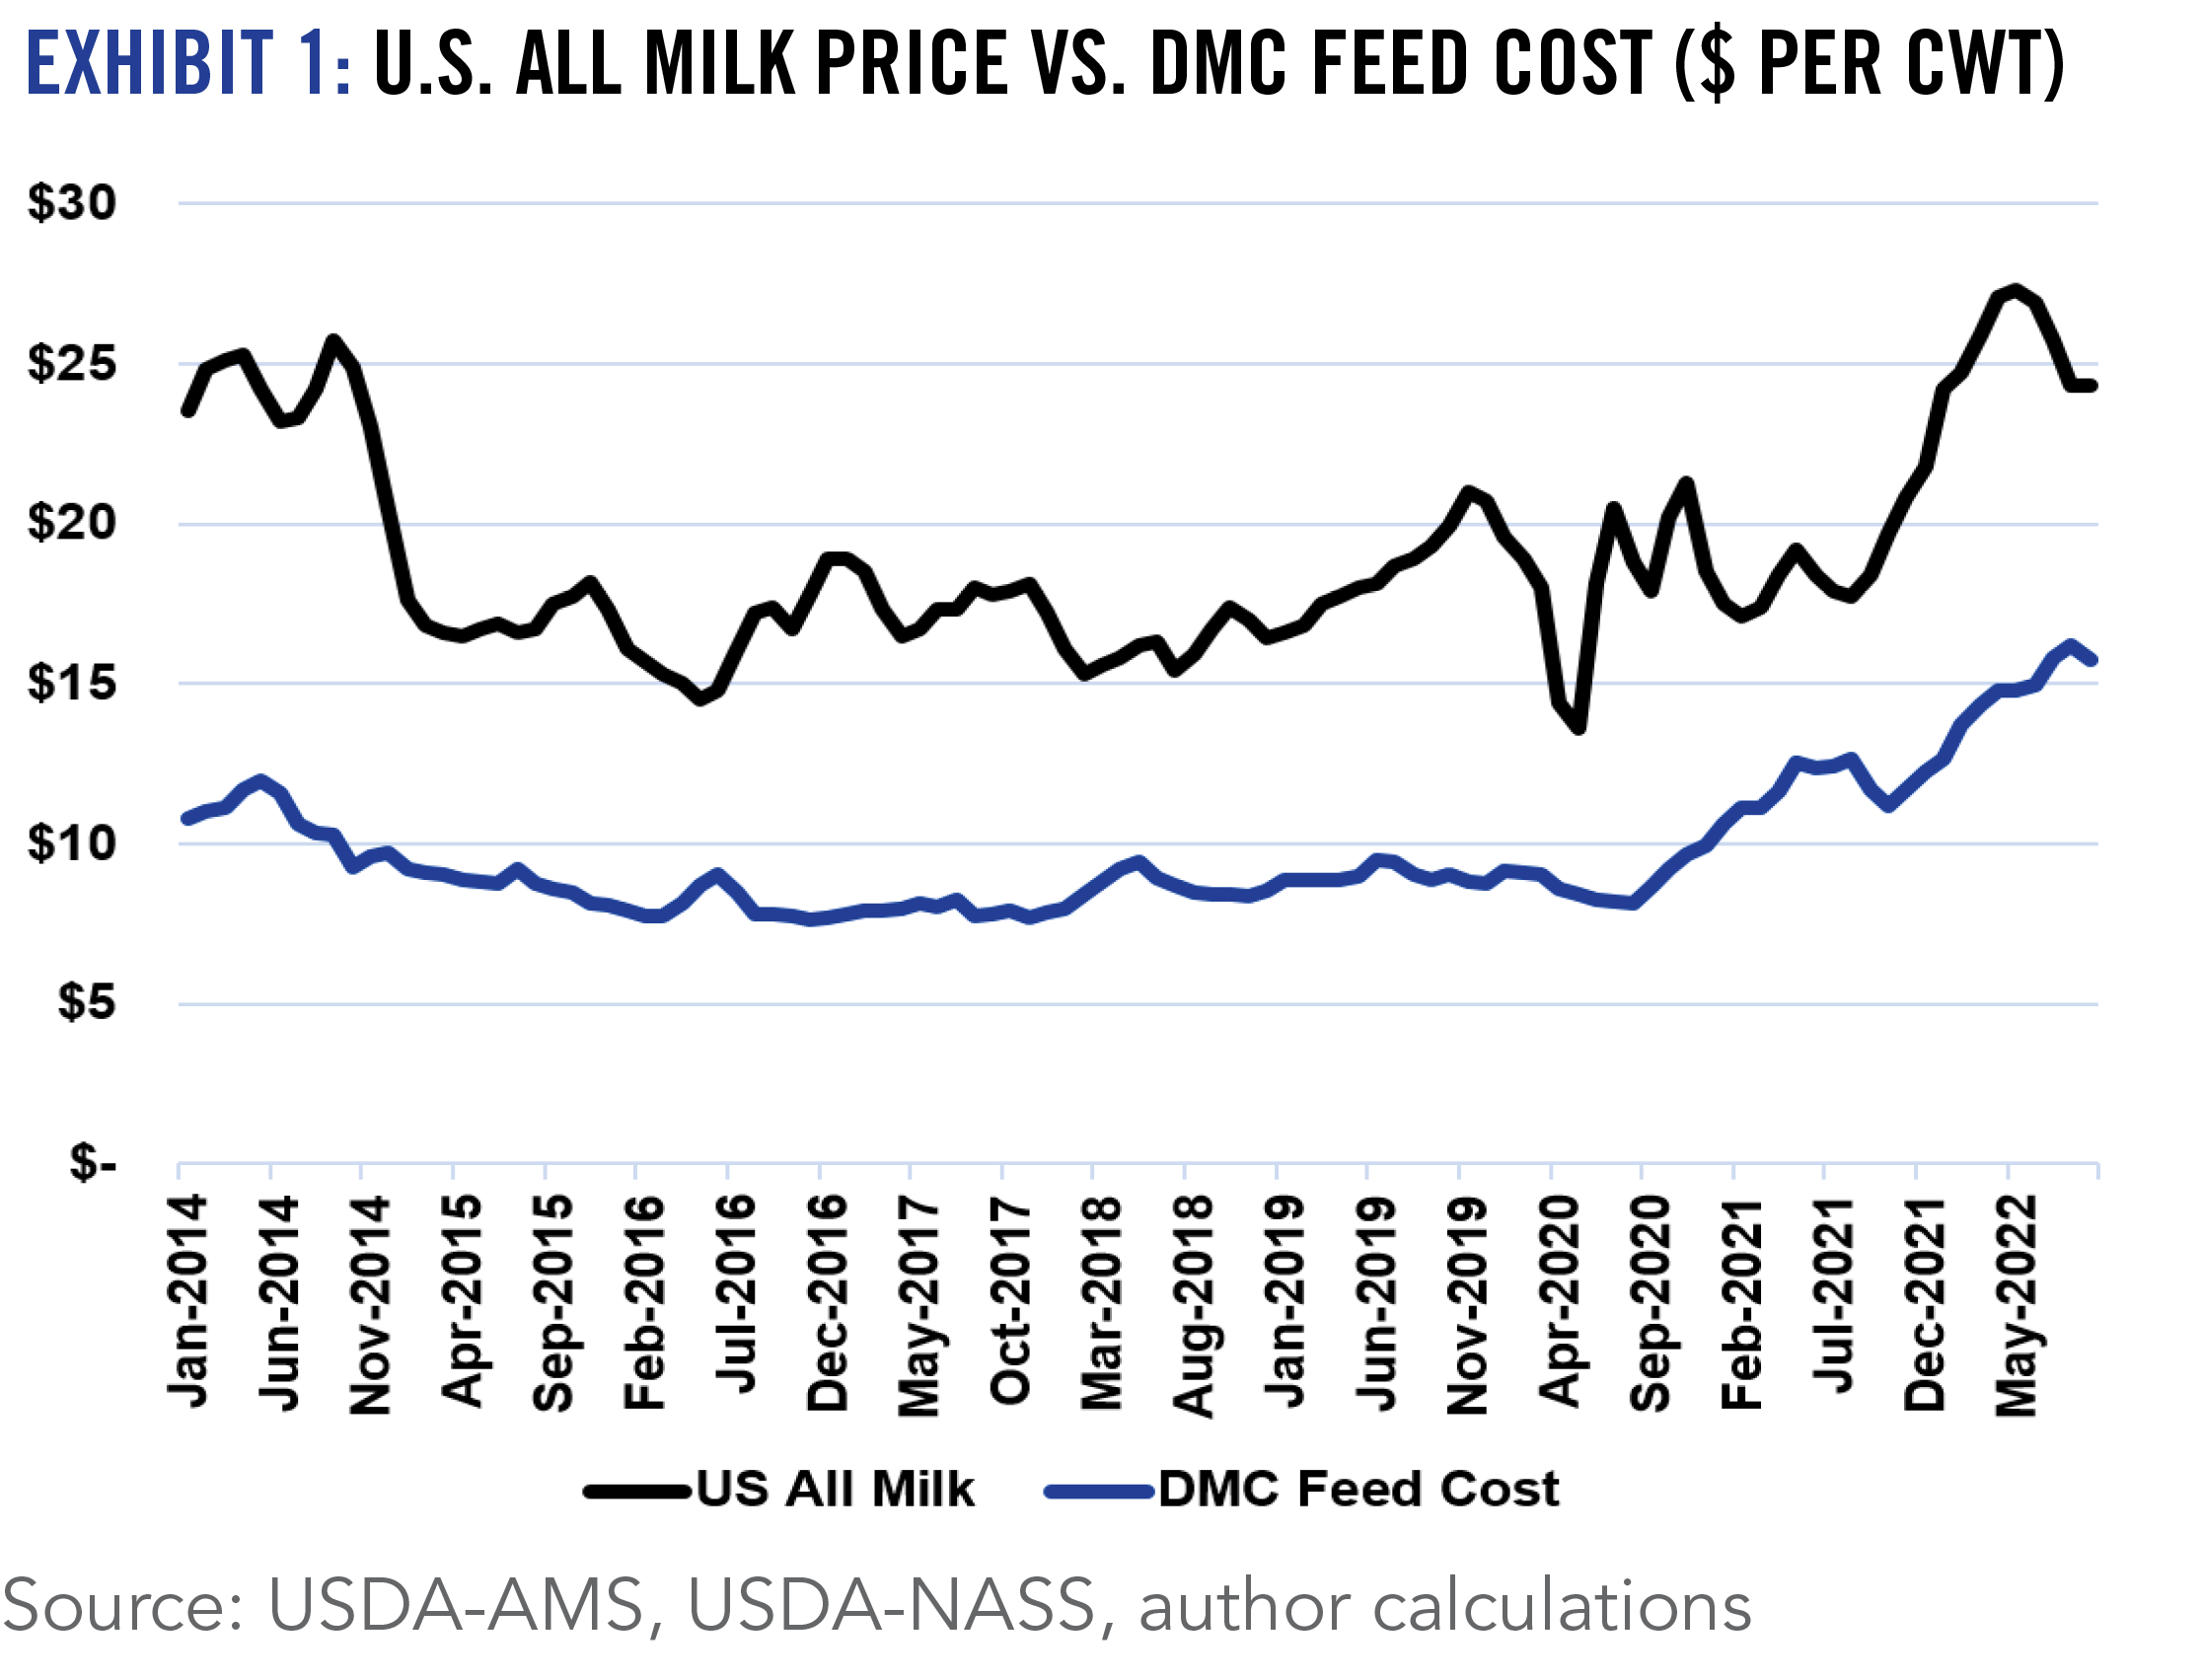
While 2023 will not be remembered fondly by dairy producers, 2024 will be considered an impressive turnaround. Dairy cow numbers were lower for much of the year and milk production was down slightly. Most dairy product values have been higher and farm-level milk prices are on track to be about $2 per cwt higher than last year. Just an importantly, feed costs are sharply lower resulting in a major improvement in returns. The Dairy Margin Coverage (DMC) margin in fall of 2024 was as high as it had been since 2014.
2025 Outlook
It is very likely that the increases in dairy cow inventory being seen by fall of 2024 will continue into 2025. This, combined with some productivity gains, should result in a slight increase in milk production next year. While it seems unlikely that 2025 prices will be at levels as high as fall of 2024, it seems just as likely they remain higher than the first half of last year. In the current feed cost environment, this likely translates into a solid year for dairy producers. The beef-on-dairy trend will continue to gain momentum and continued consolidation seems probable. Despite the generally favorable outlook, dairy producers should continue to utilize the DMC program and other risk management tools available to them.
U.S. All Milk Price vs DMC Feed Cost ($ per cwt), January 2012 to September 2024
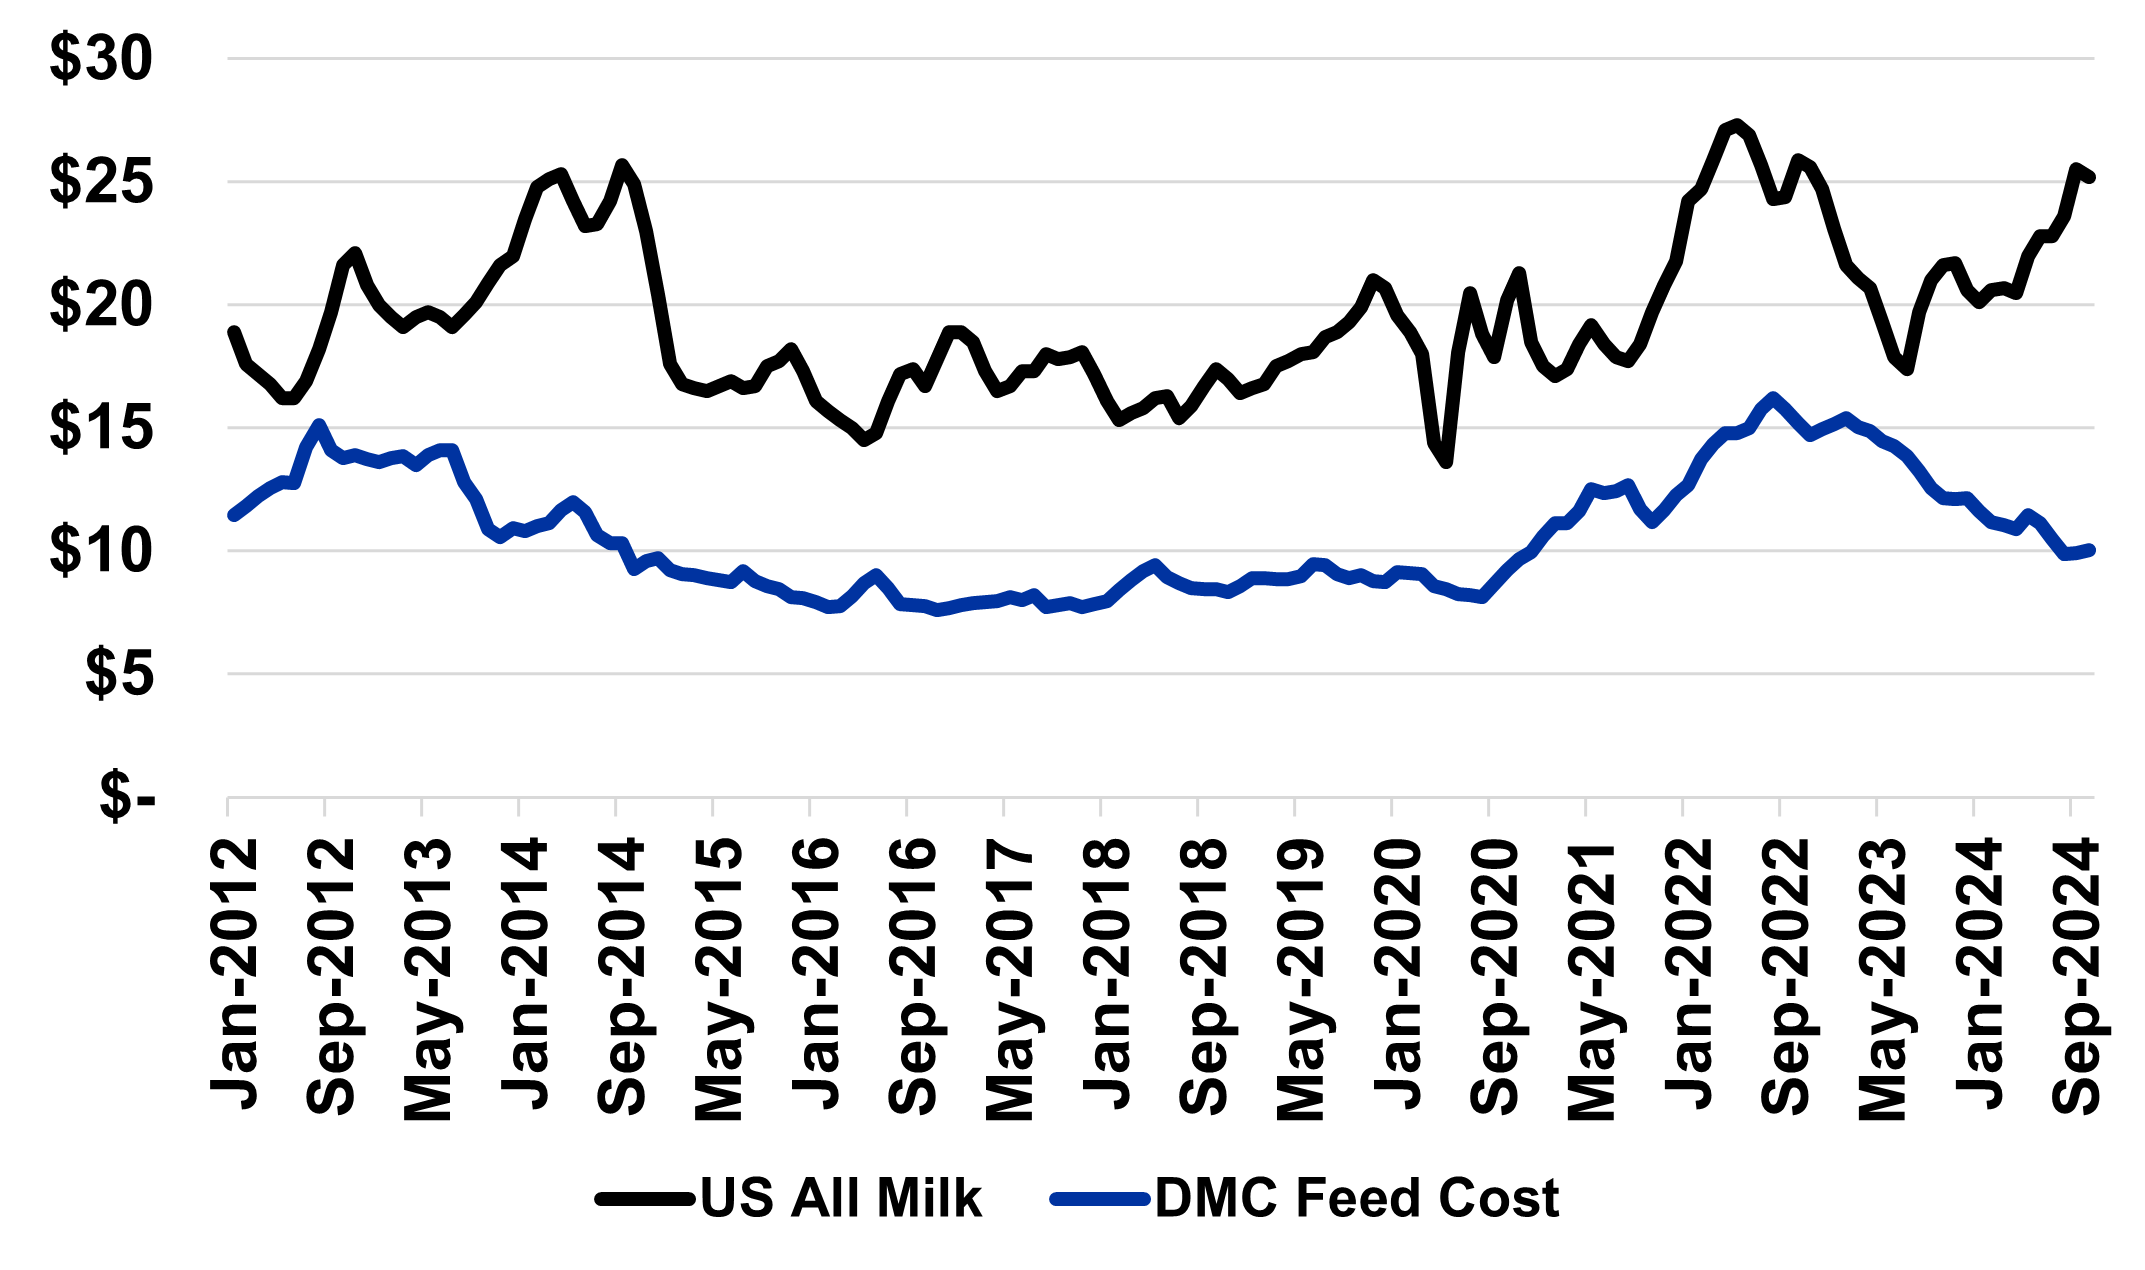
Source: USDA-AMS, USDA-NASS, author calculations
2024 Situation
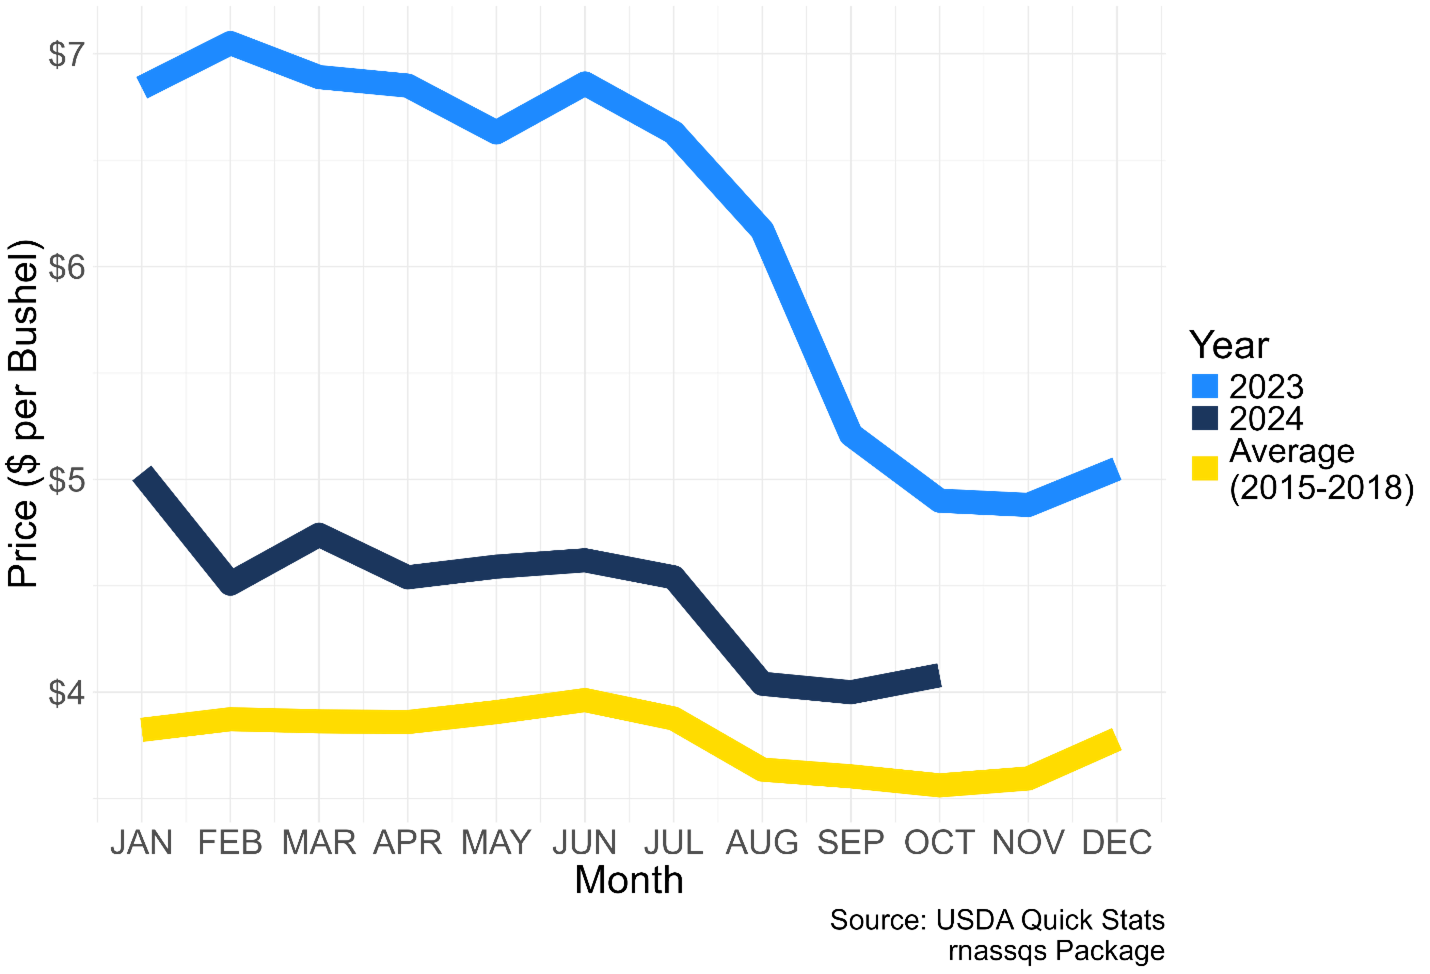
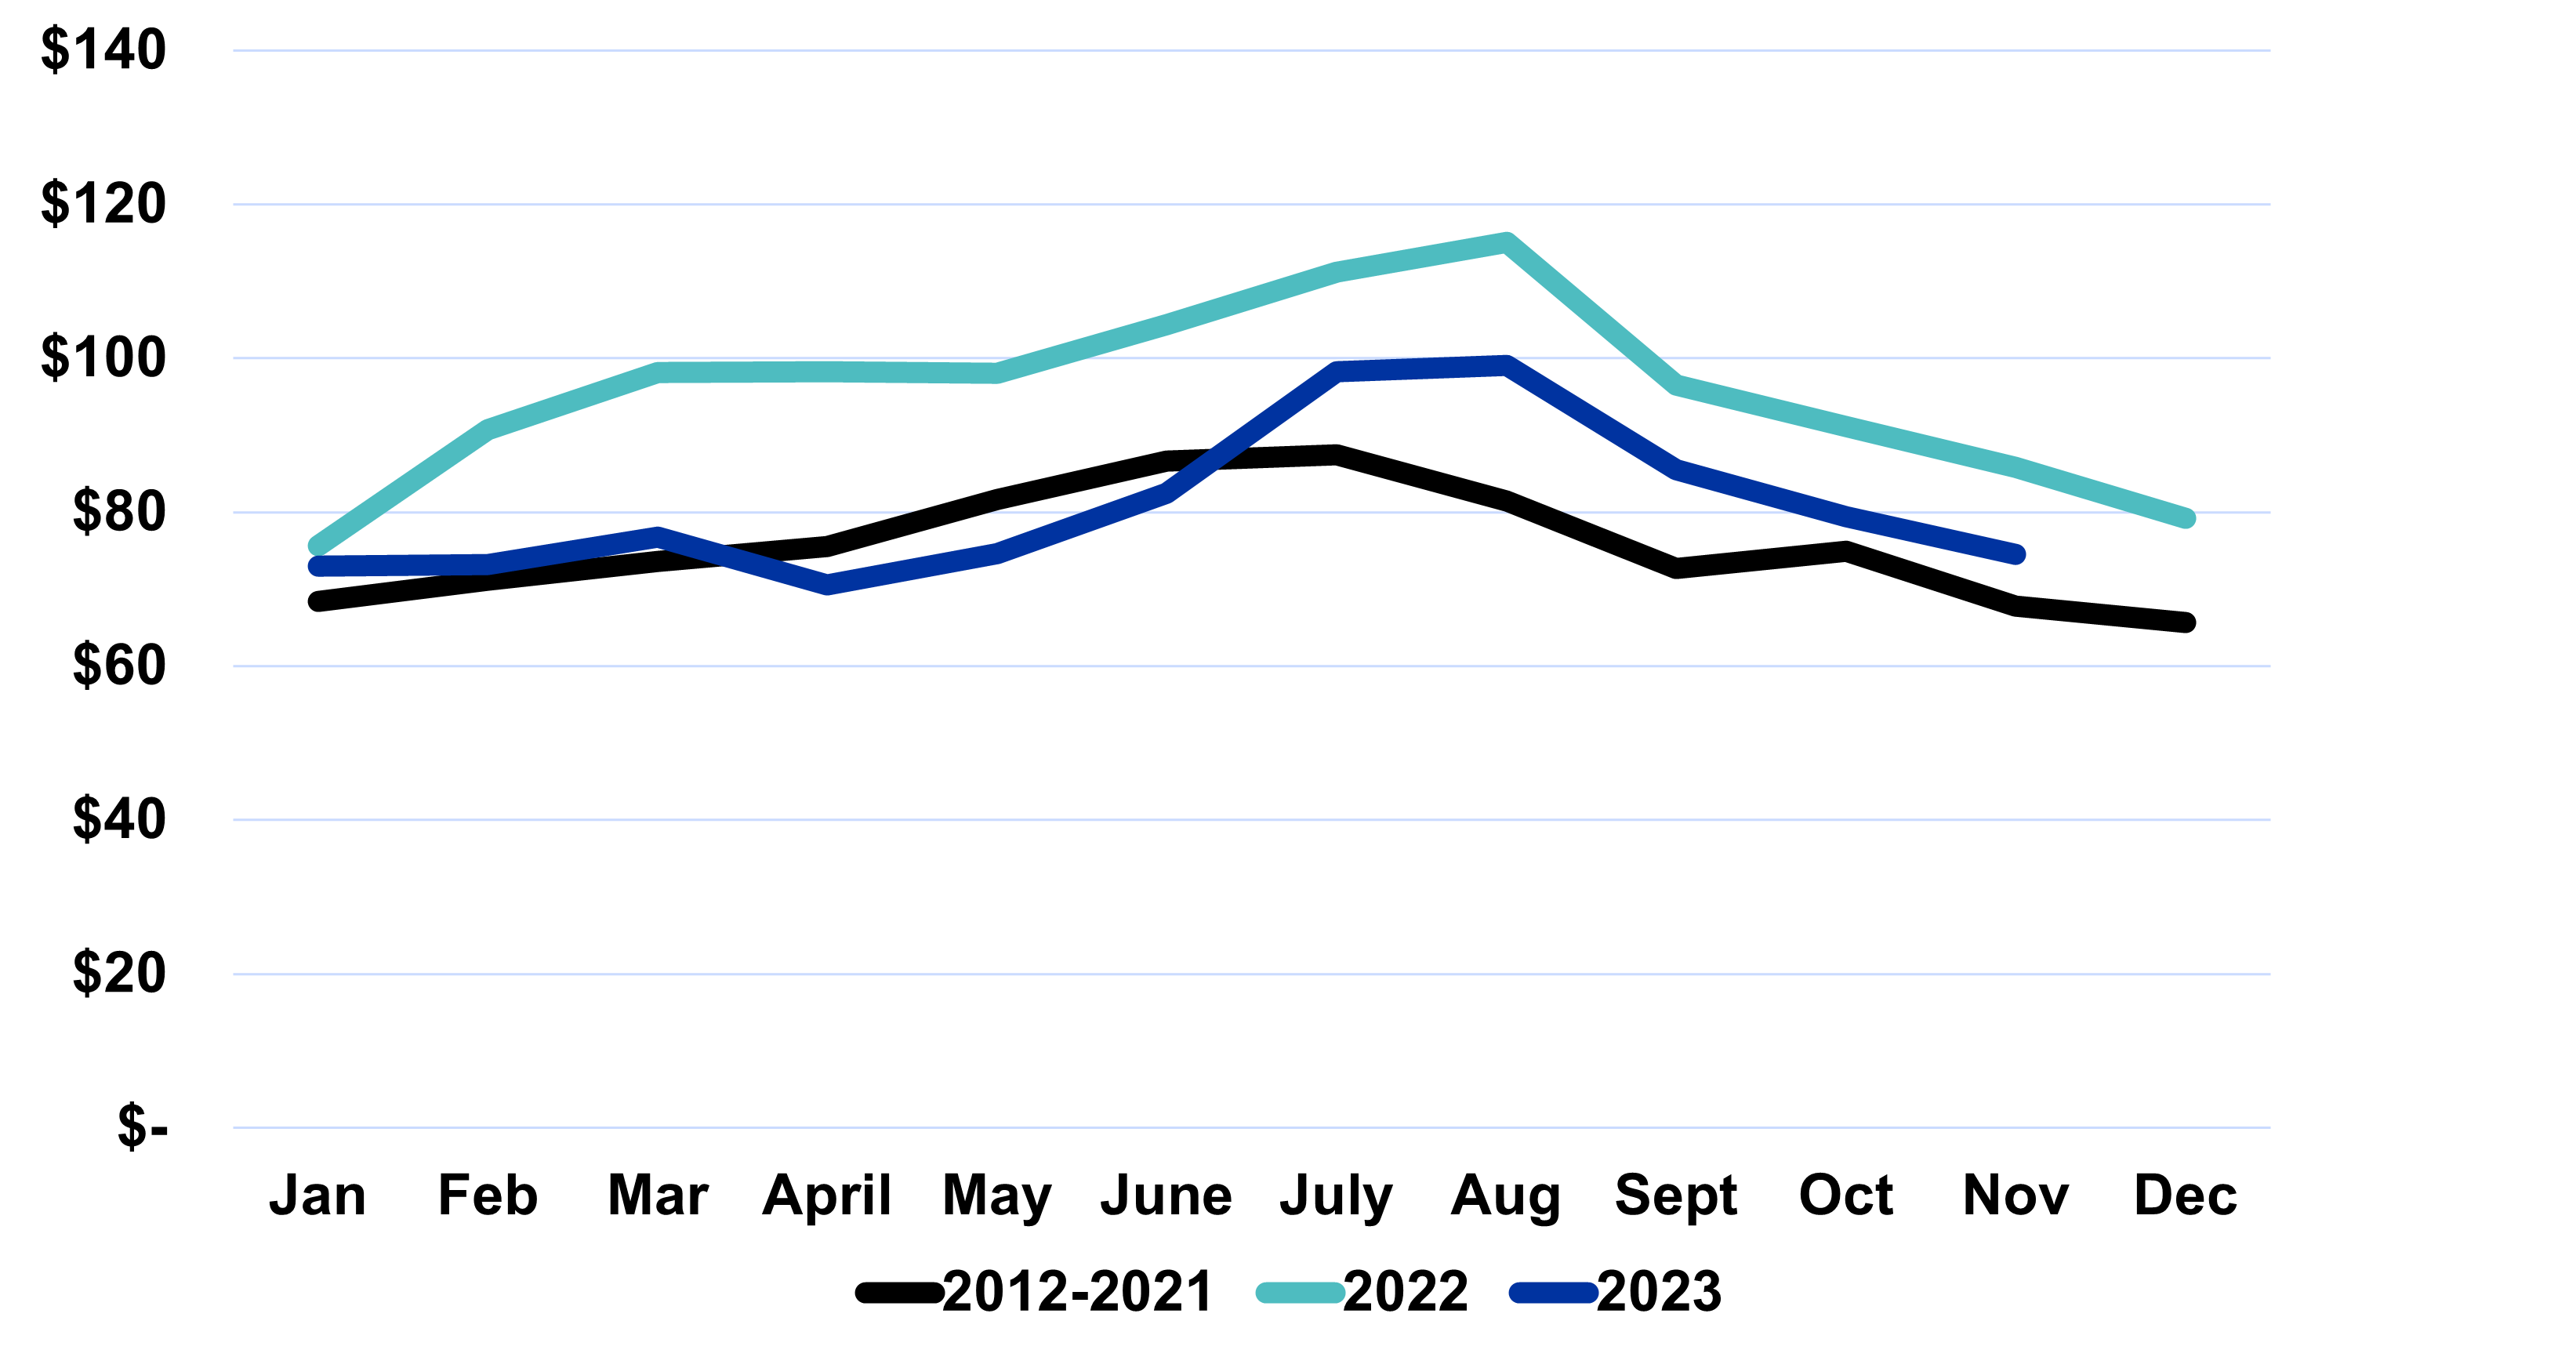
In 2024, corn prices reached their lowest inflation-adjusted level in at least the last decade, signaling one of the worst market outlooks in recent history. Central Kentucky experienced significant yield losses due to drought, although other regions managed average or better production. A near-record corn harvest elsewhere was compounded by substantial carryover from 2023, inflating supply levels and pushing down prices. Demand is expected to remain relatively constant, with ethanol production operating at capacity and no planned expansion, while a smaller cattle herd is limiting feed demand. Although exports are steady, they are insufficient to reduce large ending stocks. As a result, prices declined rapidly from $6.00/bu in late 2022 to around $4.00/bu in 2024. Current trends suggest prices may follow the 2015–2018 average, with modest increases mid-year before falling post-harvest.
2025 Outlook
In 2025, prices are expected to remain depressed with no obvious catalyst to change supply and demand dynamics. Reducing corn acreage will be essential to rebalancing the market while expanding exports could help reduce excess stocks. However, this relies heavily on stable trade relationships and favorable policies, as tariffs and geopolitical tensions remain key risks. Long-term opportunities may arise from initiatives like Sustainable Aviation Fuel, but these depend on policy support. Additionally, the ongoing conflict between Russia and Ukraine could influence global markets, with any escalation potentially driving prices up short-term via speculation.
Key Thoughts
Producers face a challenging financial outlook, with many expected to see losses ("red ink") due to persistently low prices and high supply levels. Effective marketing strategies will be critical in navigating these conditions. Pre-harvest producers are encouraged to book sales early when prices are higher while utilizing storage to capture basis returns post-harvest may offer additional value. Domestic demand remains stable but insufficient to alleviate the supply glut, emphasizing the importance of export markets. While prices are expected to follow their typical cyclical patterns—slowly rising into June or July before declining with new crop supplies—trade policies and geopolitical developments will significantly shape the market.
Kentucky Cash Corn Prices Trends by Year
2024 Situation
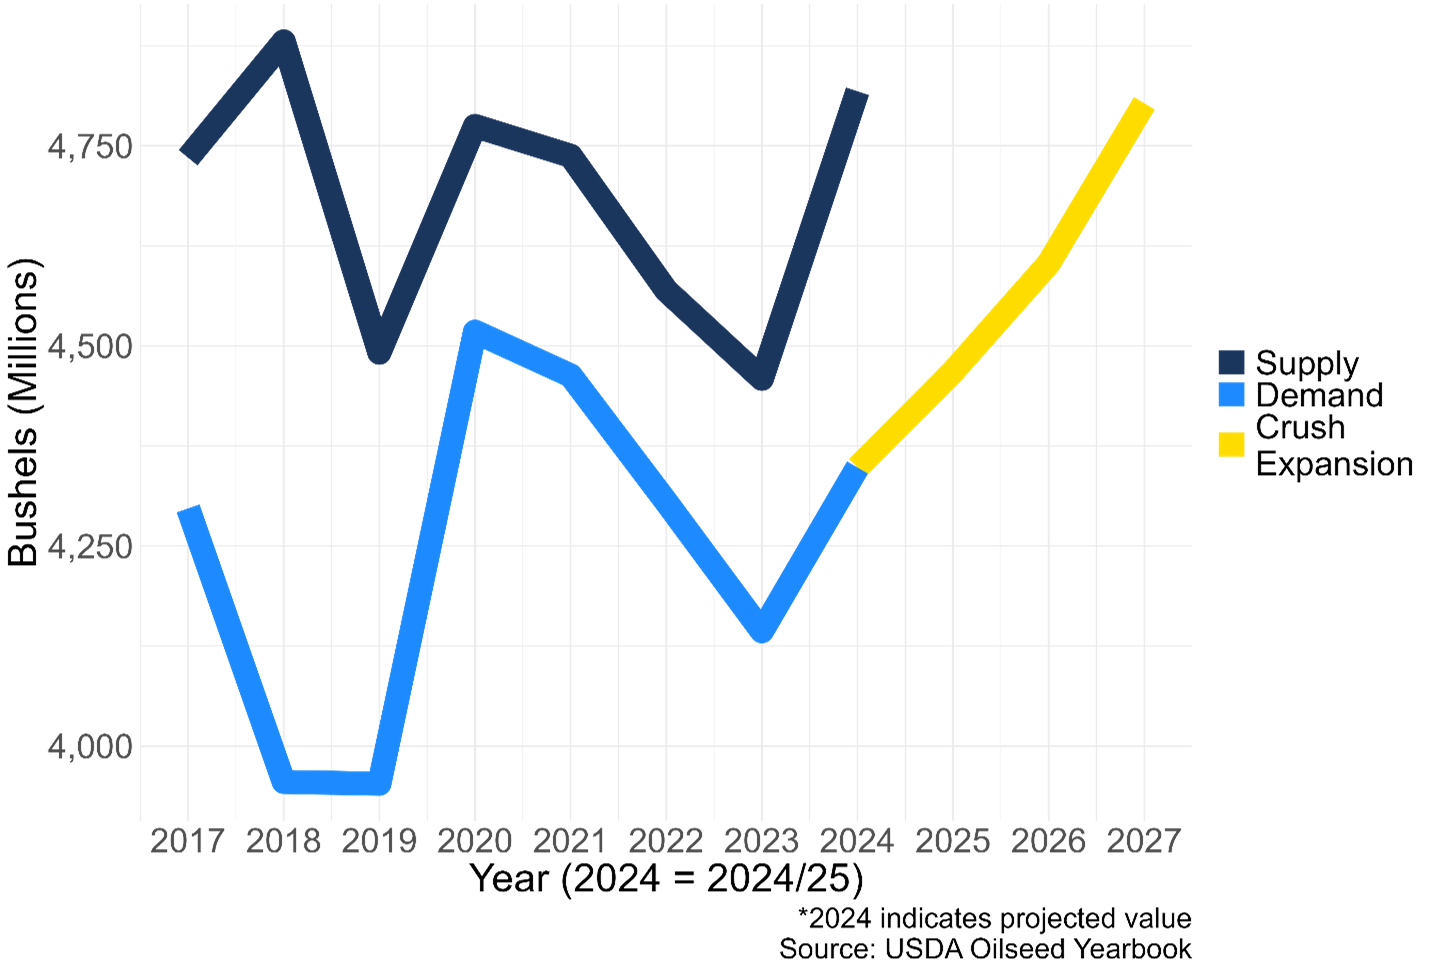
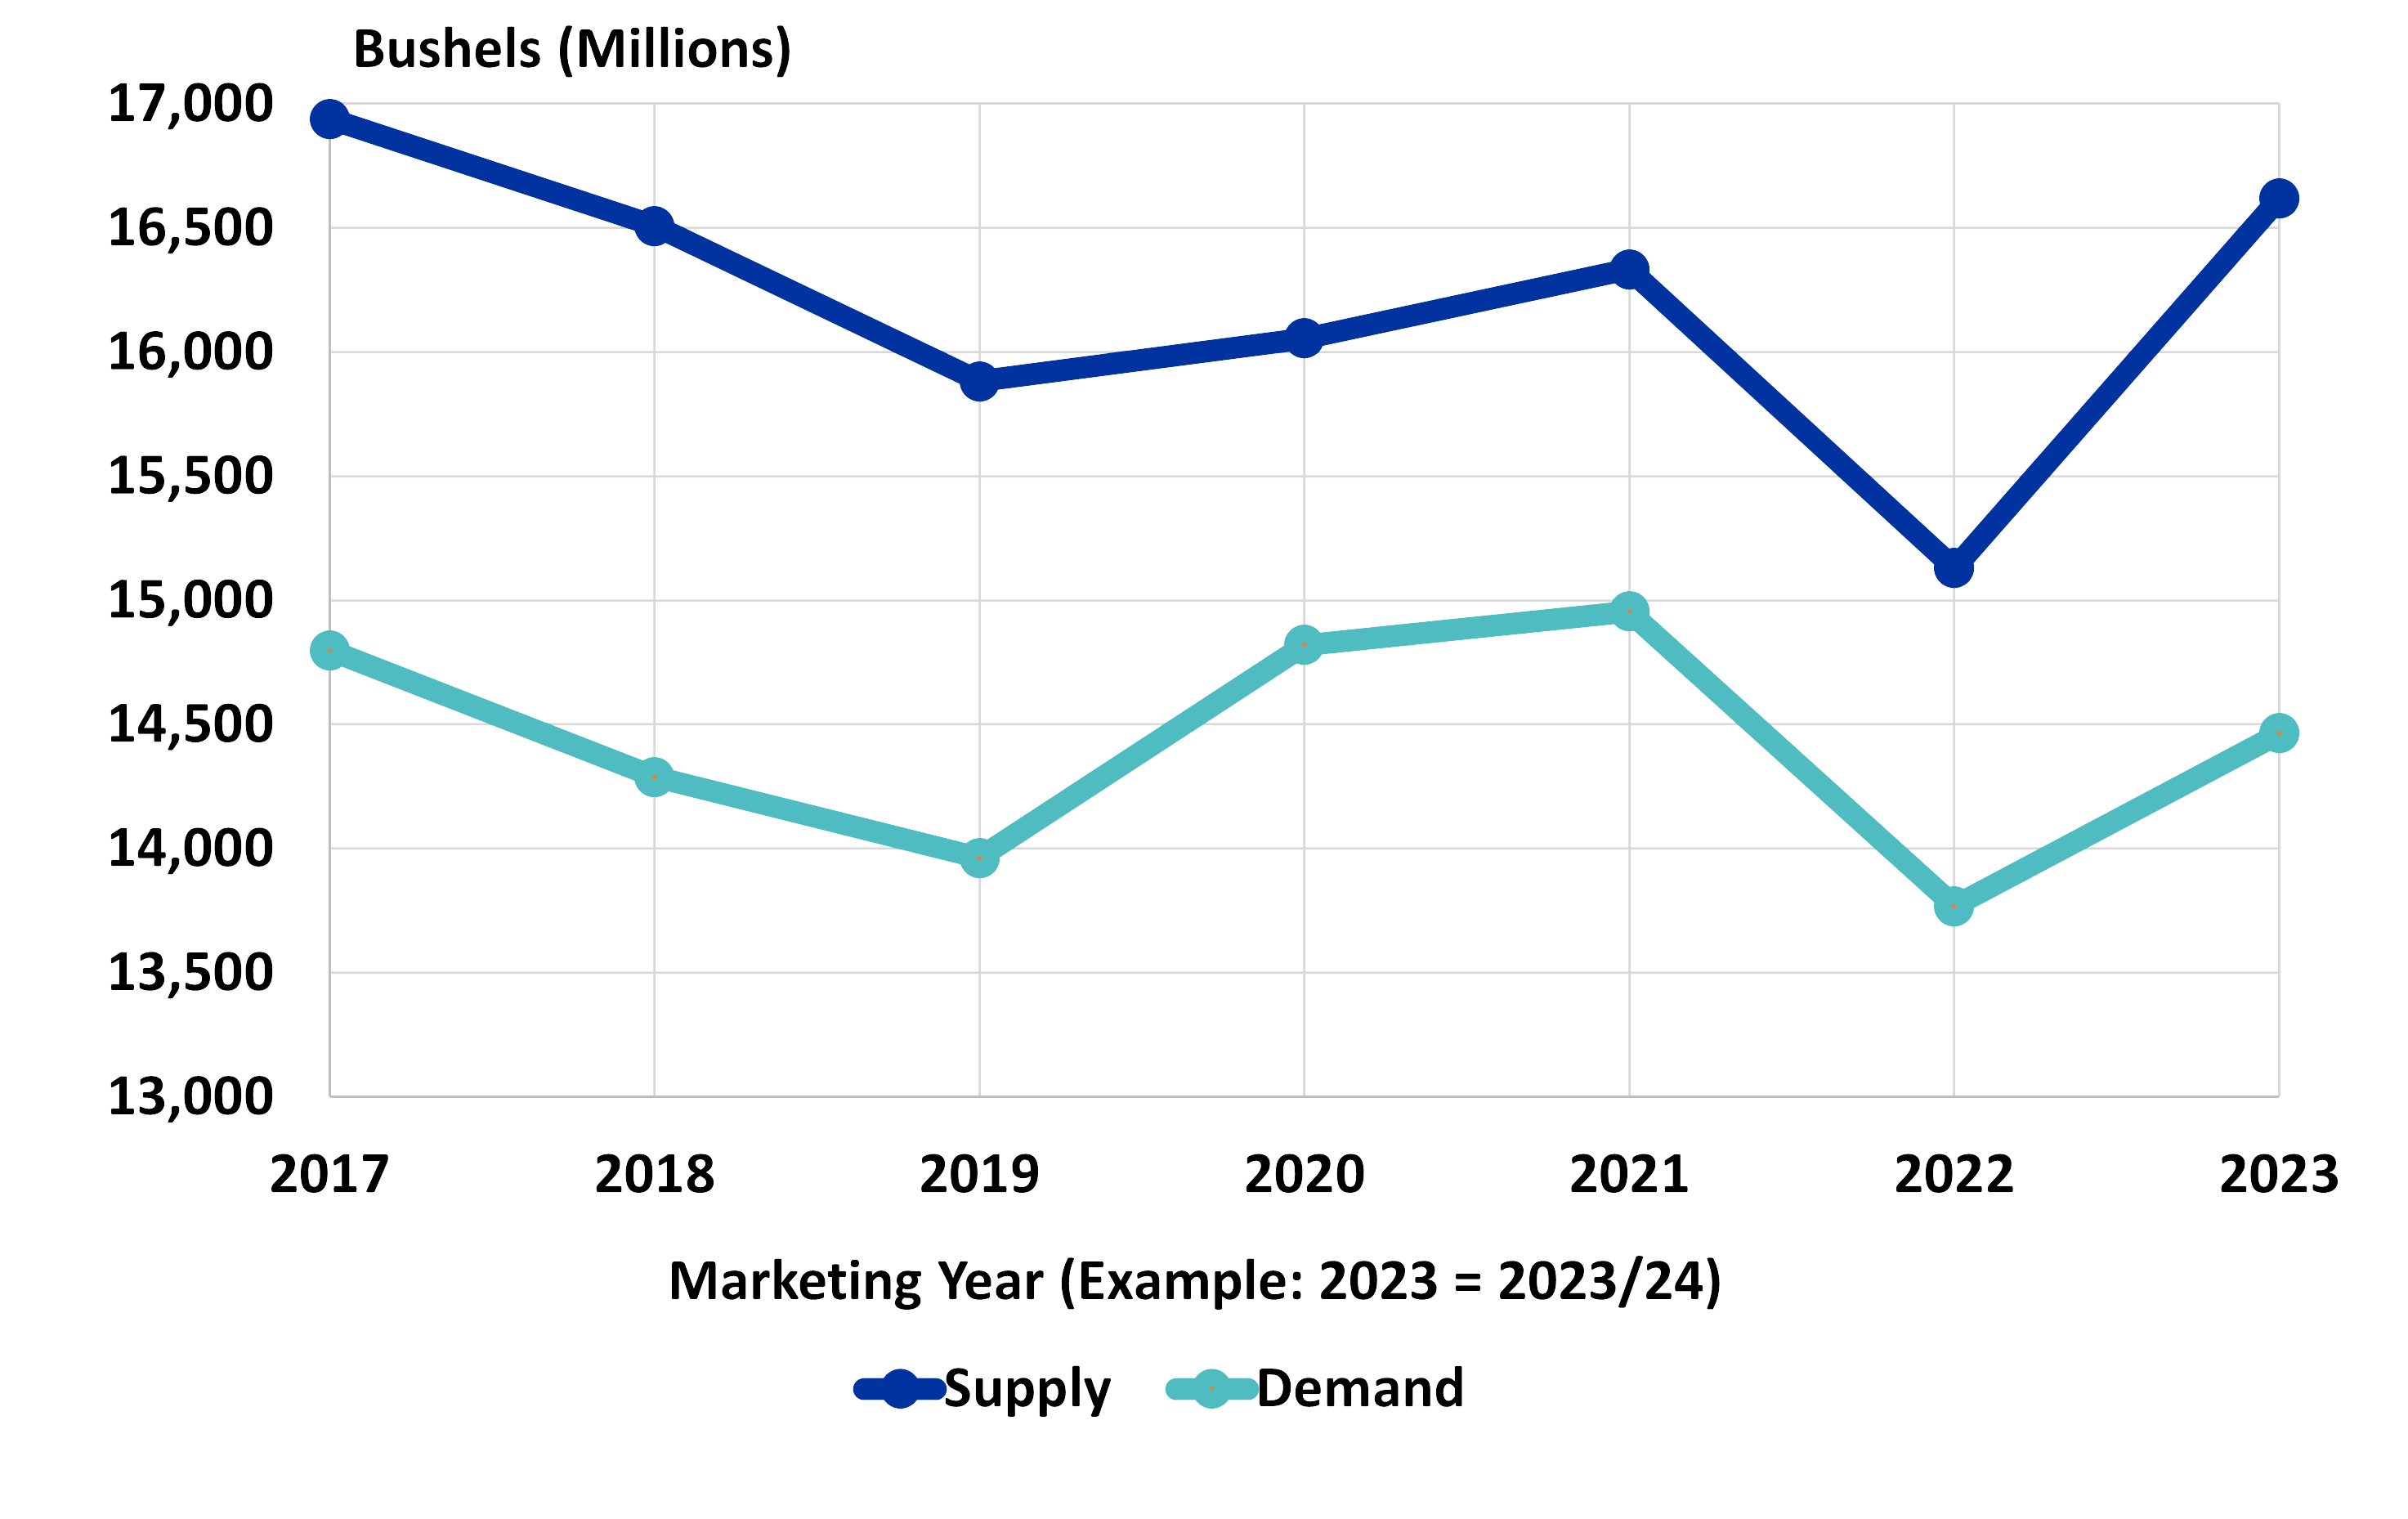
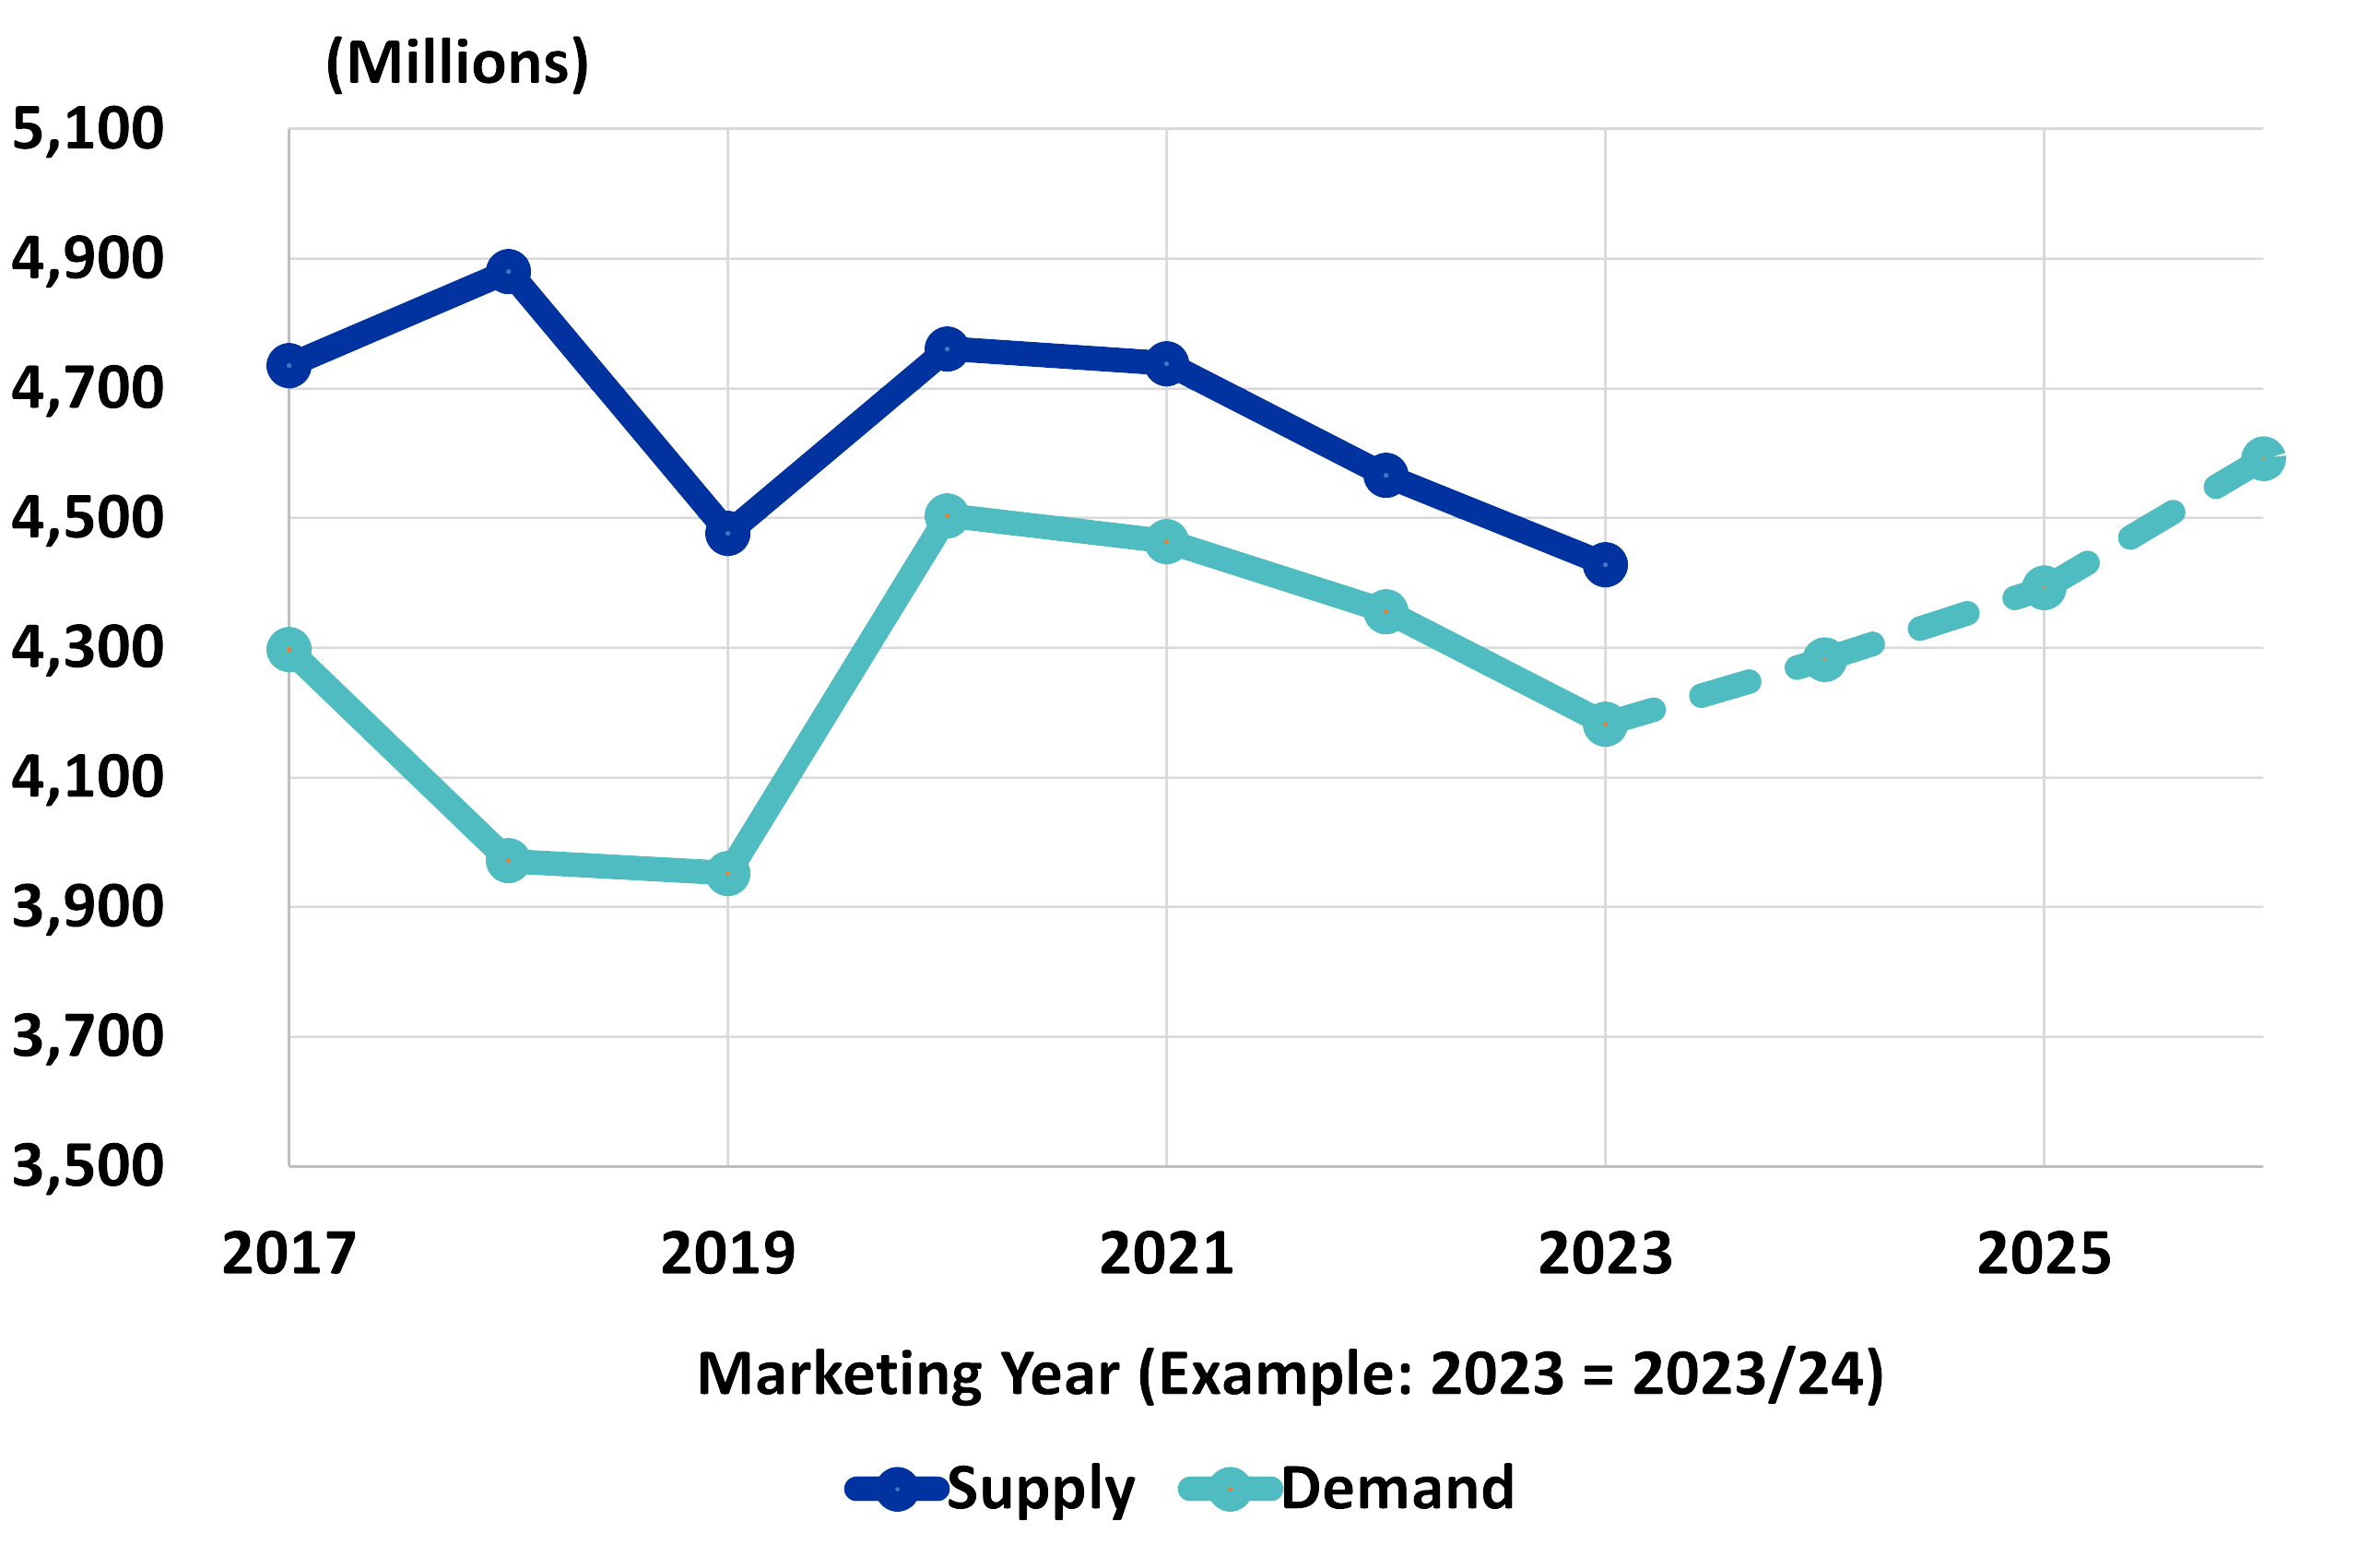
In 2024, soybean prices continued the downward trajectory from the previous year, averaging around $11.50 per bushel. This drop was primarily due to 2024 supply levels nearly matching those of 2018, a period marked by the lowest soybean prices, further exacerbated by the first Trump trade war. While demand has generally increased, driven by expanding crush capacity, the market remains oversupplied. Increased production met the expansion in crush capacity in 2024. Ending stocks suggest some leeway in the balance sheet creating a less volatile price environment.
2025 Outlook
Looking ahead to 2025, soybean prices are expected to follow trends observed in the 2010s. Prices will likely rise as the marketing year progresses, possibly influenced by Brazilian weather in February or March, before declining ahead of harvest in June or July. However, record Brazilian acreage is expected, which could stall price increases. Larger Brazilian acreage and US oversupply are expected to limit any significant price impacts in 2025. While US demand may outpace supply in 2026 if production does not follow crush expansion, the 2025 outlook remains bleak.
Key Thoughts
In the long term, the expansion of crush capacity through 2027 will likely tighten balance sheets and drive higher prices. However, these impacts depend on achieving expansion targets and meeting crush capacity. Although immediate effects on 2025 prices may be minimal, the long-term outlook suggests direct effects on soybean prices and indirect effects on corn prices. Key uncertainties include the amount of supply left on the market, acreage and production trends for 2026, and potential policy impacts from Trump trade strategies. Overall, while demand and crush capacity continue to grow, the current oversupply dampens short-term price prospects, with a more optimistic outlook for the coming years. The strategies of early marketing for delivery and utilizing storage for basis returns will again be key strategies in 2025.
U.S. Soybean Supply and Demand by Marketing Year
2024 Situation
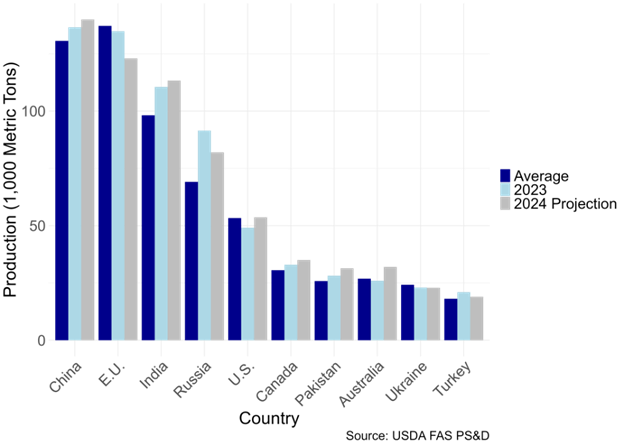
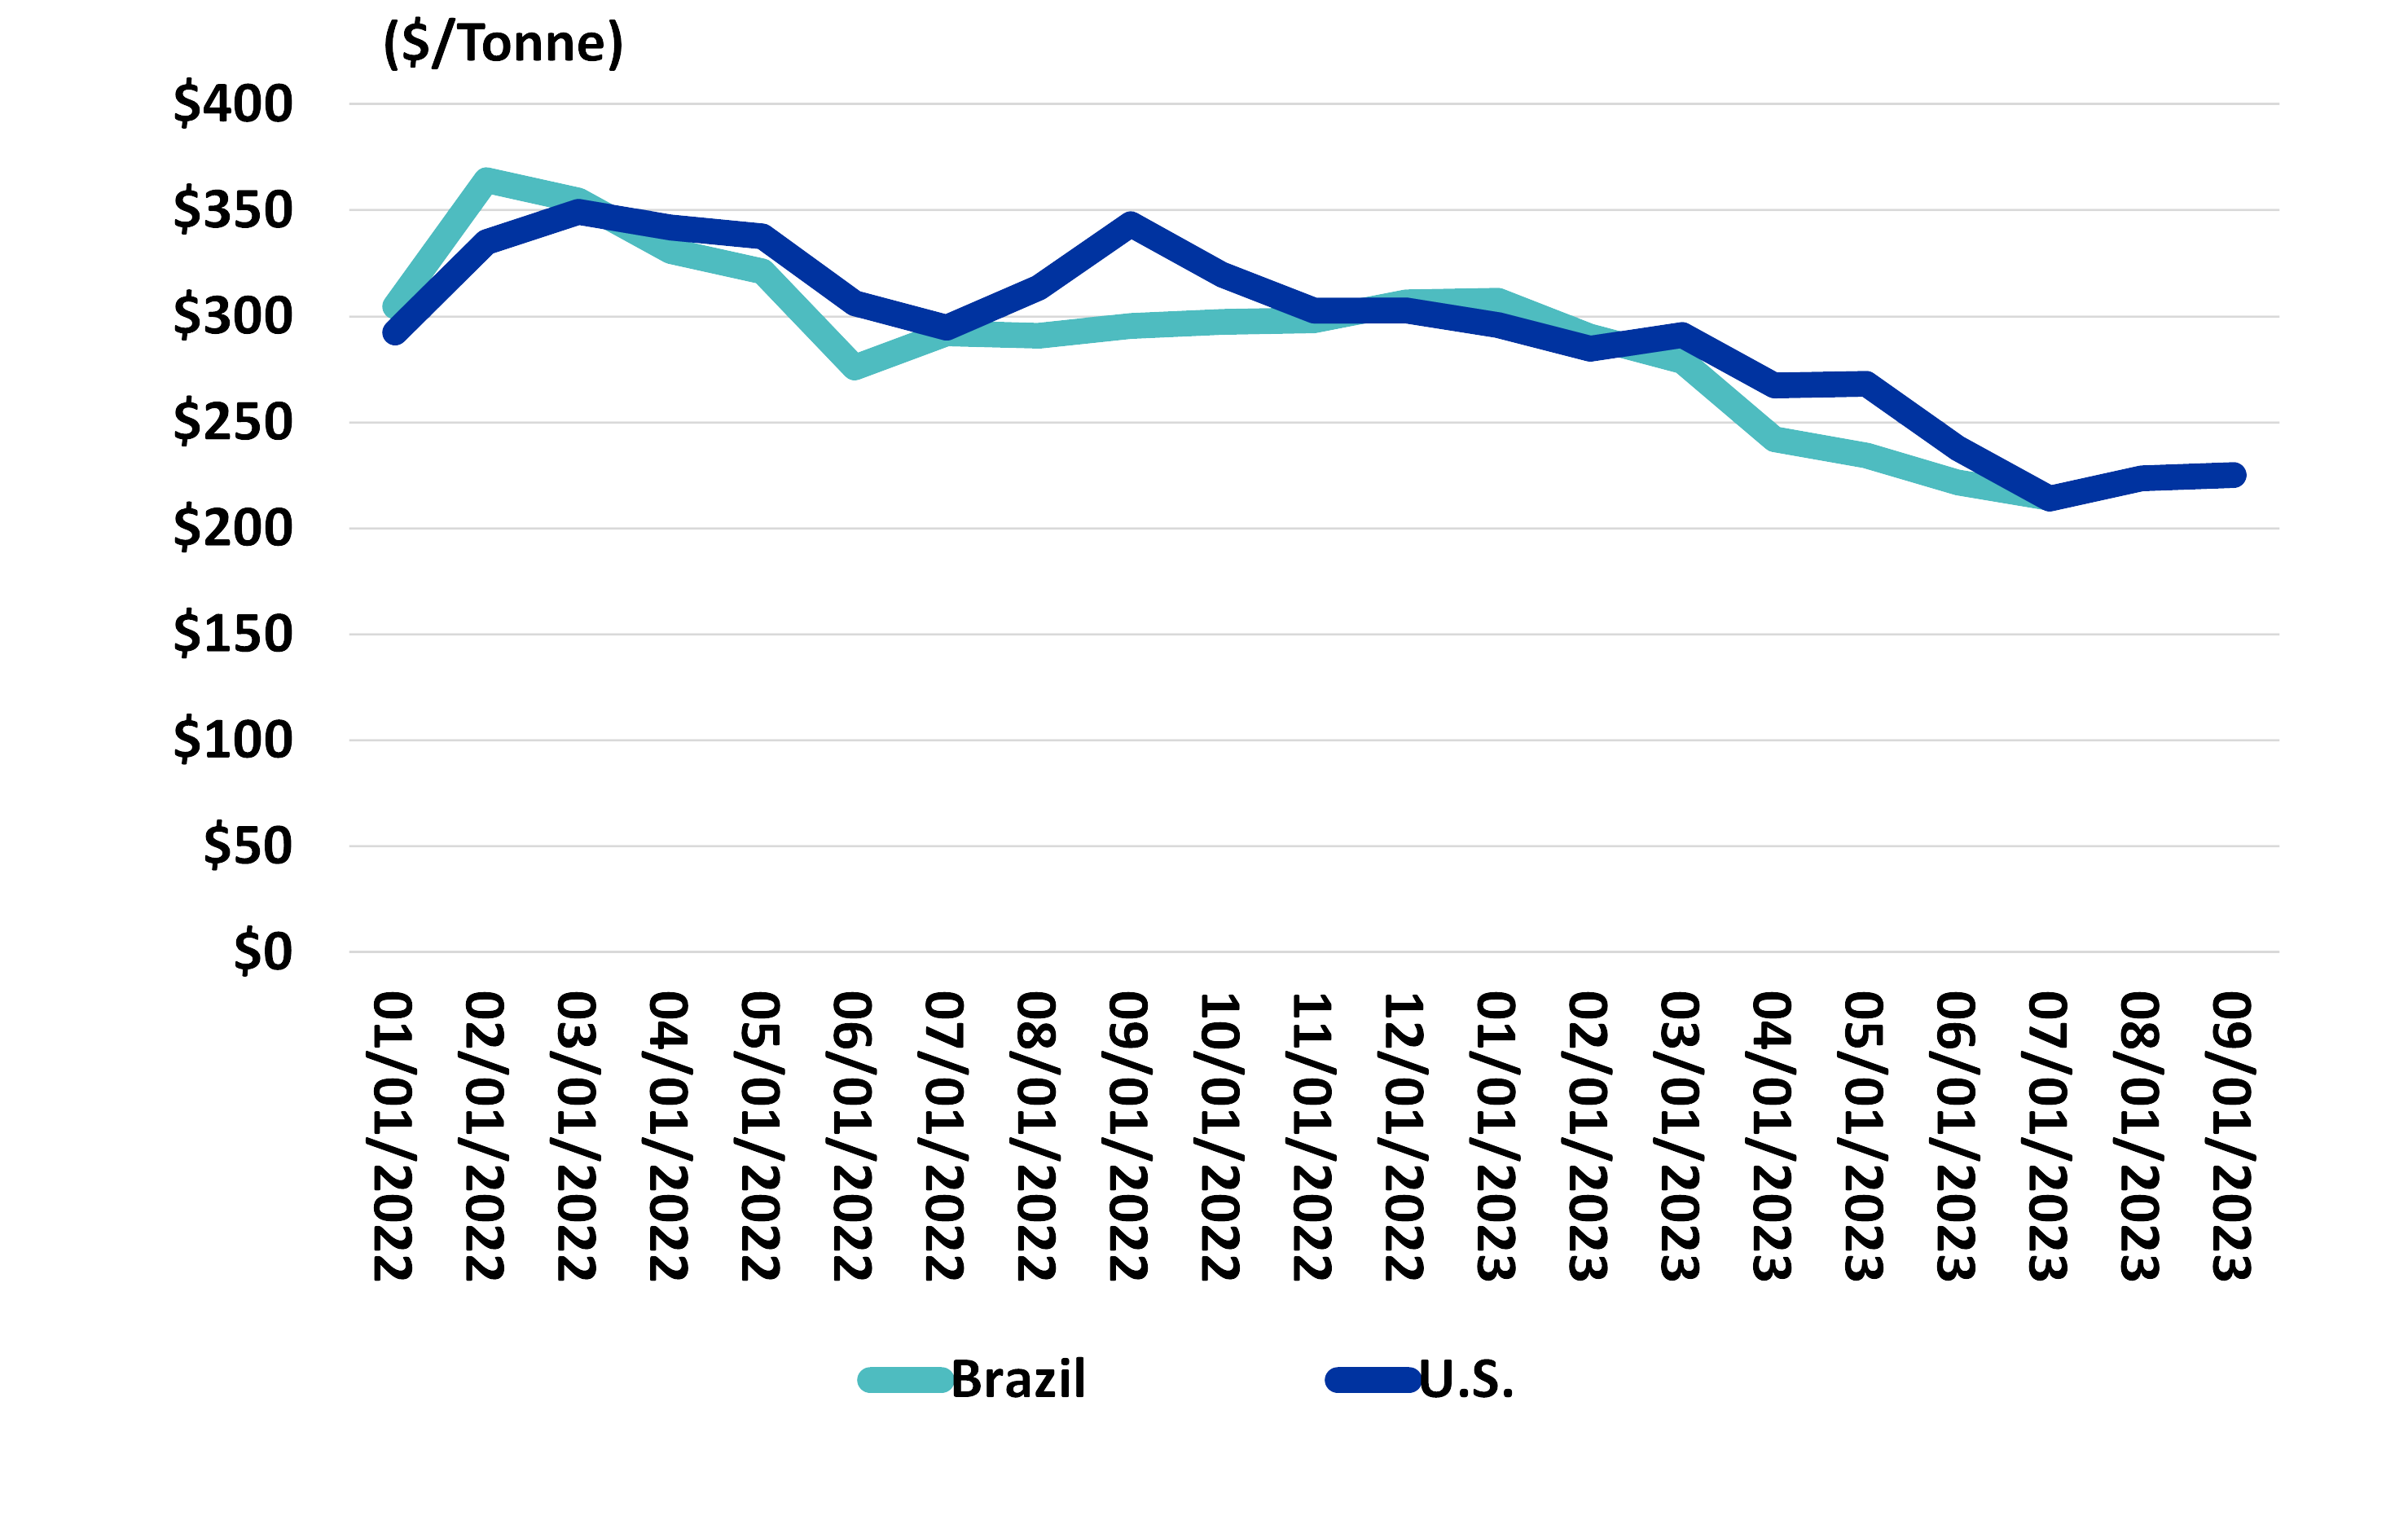
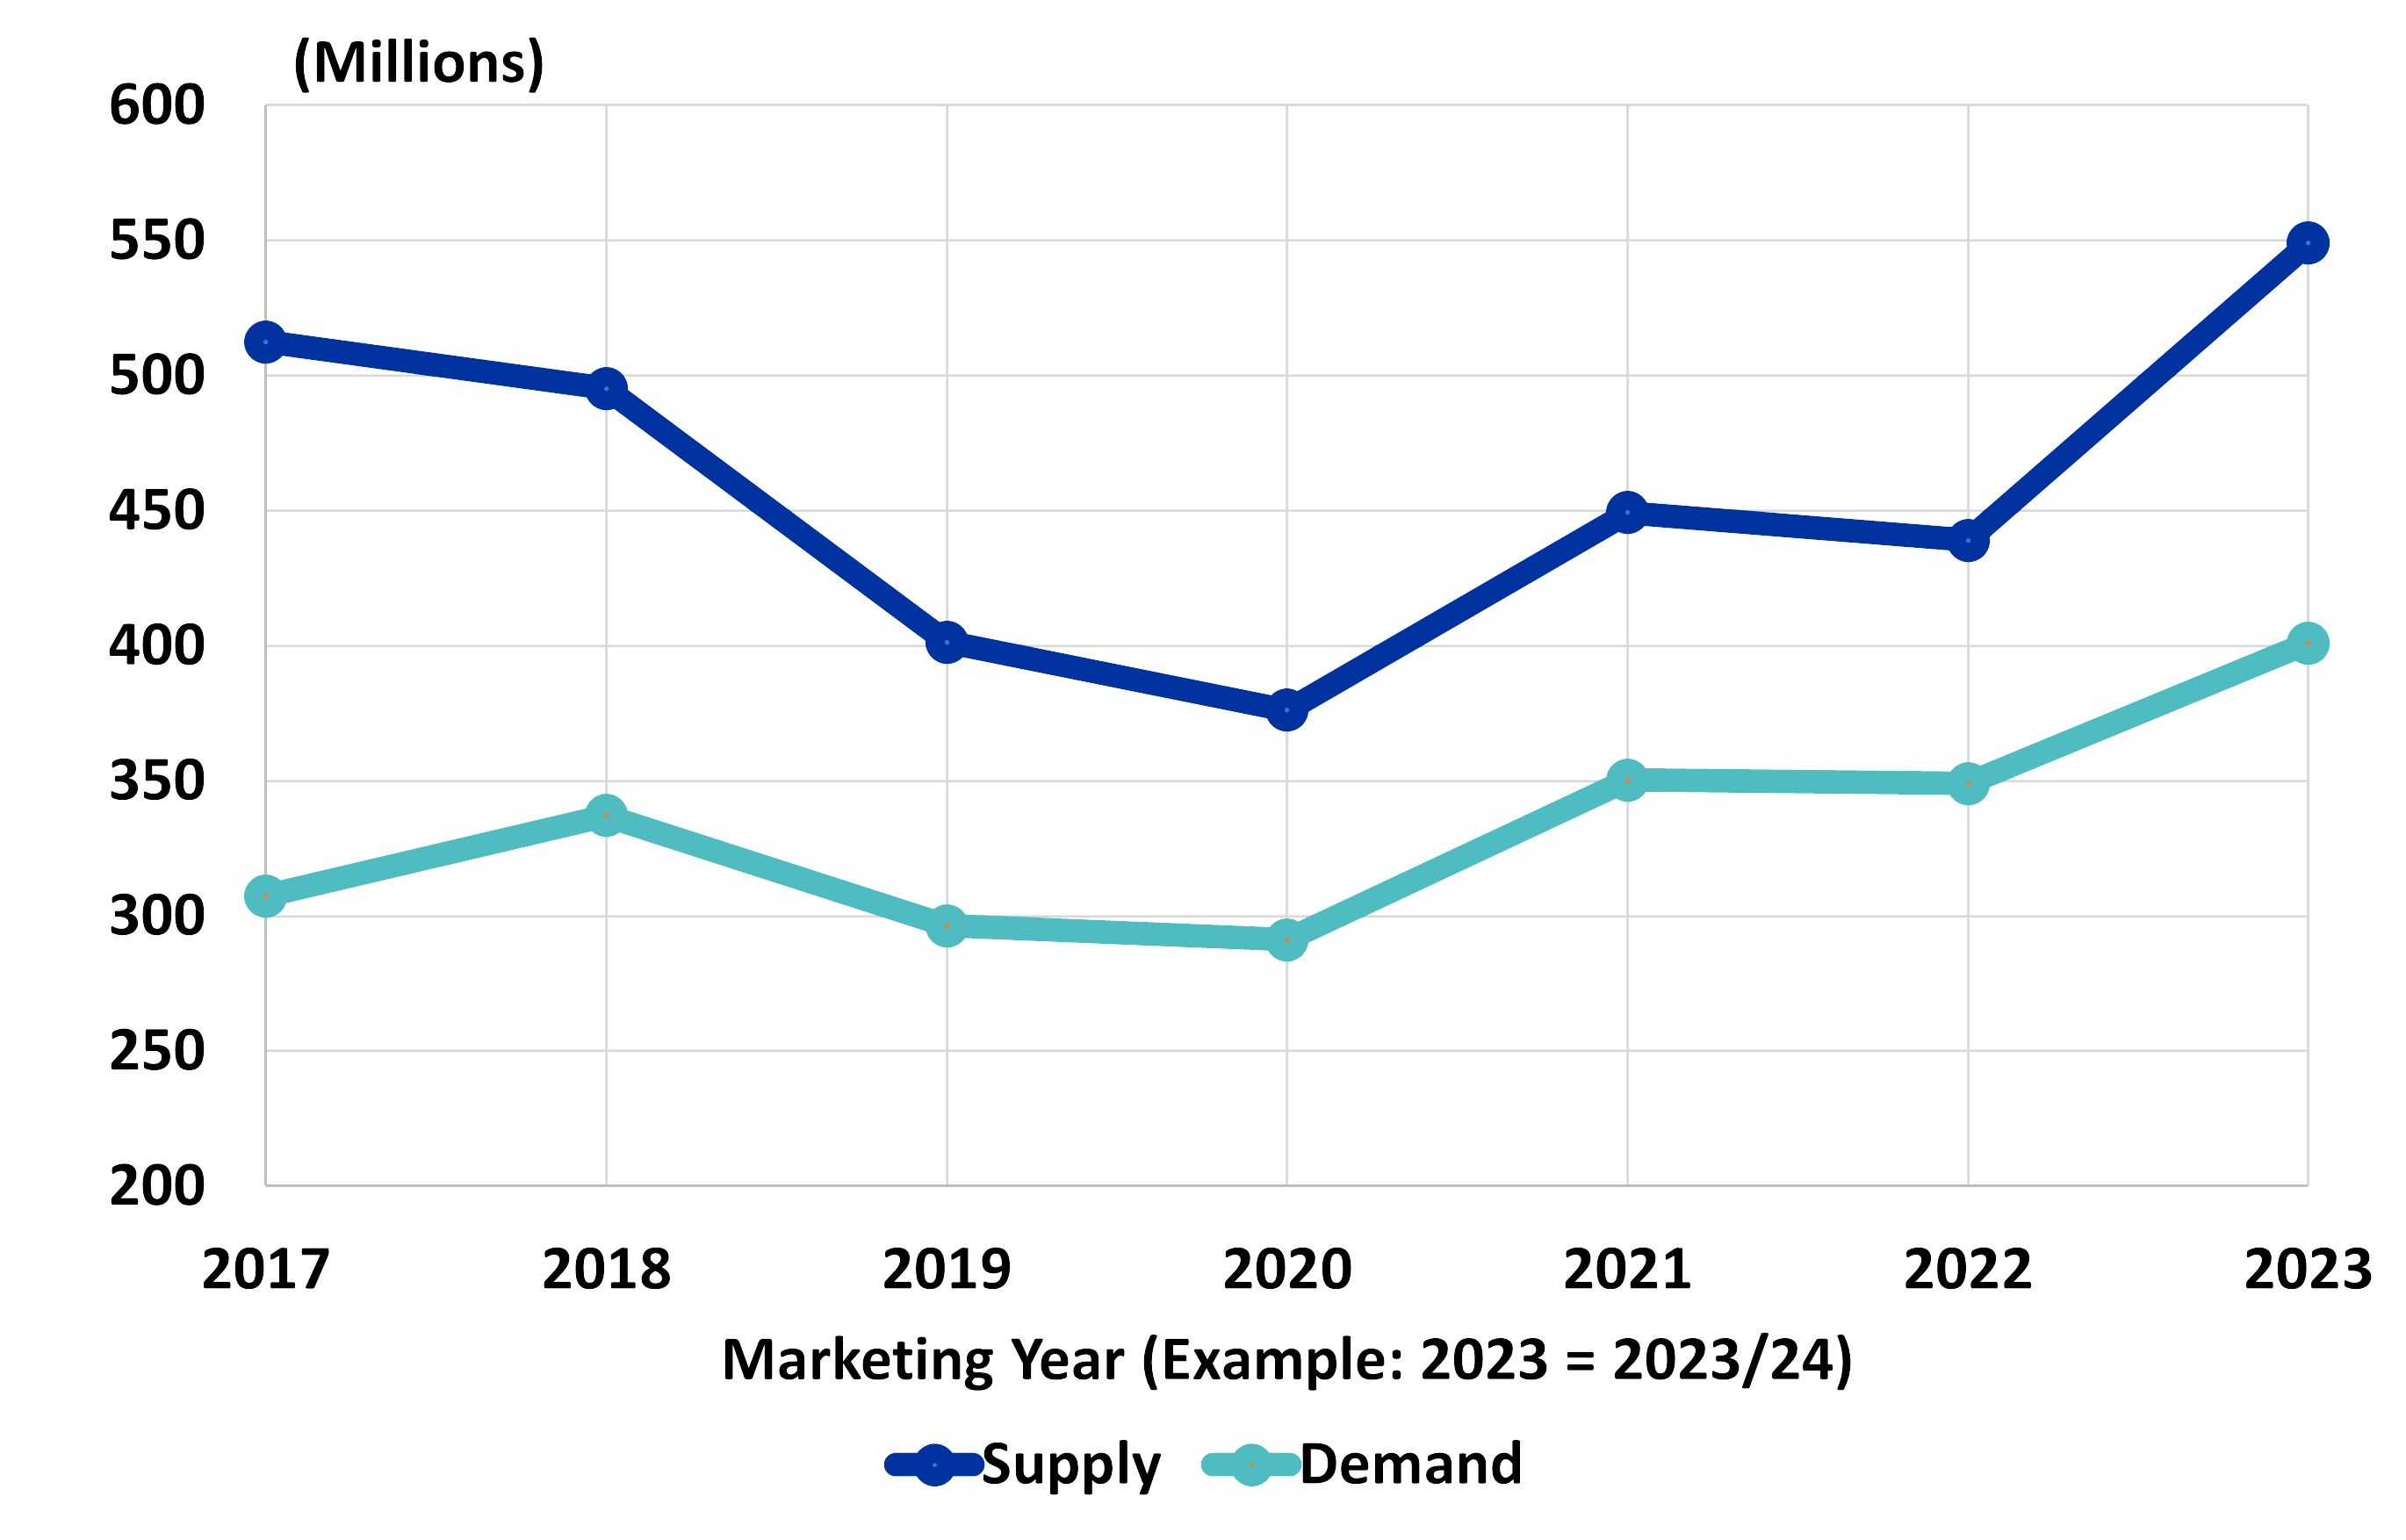
U.S. wheat supply increased in 2024, driven primarily by higher production even with reduced U.S. imports. Despite this, prices have risen since August, although it remains uncertain if a bottom has been reached. Last year’s average price was $6.50, with higher prices earlier in the year, and current harvest-time futures around $5.47/bu. Domestic demand for food use has remained steady, while seed, feed, and residual demand are flat. However, U.S. ending stocks are projected to rise, emphasizing the importance of exports.
2025 Outlook
Looking ahead to 2025, futures prices did not incentivize wheat acreage, leading to expectations of less double-crop wheat/soybean planting and reduced soft red winter wheat acreage. With a smaller expected acreage, price movements may be driven by demand, particularly in export markets, as global stocks remain tight. Wheat exports could depend on both quality and quantity, and low EU stocks and poor-quality production may present opportunities for U.S. wheat. Geopolitical uncertainties, including the Russia/Ukraine conflict, could still cause price fluctuations. While extreme swings like those in 2022 are unlikely, speculation could lead to significant volatility and pricing opportunities. Smaller U.S. wheat acreage in 2025 may contribute to supply-driven price changes as the market tries to buy wheat acres for 2026.
Key Points
- U.S. wheat supply is up, but double crop acreage is likely to decline.
- Tight world stocks and the EU facing production and quality issues may provide export opportunities for U.S. wheat.
- Geopolitical factors, particularly Russia/Ukraine, and speculative markets could drive price volatility and create short-term pricing opportunities.
Wheat Production by Country
2024 Situation
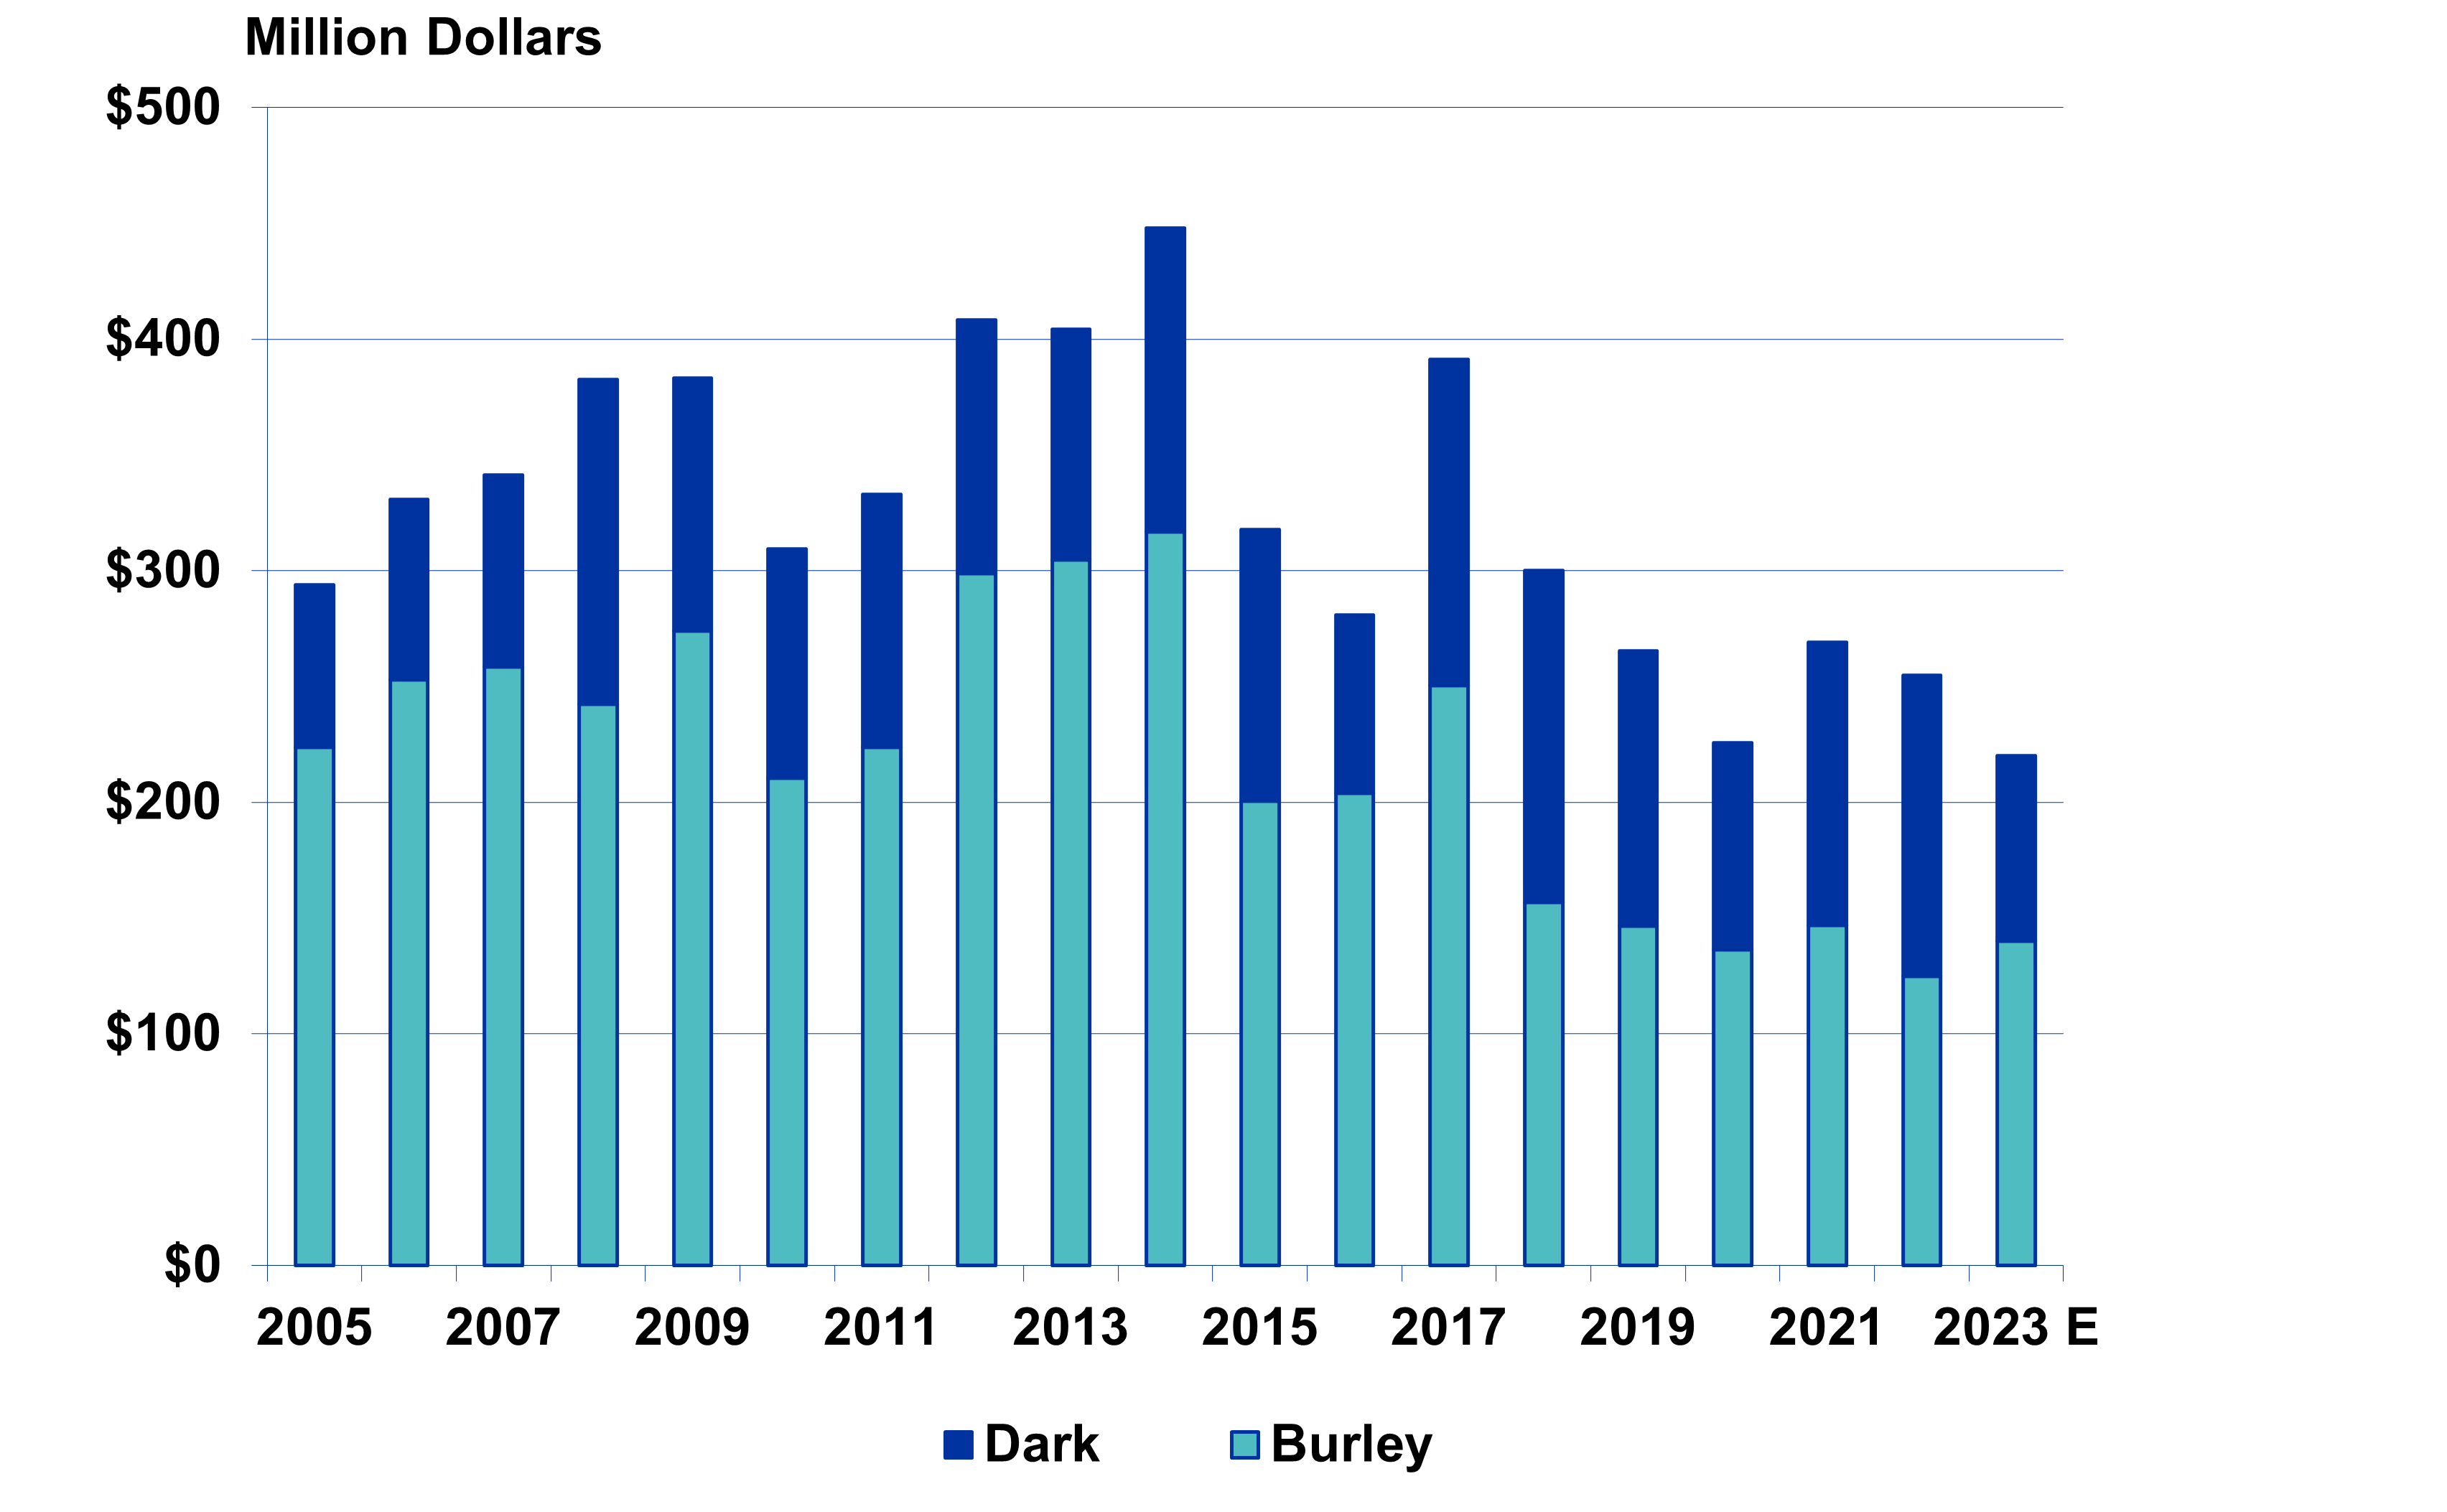
This past season has been another challenging year for tobacco farmers, ranging from extreme weather events to escalating declines in tobacco product sales. Burley supplies remain tight globally, but the supply/demand balance is not as tight as it has been in recent years given a significant decline in U.S. cigarette sales. Historically, U.S. cigarette sales have declined at a 2 to 4% annual pace, but have accelerated in recent years to falling nearly 10% annually. The U.S. dark tobacco industry continues to be plagued by the entry of nicotine pouches in the U.S. marketplace which do not contain any tobacco leaf. This market is growing at an annual 30%+ pace compared to an annual decline in snuff sales, the primary user of dark tobaccos, approaching 10%. On a positive note, the tight global supplies of burley have enabled the U.S. burley sector to experience some modest rebound in leaf exports, but coming off several years of extremely low burley export levels hovering around 10 to 15 million pounds. Given the severe decline in U.S. burley exports over the years, U.S. burley has become like the U.S, dark tobacco sector -- dependent primarily on sales of domestic tobacco products. Burley imports, while lower in 2024, continue to take a relatively high share of domestic burley use by cigarette manufacturers with volumes approaching 100 million pounds annually. U.S. burley production for this year is pegged by USDA at 55 million pounds (vs 65 million pounds in 2023), with U.S. dark fire-cured estimated to be 24 million pounds (vs 36 million pounds in 2023) and U.S. dark air-cured expected to total 11 million pounds (vs 12 million pounds in 2023). Despite the adverse weather issues, the 2024 market has generated higher leaf prices as quality and yields, in general, were better than anticipated given the challenging growing/curing conditions. However, on-going increases in labor costs and other inflated iinput expenses continue to dampen tobacco profit margins, threating additional grower attrition. And this may be the first year since 1955 that the value of tobacco production in Kentucky may have slipped below $200 million.
2025 Outlook
Looking ahead to 2025, the industry will likely continue to lose growers as profit margins remain thin based upon limited leaf price increases, yield expectations, wage rate hikes, labor challenges, and company requirements. Given anticipated declines in U.S. cigarette sales, and increased burley production overseas, total needs for U.S. burley among domestic buyers are likely to continue to fall, but individual burley grower contract volume may remain near recent levels due to grower attrition. Dark tobacco growers may not be that fortunate as smokeless tobacco manufactures continue to adjust inventories amidst slumping snuff sales.
Contract price decisions by the buyers will play a huge role in the number of growers remaining in the industry for the coming year. Continued strong cattle prices may entice some tobacco farmers to exit the industry given declining leaf needs and tightening profit margins. Alternatively, anticipated weak grain markets may encourage some farmers (especially in the dark tobacco region) to hang in there for another growing season based on labor and infrastructure availability.
Value of Kentucky Tobacco Production (1997-2024)
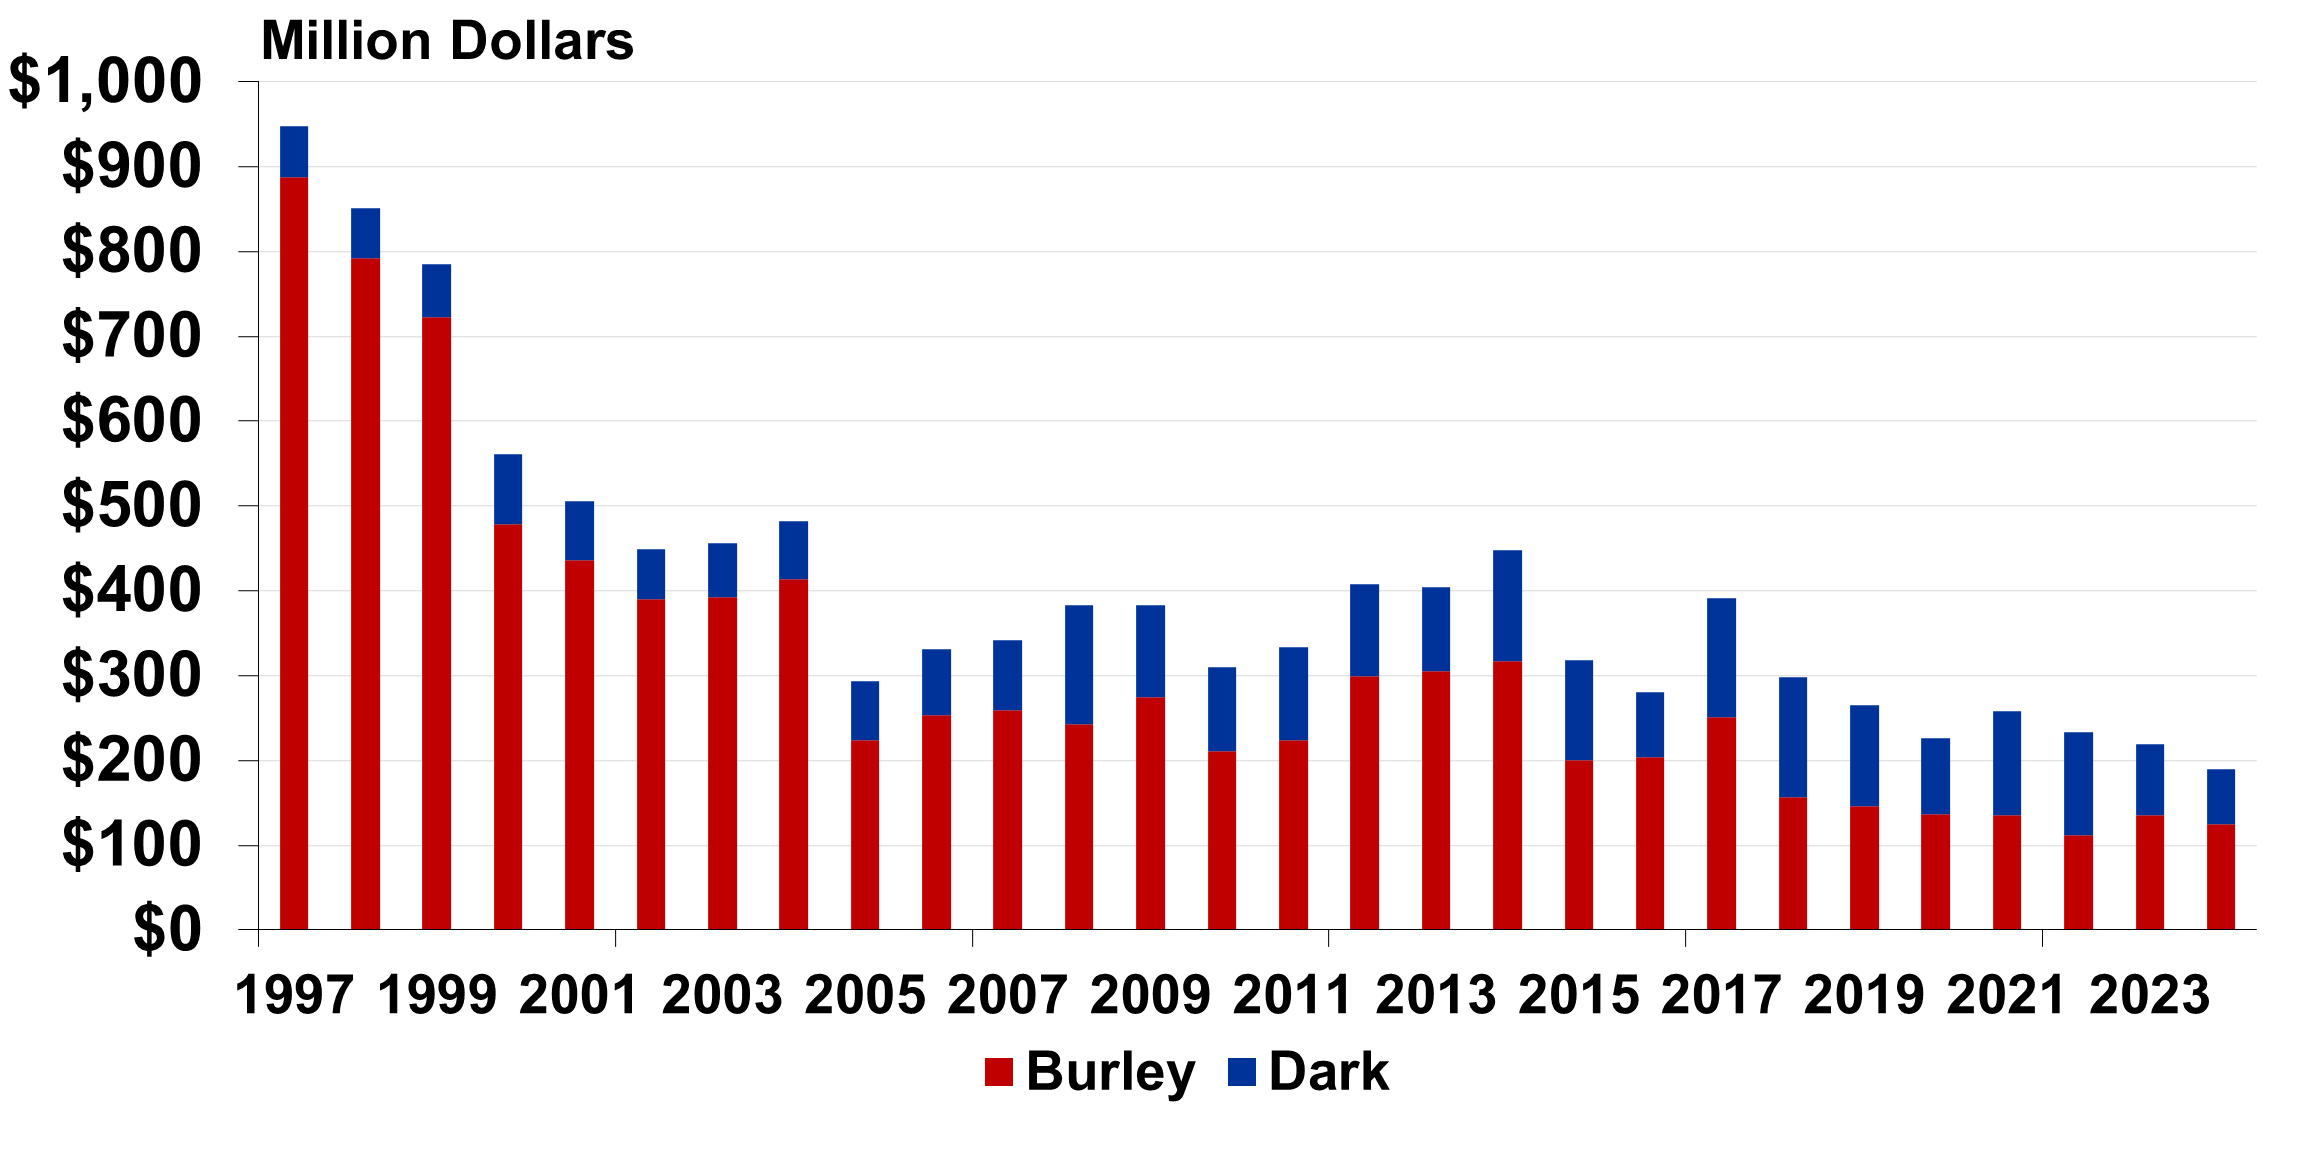
Source: USDA, NASS, 2024 estimate by UK
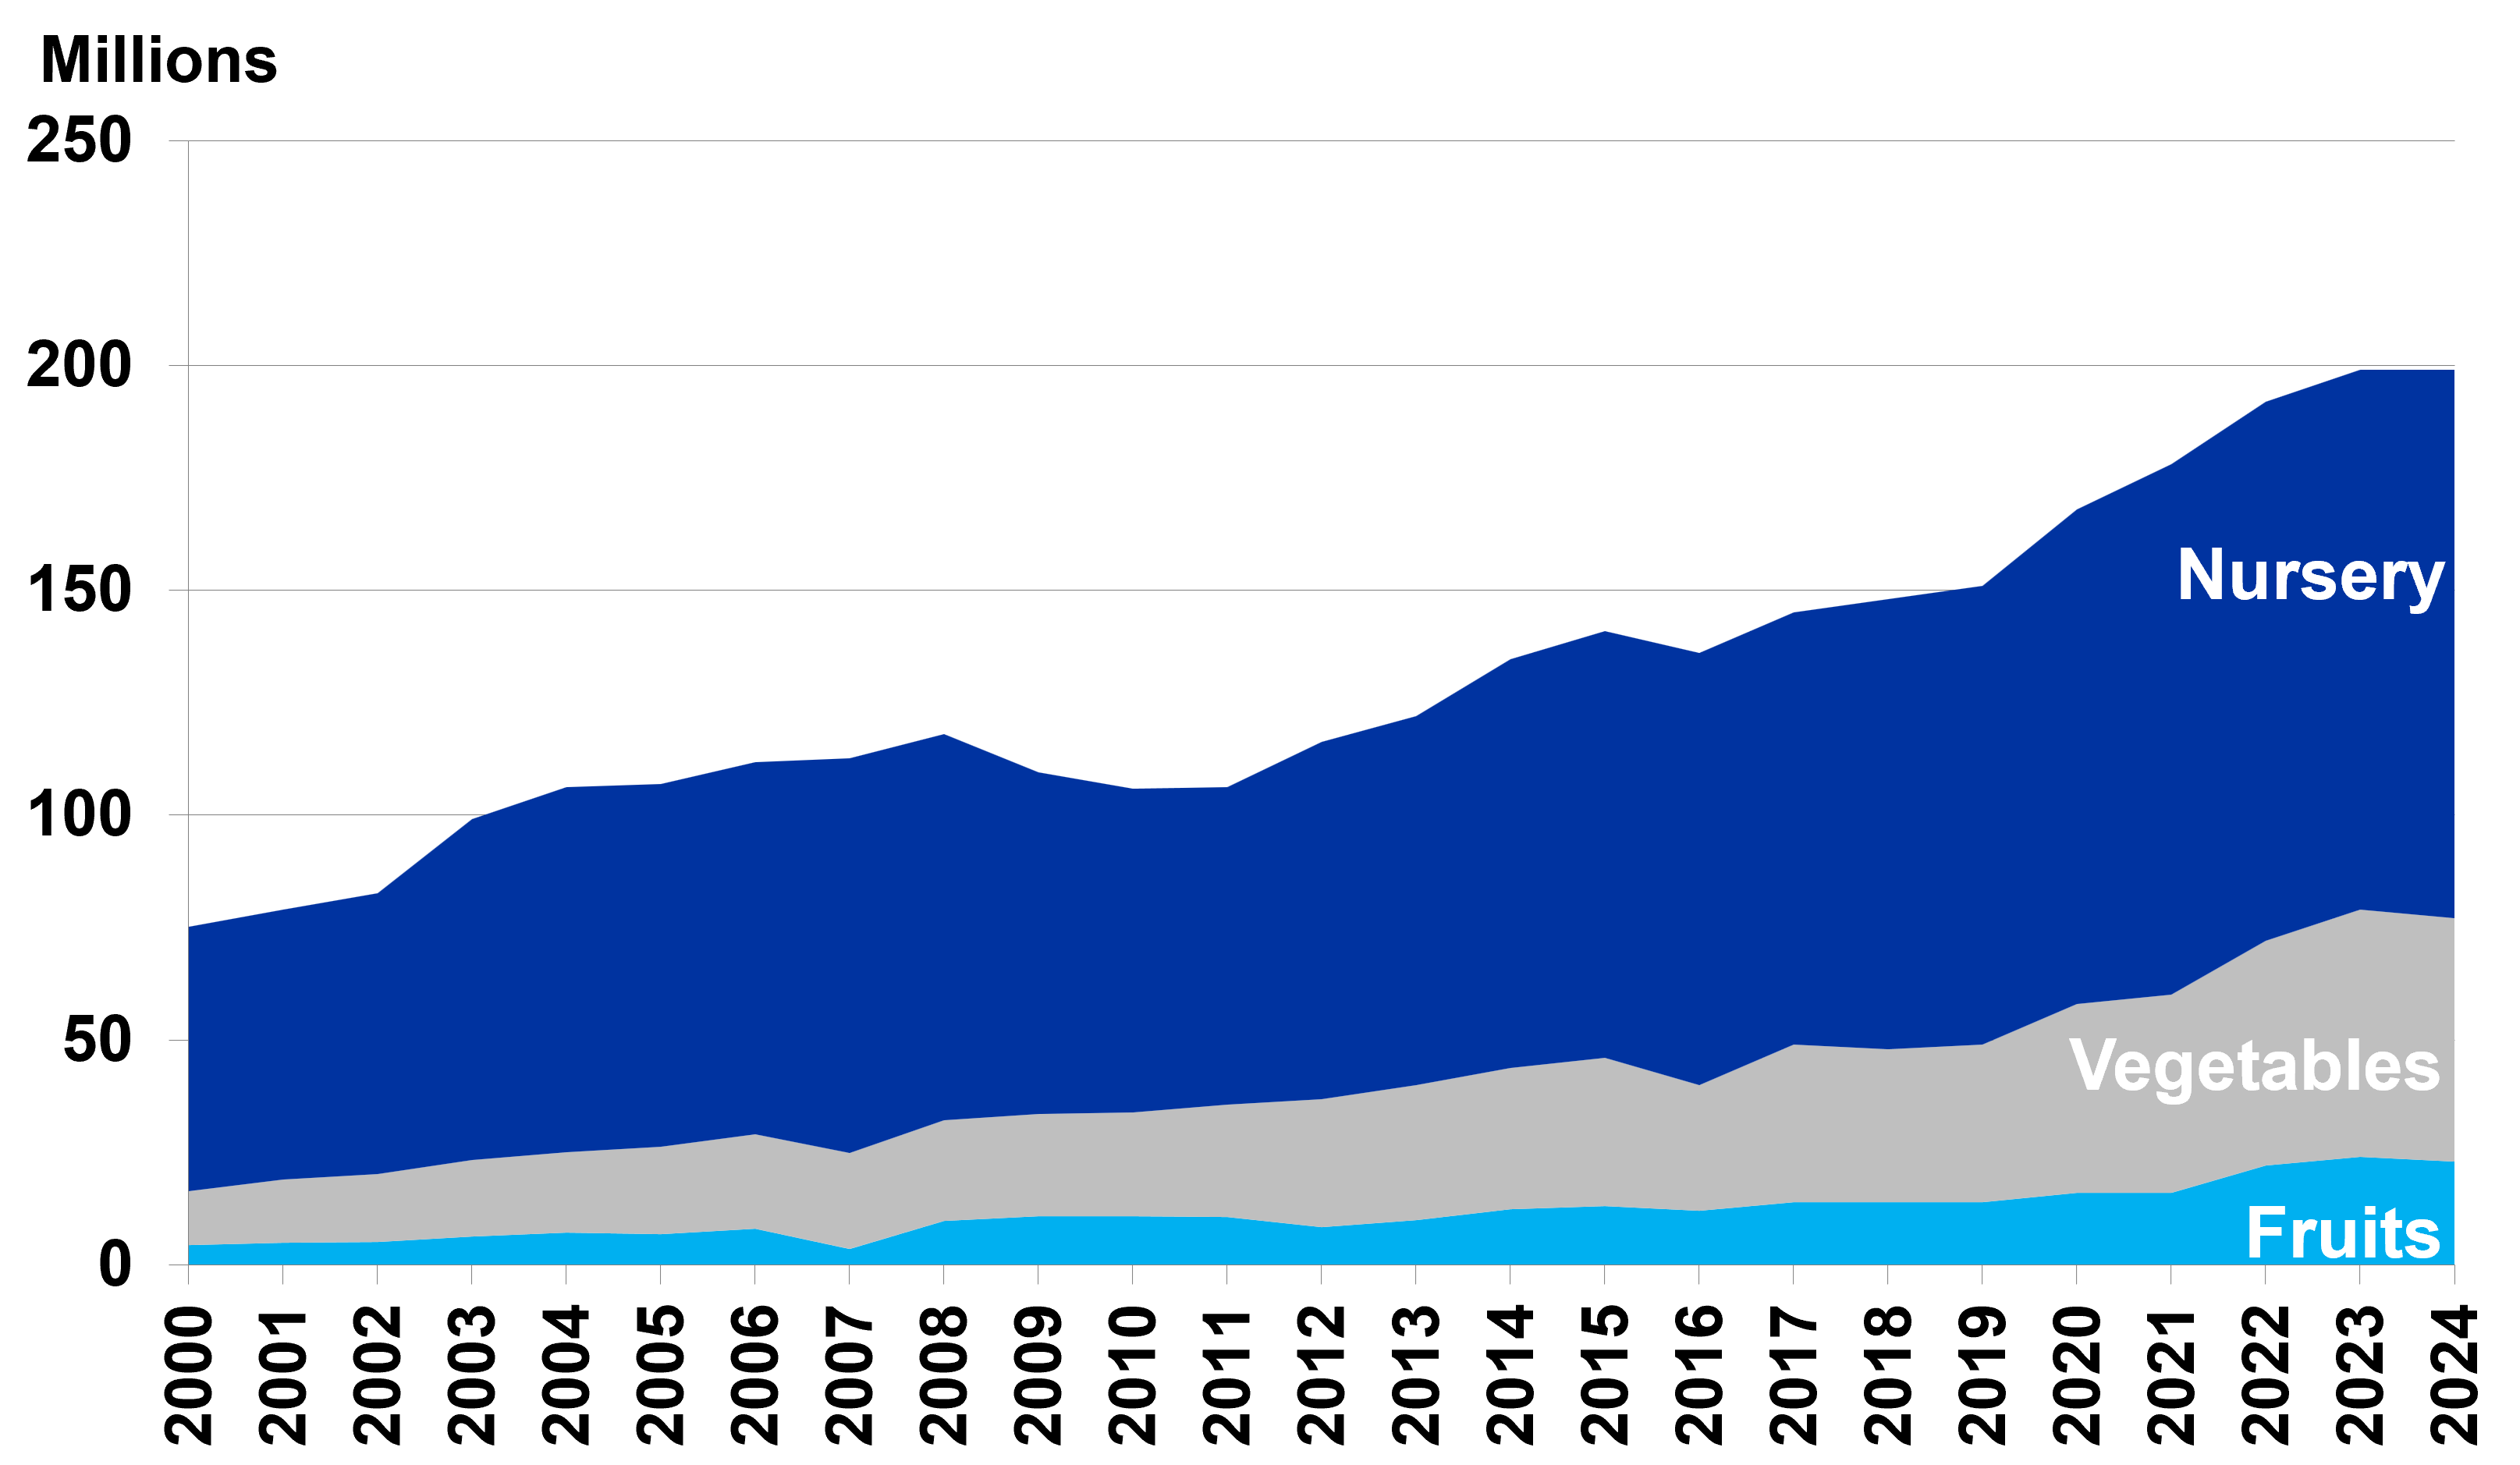
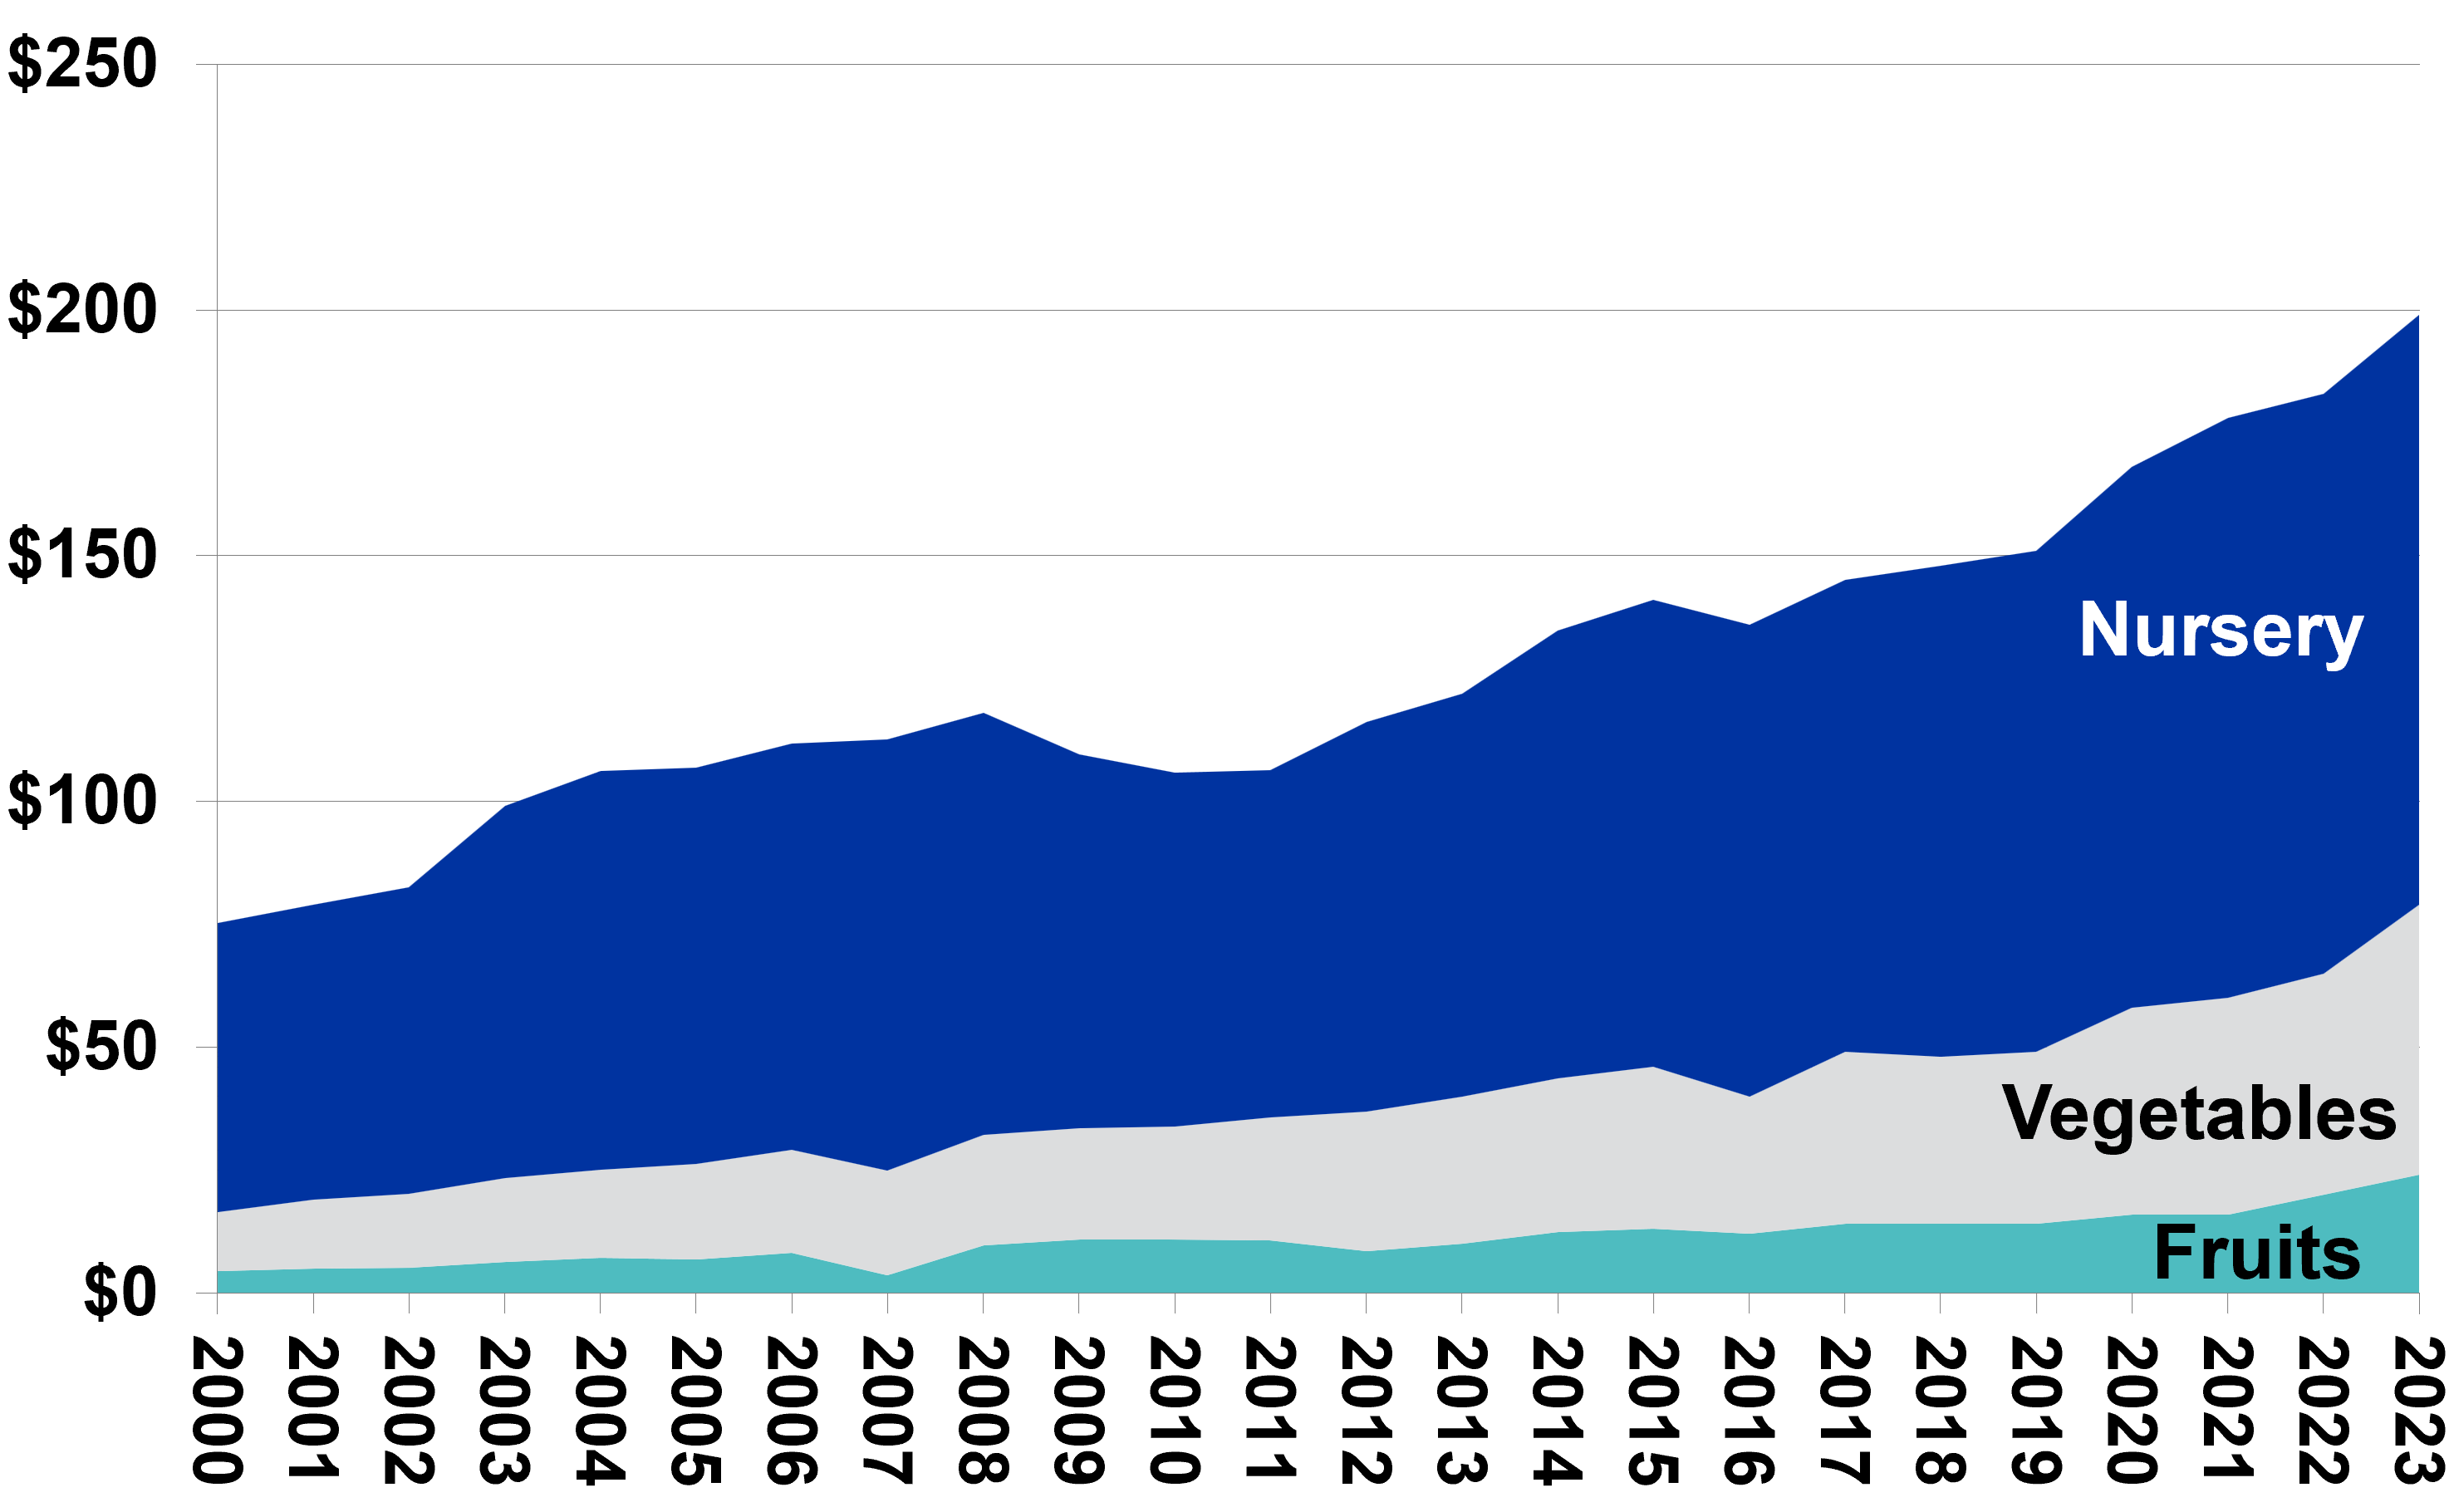
Specialty crop sales overall for 2024 should wind up at or above record levels of $200 million in Kentucky. A challenging growing season for open-field production was countered by continued strong demand in local and retail markets. Produce auction sales appear to be on pace to see modest overall growth. Direct market channels, especially important to Kentucky specialty crop producers, have all seen substantial and steady expansion over the past five years – farm markets, agritourism/on-farm retail, and community supported ag programs, as well as farm-to-institution, and food banks.
Fruit ($23 million) and vegetable ($54 million) cash receipts for Kentucky are estimated at $77 million, which does not include additional sales through controlled environment greenhouses and vertical farms. Those could add an additional $20-40 million in additional revenues based on historical sales.
The nursery and ornamental sector in Kentucky continues to ride the coattails of strong national markets. Although housing starts and interest rates may have slowed some of the commercial and wholesale installation demand, Kentucky leans heavily on sales through retail garden centers. This industry has been generating approximately $120 million in farm gate cash receipts and, with strong retail emphasis, will reflect the strong profitability reported by nursery and garden centers nationally.
Future markets for Kentucky will continue to be shaped by local growing conditions and local/regional demand. Labor costs continue to rise, including H2A rates ($15.87 in 2025, up 4.8% from 2024). But a stronger economy, including expected lower interest rates, will help the Kentucky industry to grow overall. Uncertainty about tariffs, extremely important to produce, remains, with the expectation that such policies will strengthen market opportunities in the short run.
Kentucky Produce& Nursery Cash Receipts
The forest sector is experiencing significant issues across the eastern U.S., especially in the hardwood region that encompasses Kentucky. While there are a few species and commodities where prices have remained relatively stable in 2024 the majority have decreased in value. Continued inflation, lack of movement in new home construction, and fears over future demand have resulted in a number of mills closing, the latter including the second largest mill located in eastern Kentucky. These closings and the overall decrease in demand for hardwood products has resulted in a reduction in the forest sectors economic contribution to Kentucky. While the total industry contribution is estimated to stay above $18 billion, direct contributions dropped from $13.9 billion last year to $12.3 billion this year. However, this down-trend was not evenly distributed across sub-sectors with primary and secondary industries and wood residues experiencing significant decreases. Pulp and paper and paper converters saw only minor reductions. There is also significant concern within the industry over the fragility of the logging sector including a work force shortage. This concern is because the majority of the forest industries require a consistent supply of wood from Kentucky’s forests that the logging sector provides. To address the work force issue, forestry partners in Kentucky are instituting a “ForestryWorks” program aimed at introducing high school students to forest industries to help bolster the work force, but this shortage will be one that continues to plague the industry for some time. Another indicator of the down-trend in the forest sector is the value contributed by an acre of harvested timber. Last year and acre of harvested timber yielded a total of $22,308 dollars to Kentucky’s economy, this year the value fell to $19,468. Log and lumber prices have remained low throughout the majority of 2024 compared to the highs experienced in 2021 and the first half of 2022. Examples are red oak logs, gaining 2 to 3 percent in value year to year in 2024, but are 30% less than 2021/22, or yellow-poplar losing 11% in value this year but are 36% lower than 2021/22. Even white oak and black walnut, that are experiencing historically high prices, have still lost value since 2021/22. Industry sources indicate significant softening of demand in the fourth quarter of 2024 that is expected to continue into 2025. Unfortunately, this does not bode well for harvesting, stumpage values, and landowners needing to sell timber. However, there is stability in pricing for some commodities. The price of tie logs overall has remained constant through 2024 with the losses in non-oak tie log prices balanced by and similar increase in oak tie log prices. While white oak stave logs, used for whiskey barrel production fell $15% in 2024 from a high of $2,700 per thousand board feet in the first quarter of 2023, the average price of stave logs in Kentucky is still above the $1,800 value of 2022 and 2023. Stave and tie log demand and prices should remain flat in 2025. However, there is significant concern that a continued down-trend in prices for species other than white oak will continue well into 2025. Continued soft markets for species other than white oak are to be expected and could easily be exasperated by trade wars and wood tariffs. The current soft pricing of a number of timber products, high cost of parts and supplies, flat or down-trending housing starts and global trade and economic concerns have the potential to do long-term harm to the regions logging capacity that cannot be easily or quickly repaired. A decrease in logging capacity and lower timber values also can harm the economic viability of Kentucky’s forests, 80% of which are non-industrial family ownerships, and the landowner’s ability to conduct valuable forest management practices.
Income Implications for Kentucky Farms and Farm Households
Farm profitability and current outlooks have strong implications for Kentucky farms and families. Data from commercial grain farms participating in the Kentucky Farm Business Management program (KFBM) to illustrate the impacts.
The key to a farm’s long-term financial survival is profitability. Profitability affects the farm’s ability to secure and service debt for operation, replacement, and ownership. It also provides income for the families that operate the farms.
Agricultural profitability has always been cyclical. The current cycle began with a recovery for KFBM grain farms beginning in 2017 that peaked in 2021, with a steady decline over the last two years as commodity prices have softened and costs have surged. The downward trend will continue in 2024 and into the foreseeable future.
Two factors have influenced the current cycle: 1) government payments and 2) commodity prices and cost of production.
Unusually large government payments contributed substantially to the recovery from 2017 through 2021. Government payments have been significantly lower since.
By 2021 commodity prices drove gross returns per acre about 43% above 2017 levels. Total costs per acre increased only about 17% during that time, then shot up 23% in 2022. Commodity prices have now begun to decline while costs have continued to rise, resulting in lower Net Farm Income (NFI). As a result, NFI is projected to decline for 2024 toward 2018 levels.
Net Farm Income directly affects farm financial condition by providing the means to meet obligations in long-term and short-term. The farm balance sheet shows the ability of the farm to meet its obligations in the long run (solvency) and to pay principal due in the next 12 months (liquidity).
A Debt-to-Asset Ratio (D/A) of 30% or less is considered good for a commercial crop farm solvency. Strong land values and good management decisions helped the average farm to maintain a D/A ratio under 30% for the last seven years, demonstrating long-term stability.
Liquidity is measured by farm’s ability to more-than-cover the principal due in 12 months. A crop farm should have a minimum 2:1 ratio of unobligated current assets to principal due in 12 months.
The average KFBM farm had about $1.5 million in working capital at the beginning of 2024 and a working capital ratio of 2:21. This was a strong liquidity position, especially given the sharp downturn in profitability. Working capital ratio should remain above 2:1 going into 2025.
Note that all types of liabilities increased in 2023: long term, current, and intermediate. Average current liability was $1.2 million at the beginning of 2024. The increase in liabilities will likely continue into 2025, and is a concerning trend.
Capital Replacement & Term Debt and Replacement Margin reflects how much NFI remains after paying farm expenses, family living, taxes, and debt payments. This is available to make extra debt payments, purchase land or equipment, take out for personal use, or leave invested in the farm. The margin dropped from $348,702 in 2022 to $99,643 at the end of 2023. This sharp decline indicates real challenges in meeting obligations while maintaining operations.
Total family spending reflects the pressure on NFI. KFBM farm families cut spending by 9% compared to 2022, even with rising medical and insurance costs. Cuts were primarily for durable goods, personal vehicles, and other big-ticket personal items.
Expectations for 2024 and beyond:
- Continued decrease in profitability.
- Tighter cash flow, creating competition between liabilities, farming, family living, and balance sheet.
- Challenge to adequately cover obligations in the short-run.

Ag Economic Outlook Archives
2023 Situation
Following an amazing run in 2021 and 2022, the agricultural economy is expected to retreat in 2023. Prices for most major farm commodities were lower in 2023 as the global producers responded to price incentives induced by tight global stocks and trade opportunities. In addition to increased global competition, the U.S. ag economy was adversely affected by slumping exports, interest rate hikes, labor challenges, unfavorable weather patterns impacting crop yields and pasture conditions, along with the volatility caused by ongoing global geopolitical issues.
The lone bright spot in the ag economy in 2023 was cattle markets where farm-level prices soared in response to tight cattle supplies and a resilient beef consumer base even amidst relatively high retail beef prices.
While inflation moderated in the second half of the year, the ag sector continues to be adversely impacted by inflationary pressures on the economy. Despite lower fertilizer and feed expenses, overall farm production expenses were higher in 2023, primarily due to higher interest expenses (with farm loan rates exceeding 8%) and labor costs. In addition, government farm payments receded to pre-trade war/pandemic levels. In aggregate, USDA is forecasting that U.S. net farm income will decline by 17% in 2023, following record-high levels in 2021 and 2022. Despite a significant decline, the projected 2023 U.S. net farm income level adjusted for inflation will still be the fourth-highest real net farm income realized in the past 75 years.
A significant portion of the growth in farm income in recent years has been a strong international market for U.S. farm commodities and ag products. However, U.S. ag exports, which generally account for over 20% of U.S. ag production, declined in 2023 in response to a stronger U.S. dollar, a weakening global economy, and rebounding world stocks. The biggest decline occurred in our largest ag export market – China which faces a lot of economic challenges as its economy continues to try to recover from COVID and other financial stressors. The decline in U.S. ag exports, coupled with continued growth in ag imports will likely cause the U.S. ag industry to experience its third trade deficit in the past five years – very uncharacteristic given that the U.S. ag sector historically has recorded relatively large trade surpluses.
The Kentucky agricultural economy has not escaped many of these national macroeconomic issues and trends, but our diverse farm economy, better-than-expected grain yields amidst weather challenges, and carryover grain sales from the 2022 crop helped cushion some of the downfall. As a result, University of Kentucky agricultural economists are projecting that 2023 Kentucky ag cash receipts will decline modestly from its record high level of $8.3 billion in 2023 to $8.1 billion as the significant increase in cattle (+22%) and wheat receipts (+30%) are just slightly offset by lower receipts for corn (-18%), soybeans (-6%), dairy (-15%) and tobacco (-10%). Poultry will likely remain Kentucky’s number one commodity in terms of cash receipts, but strong cattle prices vaulted cattle receipts over corn, soybeans, and equine receipts in 2023. Similar to national trends, production expenses will be higher for most Kentucky farmers this past year while government payments will fall leading to net farm income for Kentucky agriculture declining in 2023 from record highs of $3.1 billion in 2021 and $3.9 billion in 2022. While the outcomes will vary across enterprises and farmers, overall net farm income adjusted for inflation for Kentucky this past year is expected to remain above the $2.5 billion average recorded over the past ten years.
Exhibit 1: U.S. Net Farm Income
Source: USDA-ERS, December 2023 Estimates
Exhibit 2: Kentucky Farm Cash Receipts
Source: KY Ag States/USDA-NASS, UK Ag Economics Estimates for 2023
2024 Outlook
Looking ahead to 2024, commodity prices, except for cattle, will continue to face headwinds amidst global competition, higher stock levels, and a slowing global economy. Despite challenges, Kentucky ag cash receipts may still remain above $8 billion on the heels of expanding livestock receipts and anticipated stable crop receipts. While inflation has eased in recent months, the current macroeconomic environment does not indicate that interest rates will likely fall dramatically in the coming year. Labor costs will continue to rise as the H2A wage rate is bumped up 6% to $15.14 per hour. Feed and fertilizer costs have moderated from recent highs, but remain above historical levels. Despite political drama in DC, we will have some sort of farm bill in place, but one that will likely deliver very little changes in price/income protection leading to lower government payments with conservation funding being the wild card. After trending up the past few years, the value of the dollar could soften some in 2024 if the Federal Reserve begins to ease its recent restrictive monetary policy. However, a slowing global economy along with export market competition will continue to challenge U.S. ag export growth.
Collectively, lower/stable crop prices, intense export competition, higher interest and labor expenses, and limited government payments will challenge potentially higher livestock receipts in the coming year. Even accounting for narrowing profit margins, the ag balance sheet remains relatively strong heading into 2024. Ag loan portfolios have benefited in recent years from the ability of farmers to utilize excess cash to pay for operating expenses, land, and equipment holding down increasing debt levels. However, higher interest rates and the depletion of cash/working capital in a lower net farm income environment may cause lenders to be more cautious in the coming year in evaluating loans. Despite these economic challenges, the farm economy outlook remains relatively positive heading into 2024. However, as usual, extreme/unpredictable weather events and uncertain geopolitical actions could quickly disrupt markets and forecasts emphasizing the need to incorporate various risk management tools to counter potential market volatility.
Exhibit 3: Distribution of Projected 2023 Kentucky Ag Cash Receipts
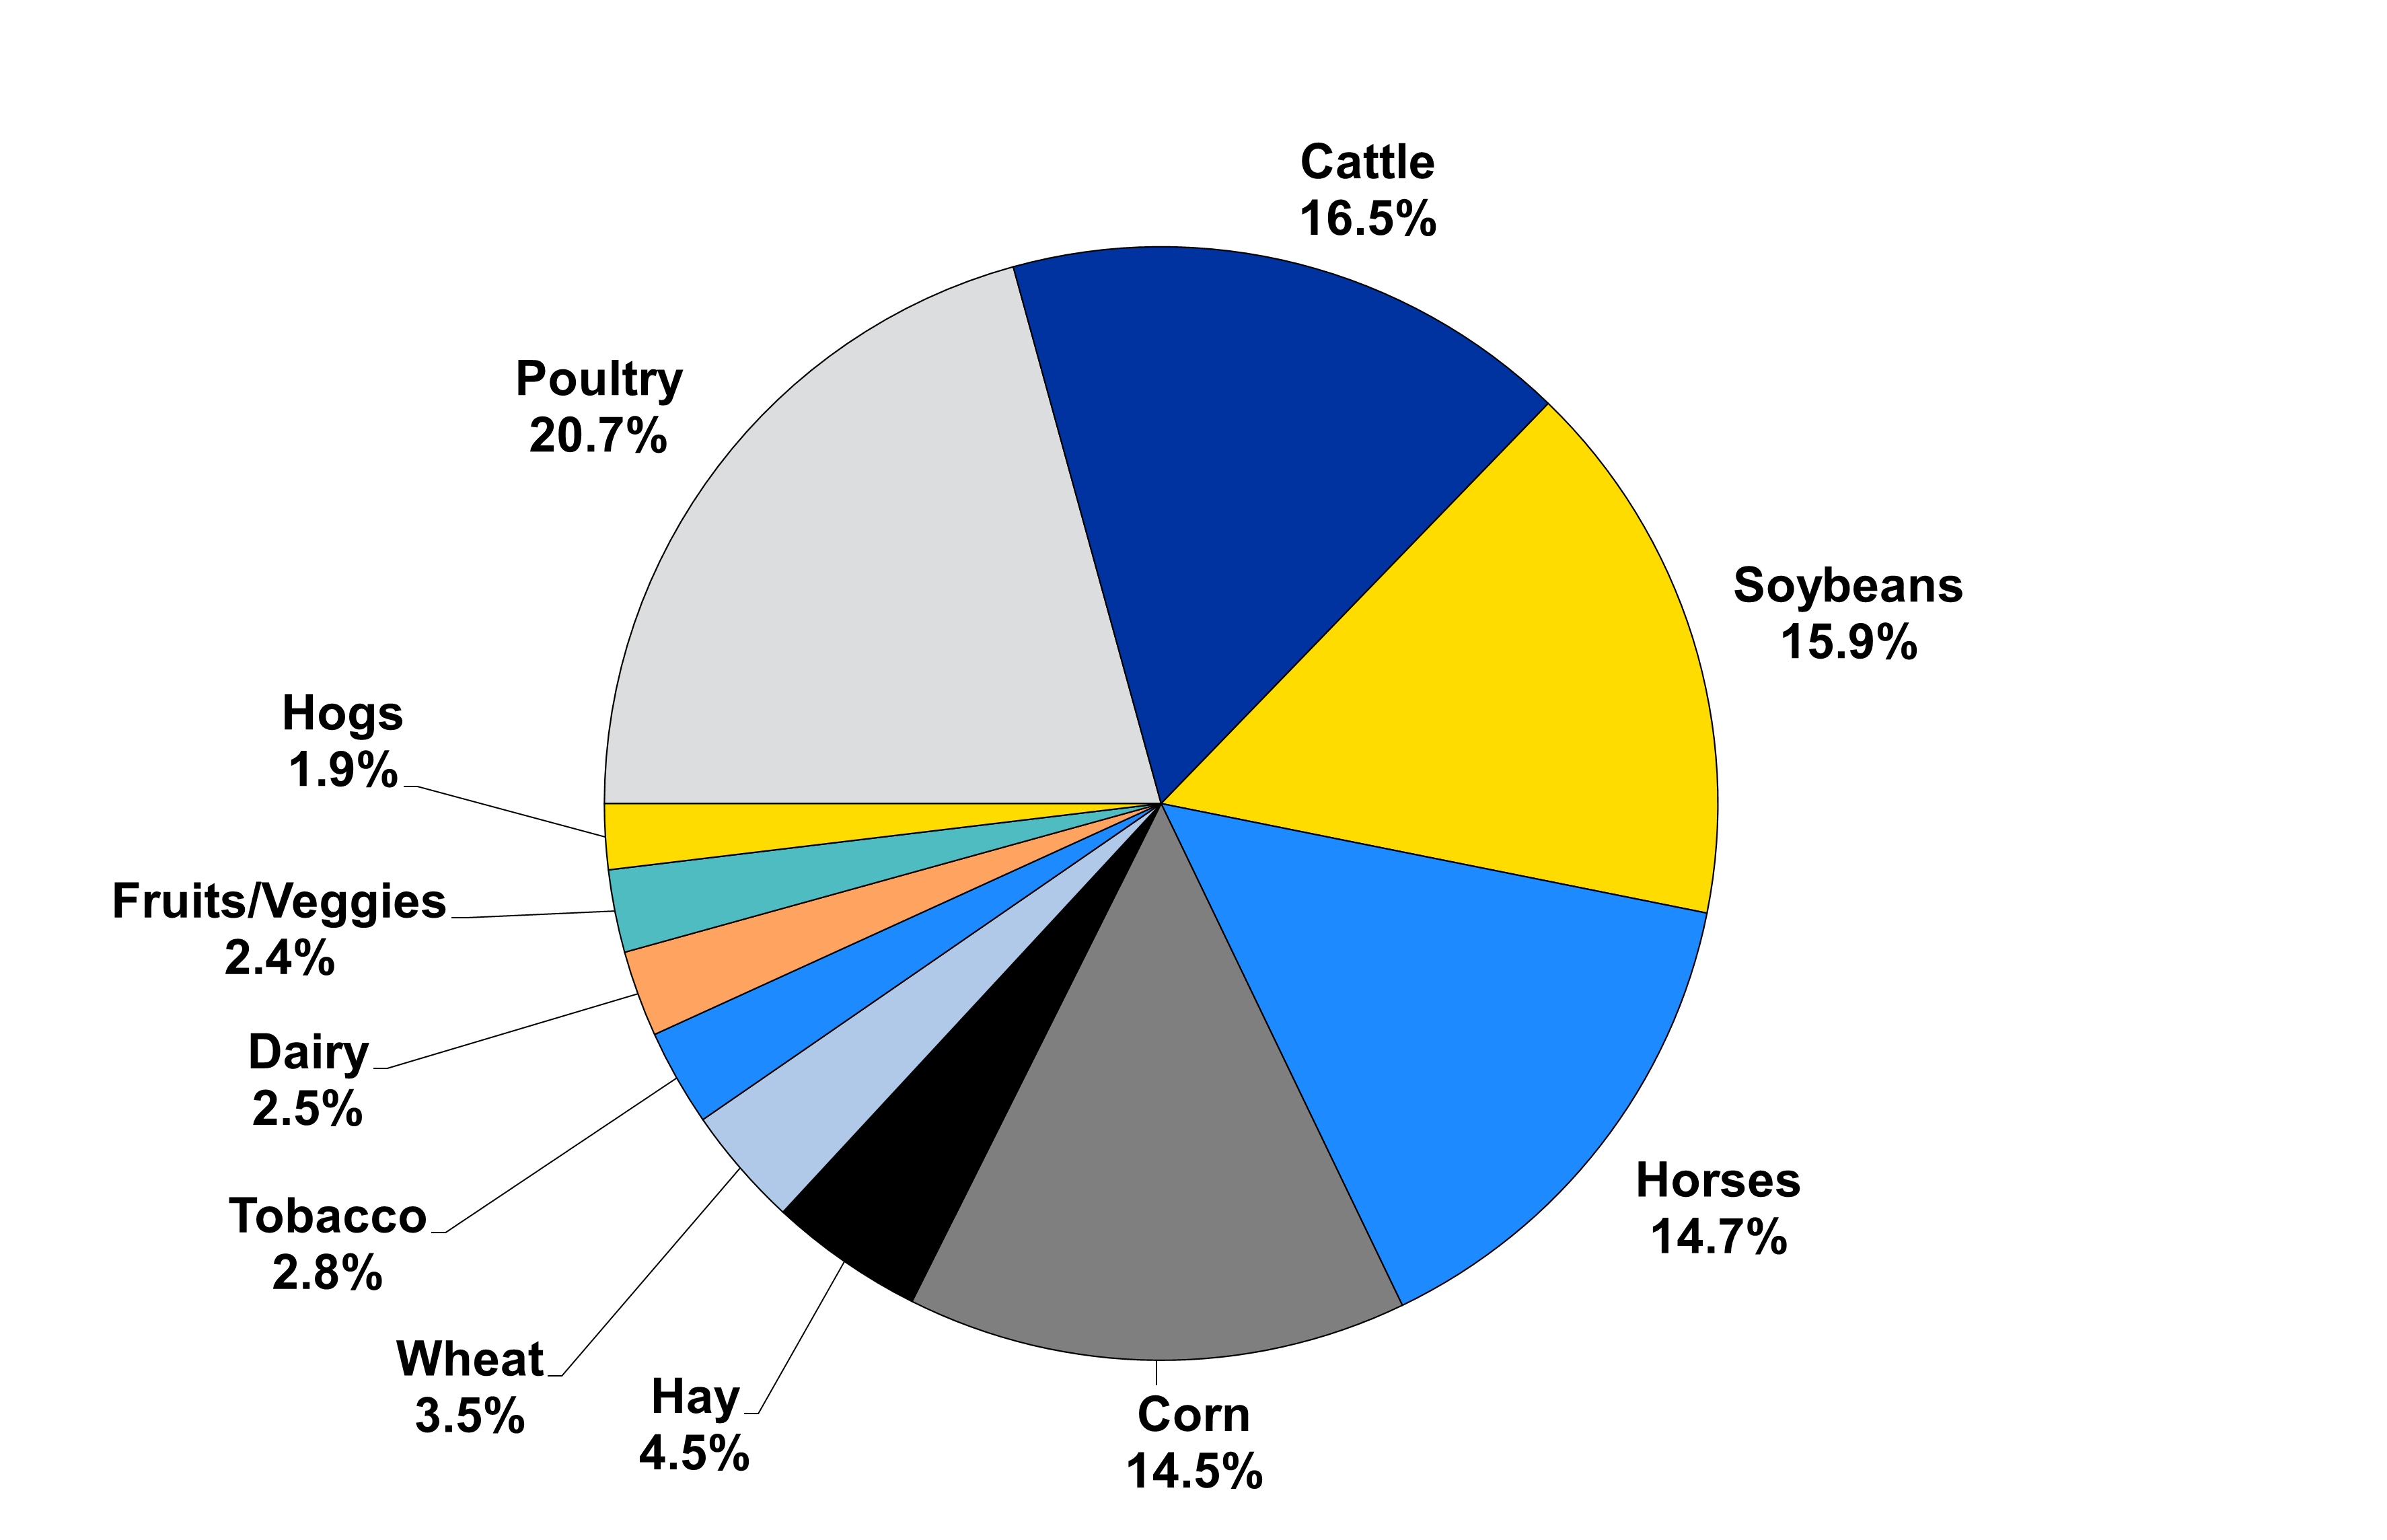
Source: K Agricultural Economics, December 2023 Estimates
2023 Situation
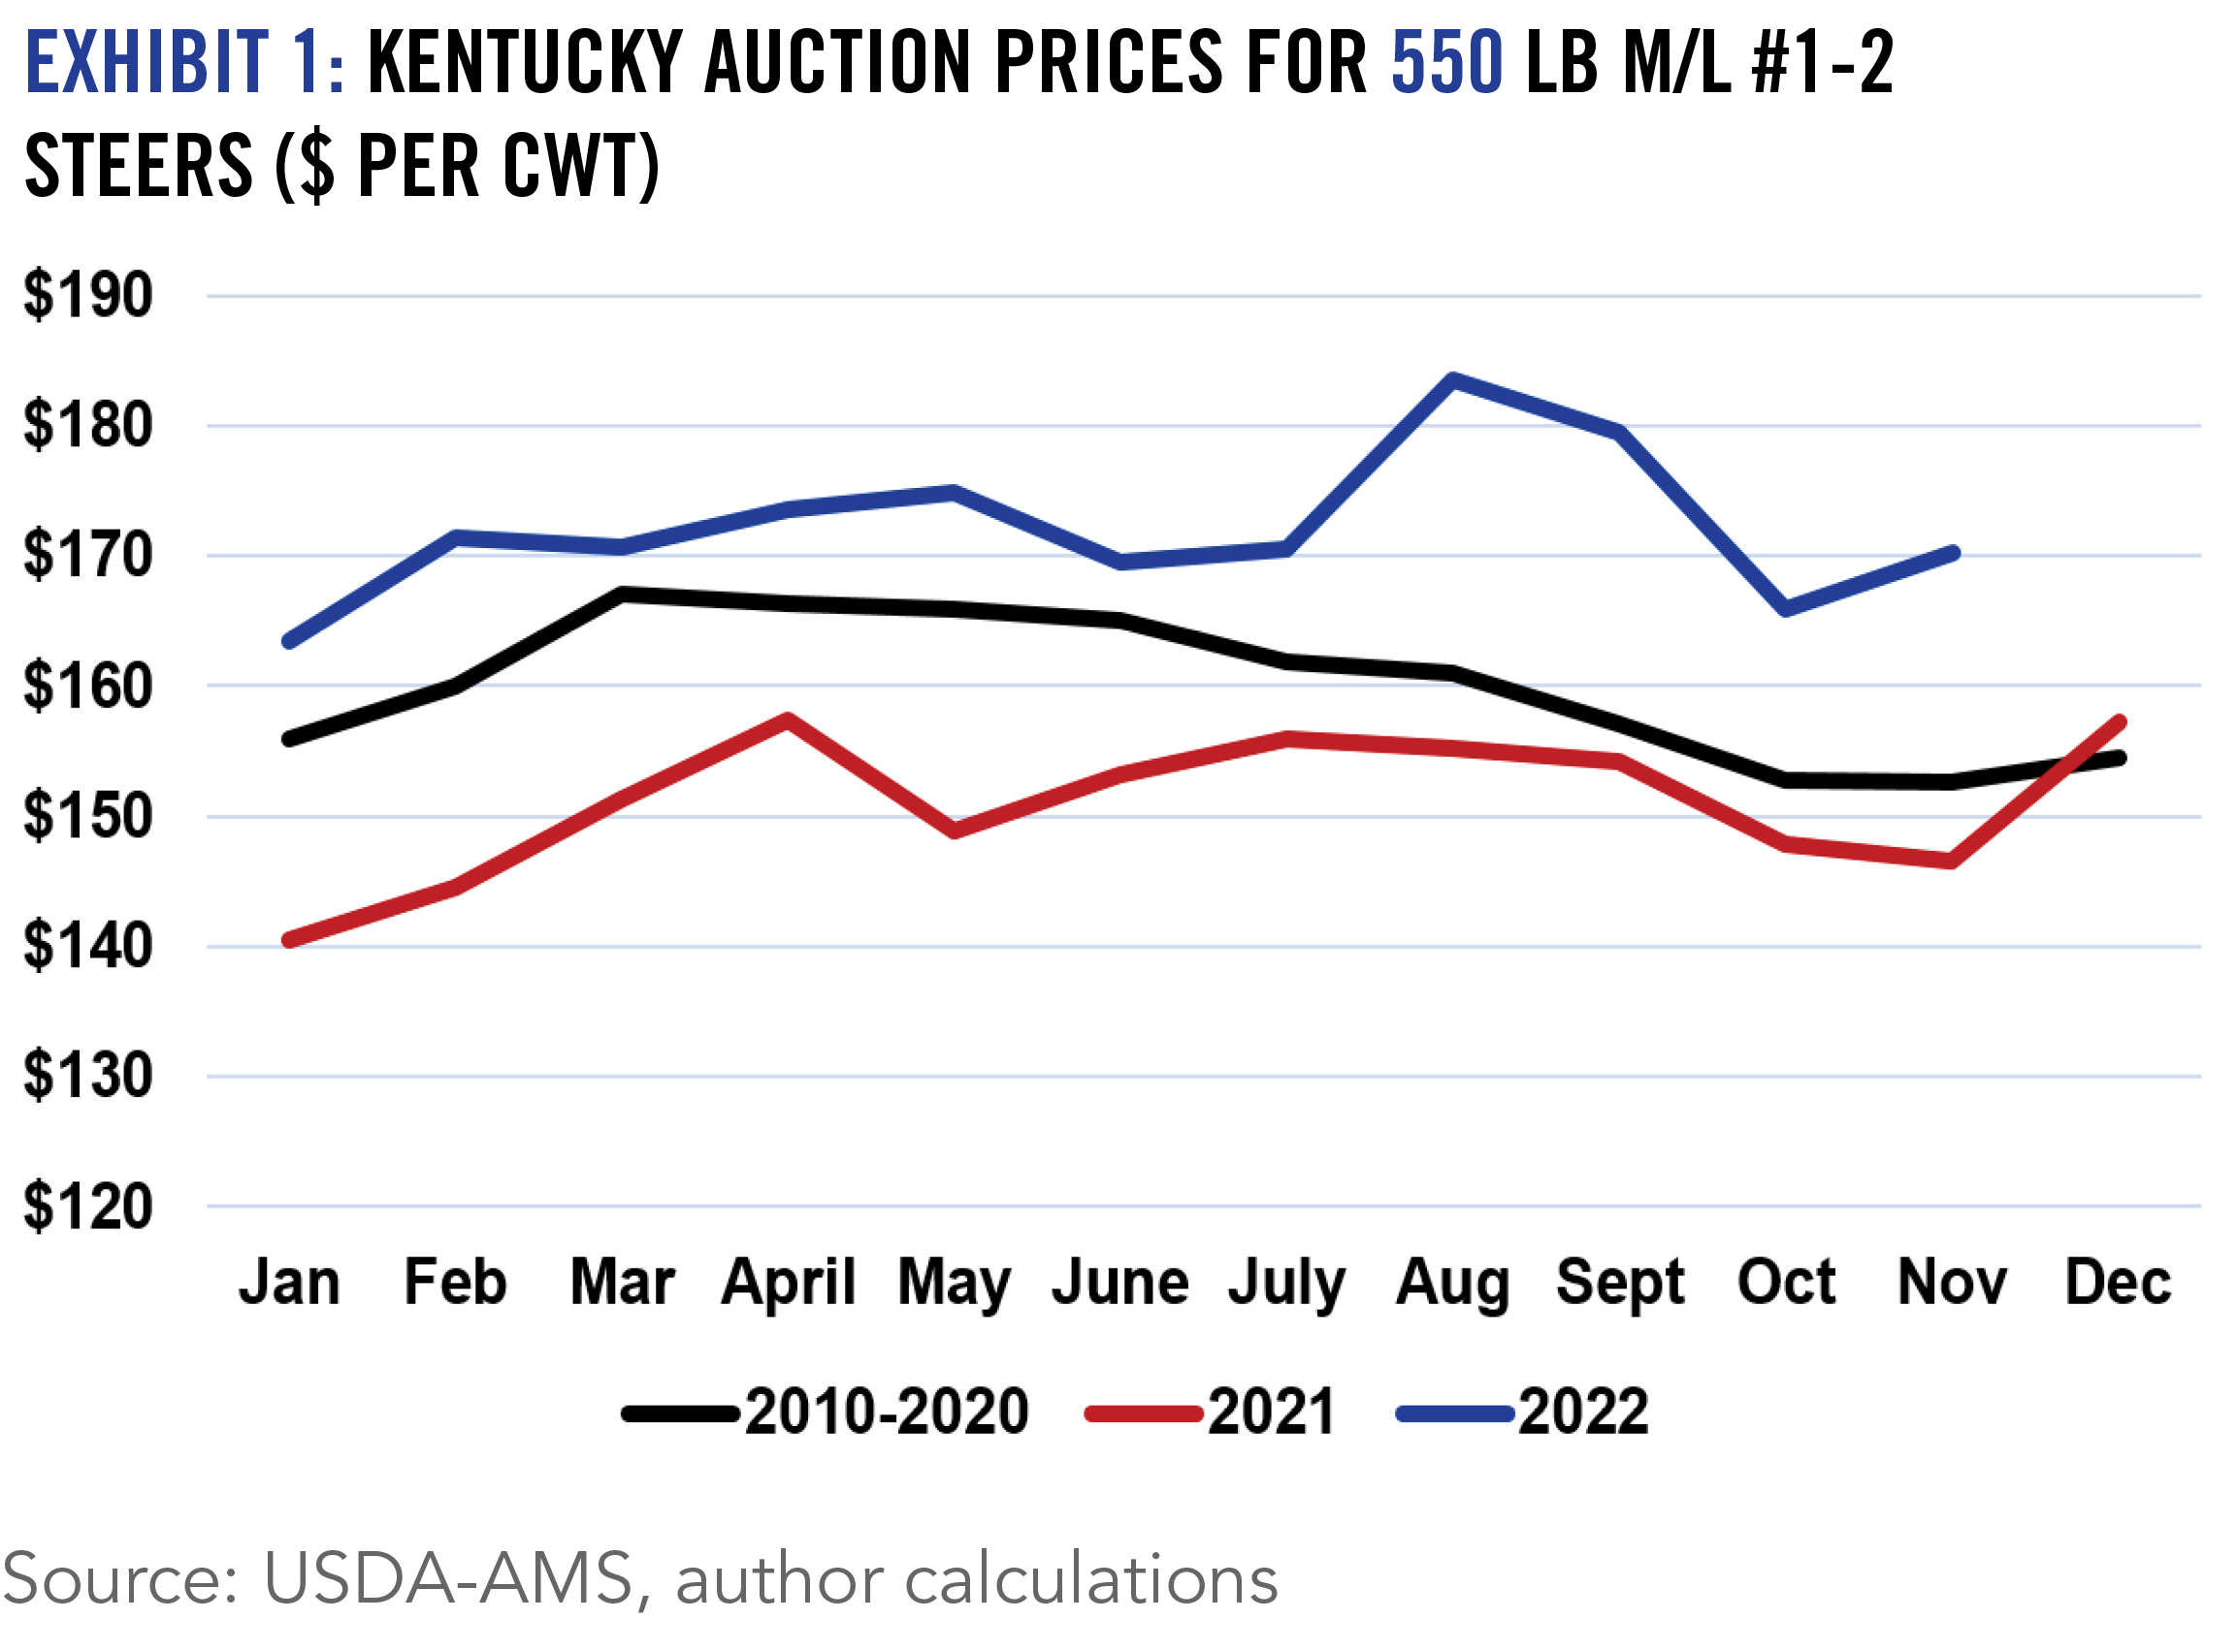
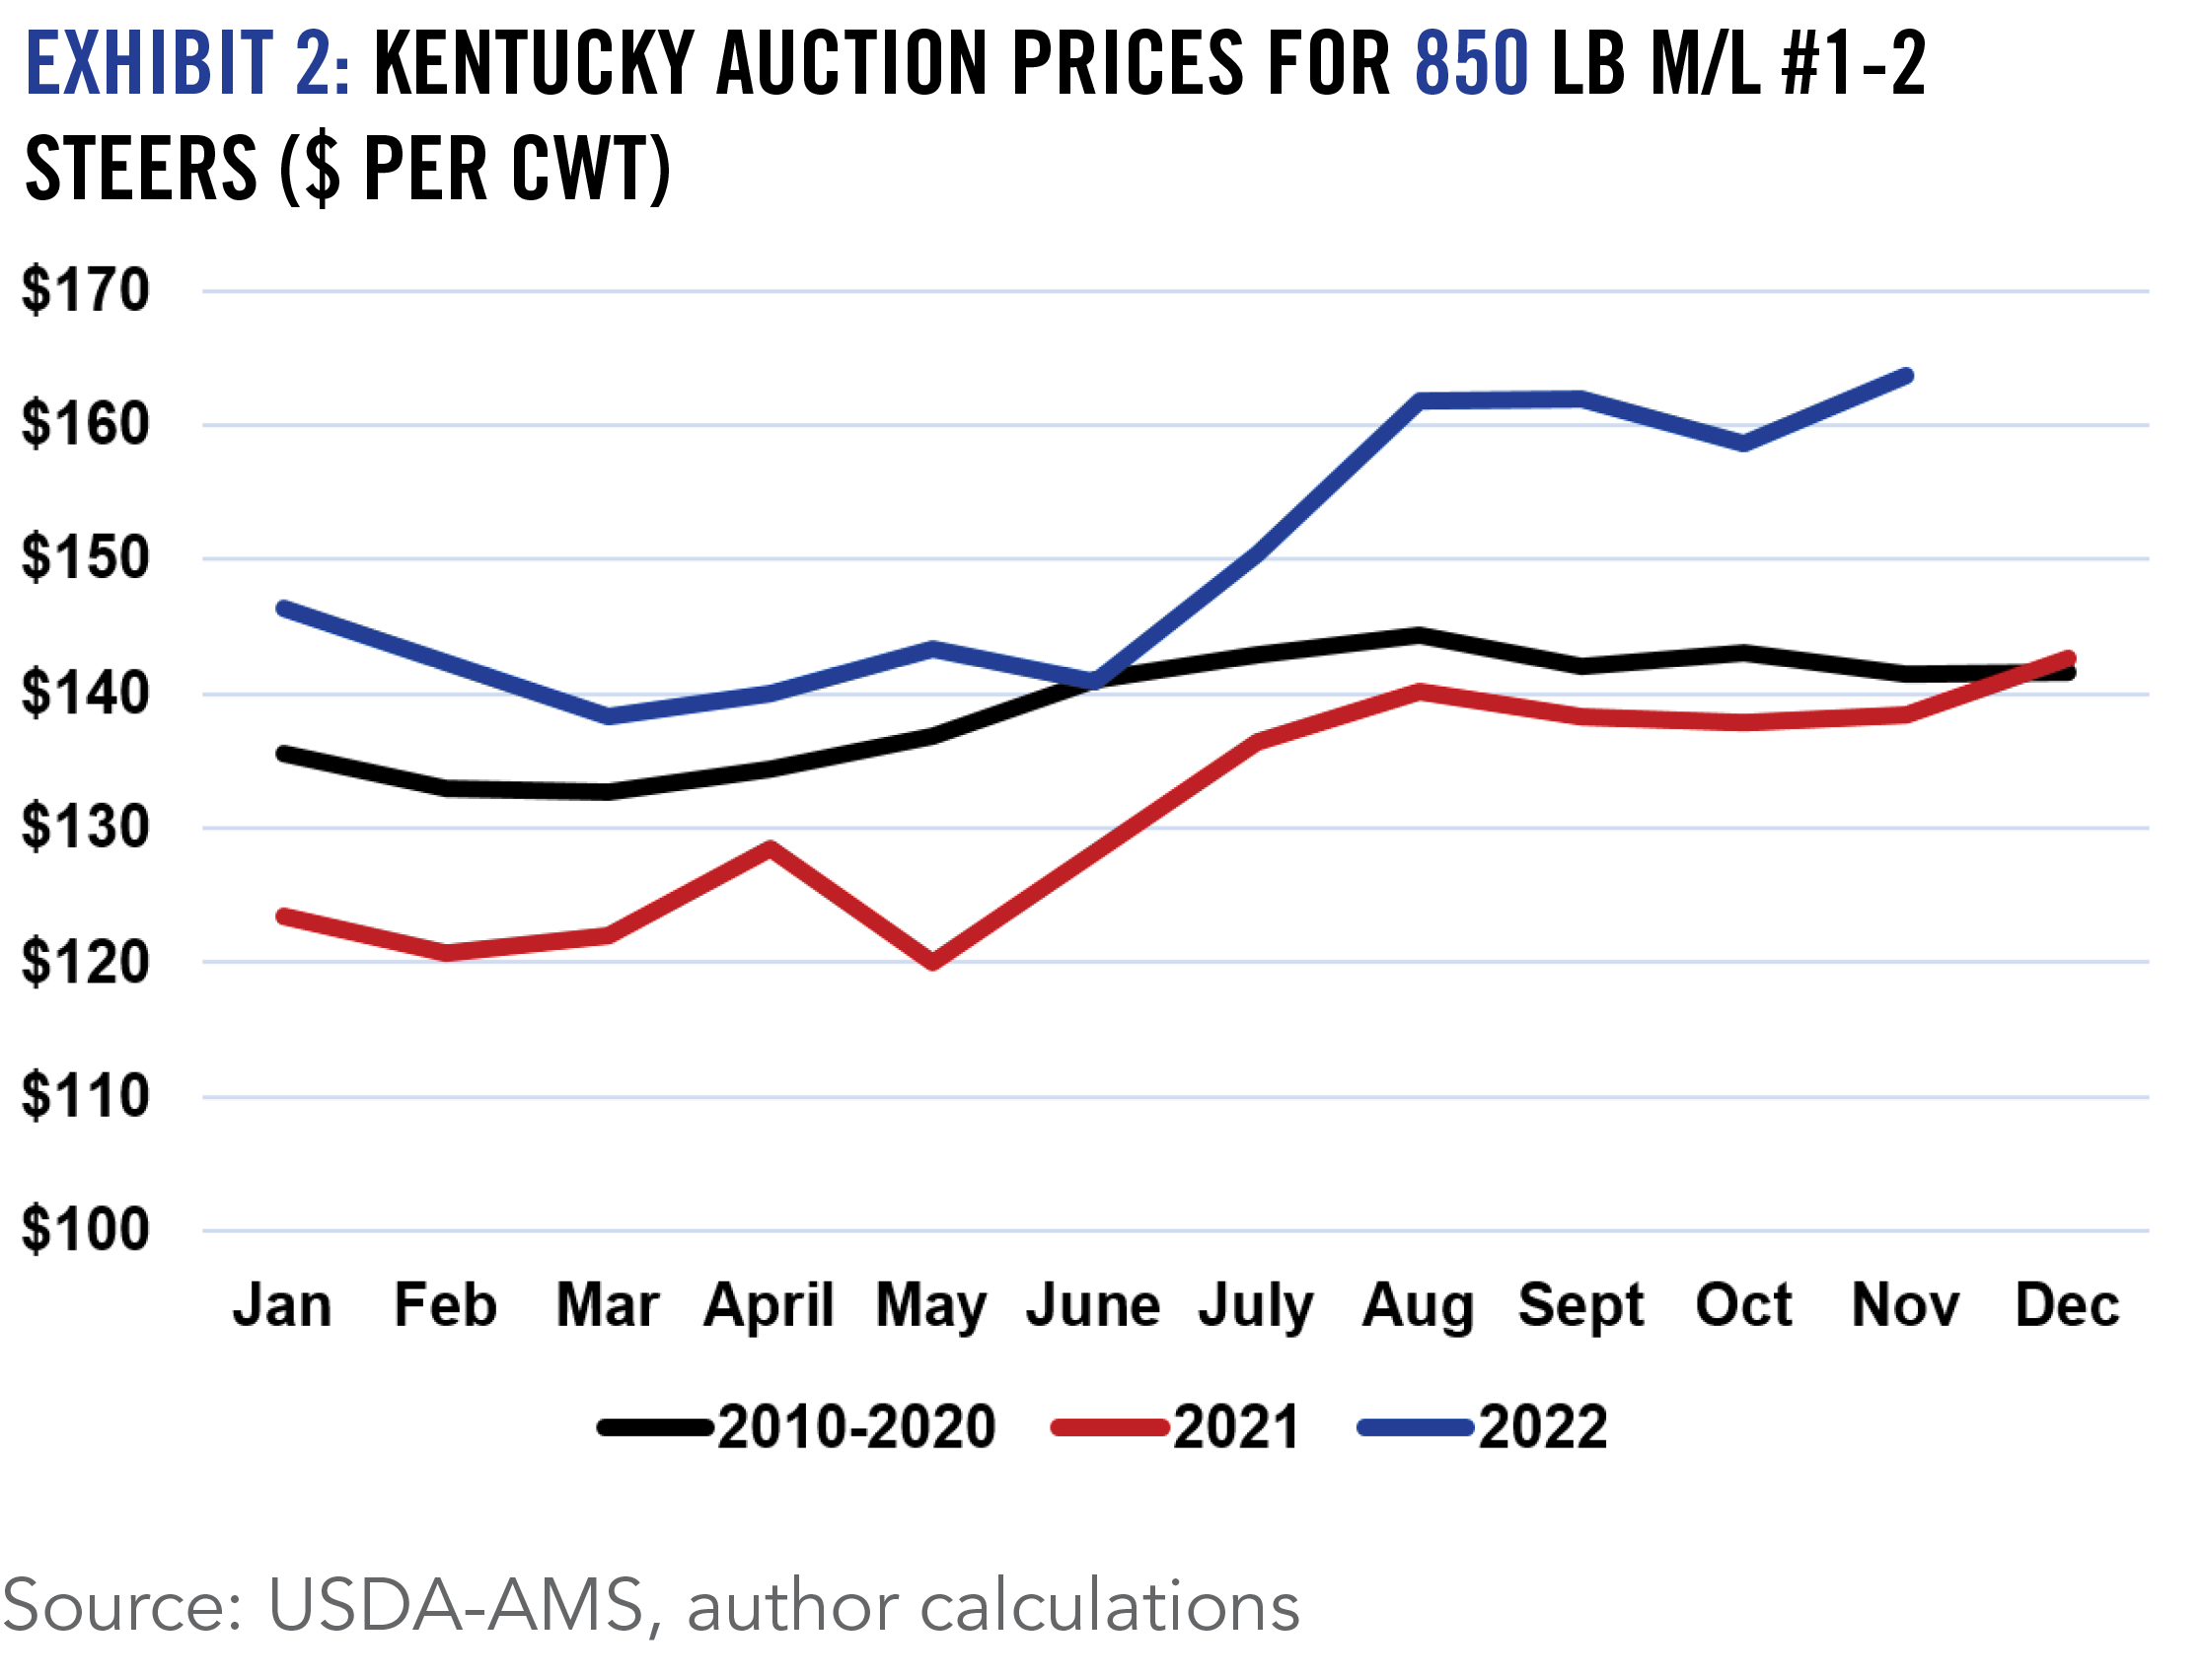
We came into 2023 with the smallest beef cow herd on record in over sixty years. At the same time, US beef production saw its first year-over-year decline since 2015 and will be down nearly 5% for the year. Tight supplies were the story for the vast majority of the year and were reflected in feeder cattle and calf prices. Beginning in mid-September, futures market prices saw major declines that persisted into December. The drops were driven by a combination of markets moving too high, too quickly over the summer and larger than expected fall feedlot placements. While cash feeder cattle prices were impacted, they did not drop as drastically as the futures market did. Despite the fall market frustration, both calf and heavy feeder prices averaged $40-$60 per cwt higher than 2022, as can be seen in the charts below.
Exhibit 1: Kentucky Auction Prices for 550 lb M/L #1-2 Steers ($ per cwt)
Source: USDA-AMS, author calculations
Exhibit 2: Kentucky Auction Prices for 850 lb M/L #1-2 Steers ($ per cwt)
Source: USDA-AMS, author calculations
2024 Outlook
Dry weather in much of Kentucky during 2023 impacted hay supplies and prices going into 2024. Despite relatively high calf prices, there is no indication that cattle producers have started to expand. Cow slaughter and heifers on feed point to another year of contraction. The 2024 cow herd will likely be more than 2% smaller than 2023, which means feeder cattle supplies will only get tighter. While inflation, interest rates, and macroeconomic questions have the potential to impact the market, supply fundamentals should support cattle prices such that calf prices increase again year-over-year. While cow-calf operators are typically the primary beneficiaries of tight cattle supplies, the outlook for margin operators is also encouraging. Feed prices have moderated somewhat from last year, but the value of gain should remain relatively high, creating opportunity for stocker and backgrounding operations. One lesson of fall 2023 was how quickly markets can swing, so price risk management should be a component of marketing plans.
2023 Situation
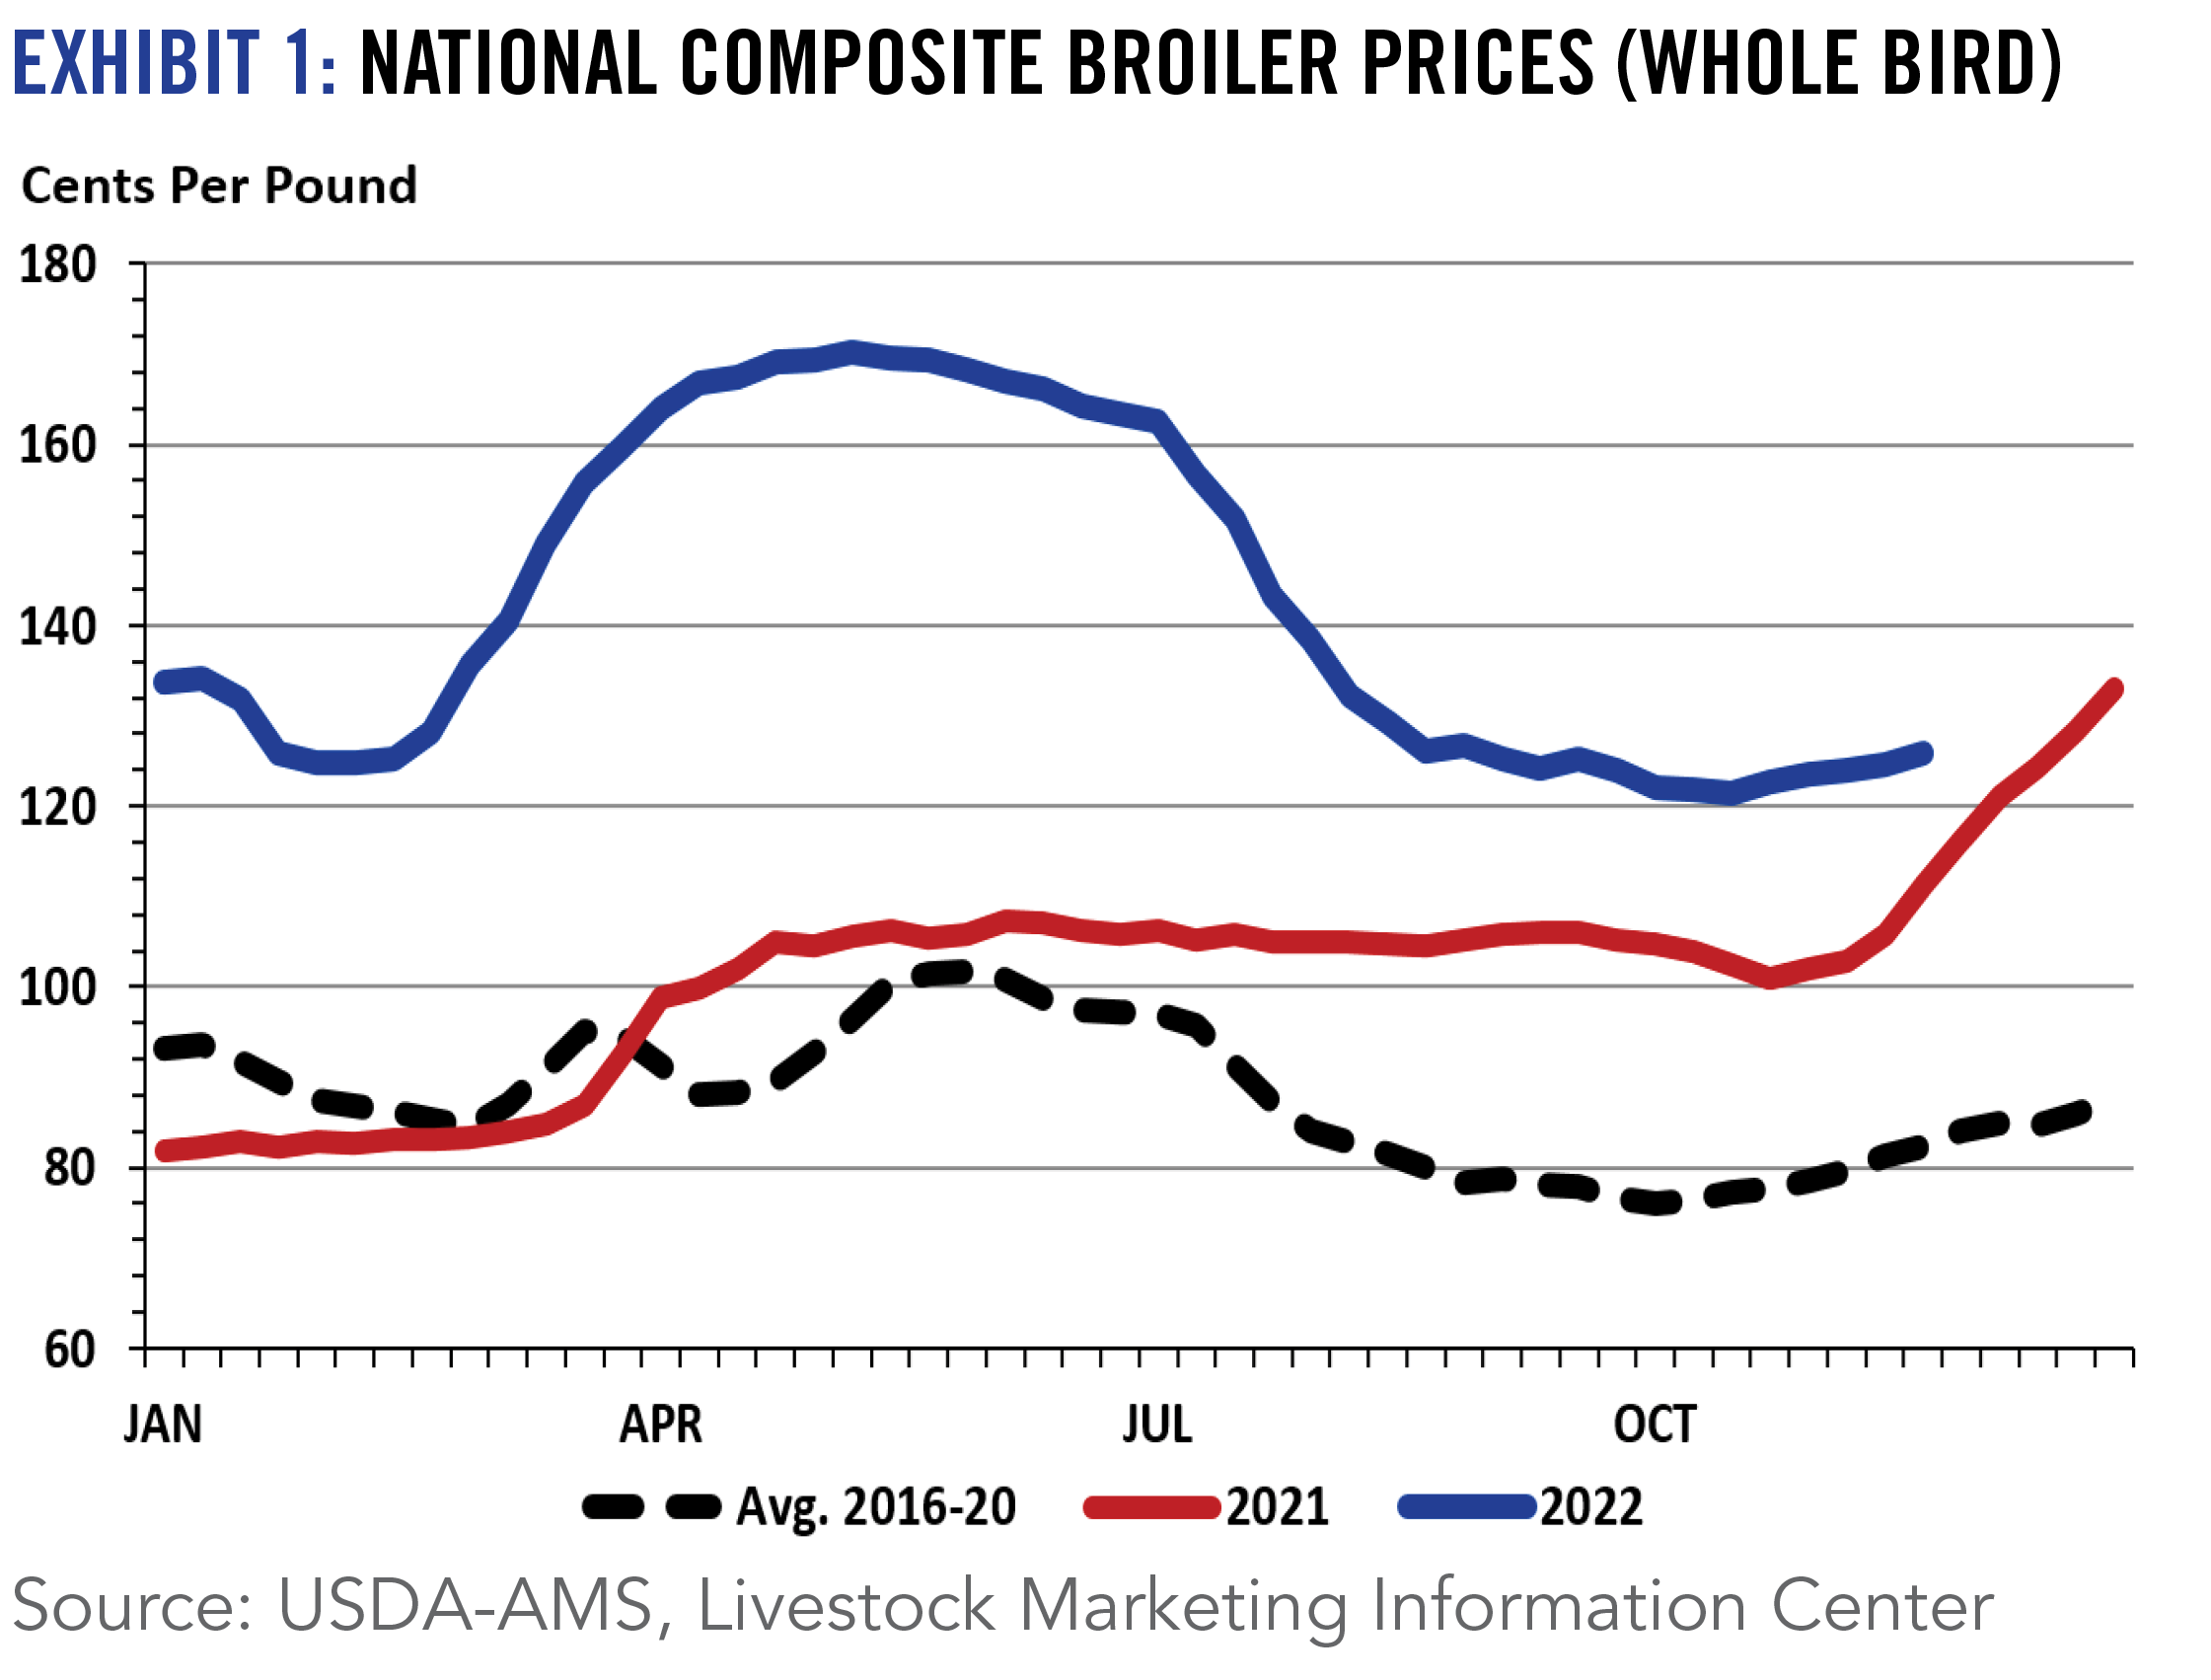
Kentucky poultry production will be higher in 2023 as post-tornado impacts were at play in early 2022. However, out times remain an issue for growers, as do operating costs. The two largest poultry narratives centered around plant closures and Avian Influenza (AI) this year. The announced closure of the Tyson plant in Corydon, Indiana impacts more than 20 growers in Kentucky and the future of those operations is certainly in flux. At the same time, a significant increase in cases of AI was seen in the fall across the U.S. As of early December, a case had not been confirmed in Kentucky, but the situation should be monitored. At the national level, broiler production is expected to be up by less than one percent in 2023 and broiler prices are down by roughly 13% from last year.
Exhibit 1: National Composite Broiler Prices (Whole Bird)
Source: USDA-AMS, Livestock Marketing Information Center
2024 Outlook
While feed costs have trended lower, labor challenges continue to impact integrators. It is very possible that this was a major factor behind the closure of the Corydon, IN Tyson plant and certainly bears watching going forward as additional plant closures would significantly impact the industry. Construction and material costs, combined with much higher interest rates, are creating entry challenges for growers into the poultry sector and those upgrading existing operations. While the sector remains stable, significant growth seems unlikely. The recent increase in cases of AI serves as a crucial reminder that growers need to manage that risk to the extent possible and the December 2021 tornado drives home the linkage between infrastructure, markets, and grower profits.
2023 Situation
After two solid years in the hog sector, things shifted drastically in 2023 as farrow-to-finish margins turned negative. The lone bright spot in the hog markets has been exports, which have been higher in 2023, despite the fact that China has continued to import less pork from the U.S. The increased export levels seen in the pork market are counter to what has generally been seen in other protein markets and Mexico has been a major driver of this export strength. Closer to home, Kentucky came into 2023 with a steady breeding hog inventory and larger market hog numbers. Eastern corn belt hog prices fell by 15% when compared to 2022, which was only partially offset by cheaper feed.
Exhibit 1: Direct Eastern Corn Belt Hog Prices - Market Formula ($ per cwt carcass weight basis)
Source: USDA-AMS, USDA-NASS, author calculations
2024 Outlook
Productivity gains continue to be a double-edged sword for the industry. Gains in pigs per litter are a major reason why USDA-ERS is predicting nearly a 2% increase in pork production next year. Hopefully, continued export strength can keep increases in per capita availability at a minimum. Kentucky’s hog sector is a healthy mix of independent and contract-integrated operations and both segments of the market are impacted by different things. For independents, margins should improve in 2024, but that is most likely to be driven by lower feed prices. Indications are that growth is continuing among integrated operations, but construction costs and interest rates are having an impact there as well.
2023 Situation
Following two years of post-Covid improvement, equine markets seemed to cool somewhat in 2023. After sizable year-over-year increases in 2021 (+38%) and 2022 (+13%), Keeneland sales revenues were down by 6% in 2023, in part due to a 3.6% decline in the number sold. While the pullback is significant, perspective is likely valuable as the sales levels of 2023 are still the second highest annual sales level since 2007 (second only to 2022). While the number of mares bred in North America continued to decline, Kentucky actually bucked the national trend and saw an increase in the number of mares bred in 2023 (The Jockey Club). Stud fees paid on these mares are another significant contributor to equine receipts in the Commonwealth.
Exhibit 1: Annual Keeneland Sales, 2000-2023
Source: Keeneland
2024 Outlook
Despite the decrease in sales for 2023, the equine sector remains relatively strong. Gaming revenues from historical horse racing continue to impact purses, which has the potential to impact sales and stud fees. It is unclear how broader sports betting in Kentucky may impact this going forward but it certainly bears watching. It will also be interesting to watch how inflationary pressure impacts equine markets, especially the non-racing markets. Despite the 1.6% increase in number of mares bred in Kentucky during 2023, it is difficult to forecast another increase for 2024. And one would have to expect stud feeds to flatten, at best, for the upcoming year. An expectation of steady equine receipt levels in Kentucky would seem most likely for 2024.
The most recent Kentucky Equine Survey was released in the summer of 2023 and provides a comprehensive look at Kentucky’s equine sector and its impact on the state.
2023 Situation
Coming off a reasonably good year for the dairy sector in 2022, Kentucky came into 2023 with slightly more dairy cows than last year. This was the first statewide increase since the 1980’s. Unfortunately, the values of cheese, non-dry milk, and whey pulled farm-level milk prices lower. U.S. all milk price decreased by $4-5 per cwt in 2023 and Dairy Margin Coverage (DMC) margins reached levels this summer not seen since 2012. By fall, farm-level milk prices showed some improvement and were accompanied by decreases in feed costs. Still, dairy cow numbers have been decreasing at the national level since the spring of 2023.
Exhibit 1: U.S. All Milk Price vs. DMC Feed Cost ($ per cwt)
Source: USDA-AMS, USDA-NASS, author calculations
2024 Outlook
While the dairy herd should enter 2024 a bit smaller than last year, this will likely be largely offset by productivity increases. The second half of 2023 provided some optimism that dairy product prices will improve going forward and USDA-ERS is projecting an increase in dairy exports. This should be somewhat supportive of prices and producers will further benefit from lower feed costs. Profitability challenges will continue to be felt by smaller-scale dairies, which make up a significant portion of Kentucky’s dairy sector. Dairy producers should continue to utilize the DMC program and other risk management tools available to them.
2023 Situation
A record year of U.S. corn production widened the gap in supply and demand, pushing corn prices down close to $1.40 per bushel in 2023. For example, the 2023 December corn futures were around $6.00/bu on December 1, 2022, and $4.60/bu on December 1, 2023. Thankfully, volatility throughout the marketing year offered ample opportunities for producers to lock in higher prices. Harvest time futures were above $6.20 in June due to weather conditions, which caused a supply scare in major production states like Indiana, Illinois, and Iowa.
2023 was an atypical year, as corn prices mostly trended downward, correcting for a tight stock and high price situation that has lingered since COVID. The marketing year typically runs September-September, and we generally expect prices to increase until June or July when end-users and elevators start accounting for the next season’s crop. Kentucky producers likely faired the drop in prices better than other states, as 2023 yields were much higher than the lower drought-induced yields of 2022.
Exhibit 1: Corn Supply and Demand by Marketing Year
Source: USDA Feed Grains Yearbook
2024 Outlook
As we move into 2024, I expect corn prices to return to typical cyclicality, meaning prices should increase as the marketing year progresses. Questions remain on the demand side of the equation, especially concerning export markets. Brazil surpassed the United States as the world’s largest corn exporter in 2023, and the United States will need to make up for the lost demand in 2024 to induce a meaningful increase in corn prices. Of late, China has avoided U.S. corn exports, but as prices have dropped, the United States’ export price is on par with Brazil’s. Next year’s corn supply will also have a large impact on prices. If soybeans follow corn on all the U.S. acres planted in corn in 2023, we could easily be in another tight stock situation in 2024; however, I do not expect this to occur as fertilizer prices have lowered dramatically, incentivizing corn. Current harvest time futures are above $5.00, a lower but profitable corn price.
Exhibit 2: Monthly Export Price by Country
Source:FAO FPMA Tool
2023 Situation
Near-record corn planting led to the lowest soybean supply since 2019. 2024 January corn futures began the year close to $14.00 and followed the downward trajectory of corn to nearly $11.40 before the June/July weather scares. Unlike corn, which quickly declined in price after the scare, soybeans stayed relatively high due to the small U.S. projected production and relatively strong exports. Since June, soybean futures have mostly been above $13.00, indicating multiple opportunities for producers to lock in $13.80/bu beans in 2023.
Due to tight supplies, soybean prices were highly volatile in 2023. Adding to this pressure, Argentina, a major contributor of soybeans, has been reported to be out of beans after a poor production year. Tight stocks have led to continually elevated prices since June instead of prices falling in June/July as expected.
2024 Outlook
Soybean prices still look strong in 2024 due to projected U.S. crush expansion and smaller stocks. Unlike corn, we have not seen a widening gap in supply and demand post-COVID. I expect soybean prices to stay elevated but highly volatile for years. Between 2023 and 2026, soybean crush capacity is expected to increase by over 500 million bushels. Questions remain on whether supply and demand will meet capacity, but the U.S. will likely need soybean expansion as we look to the future. I do not see a surplus of beans on the horizon unless most of the 2023 corn acres are planted to soybeans in 2024. Harvest time futures prices are close to $12.75, a lower but profitable soybean price.
Exhibit 1: Soybean Supply and Demand by Marketing Year with Projected Crush Expansion (Bushels/Year)
2023 Situation
Russia’s invasion of Ukraine pushed the wheat price to a record level and pressed U.S. wheat supplies to new levels in 2023. Supply outpaced demand by nearly 60 million bushels, driving the 2023 December SRW wheat futures contract from close to $8.20 on December 1, 2022, to $5.60 on December 1, 2023, a decline in price of nearly $2.60. Thankfully, futures shot above $7.60 in June and July due to a weather scare combined with geopolitical tensions, specifically the cancellation of the “Black Seas Grain Deal.” These price movements likely allowed some marketers to lock-in higher than higher-than-average wheat prices.
2023 wheat markets experienced price movements that were similar but more volatile than those of corn markets. Short price spikes due to geopolitical tensions gave ample marketing opportunities to lock in prices before the winter wheat harvest. Since the winter wheat harvest, prices have remained low.
Exhibit 1: Wheat Supply and Demand by Marketing Year (Bushels/Year)
Source: USDA Wheat Data
2024 Outlook
U.S. wheat prices are dictated more by world supplies than U.S. corn or soybean prices, and thus, the declining stocks held by major exporters add price volatility to wheat markets. Geopolitical tensions between Russia, the largest wheat exporter, and Ukraine, the seventh largest export since 2019, exacerbate these effects. As prices return to normal levels, capturing volatile price spikes will become increasingly important for the U.S. producer. Harvest time futures are still profitable at close to $6.00, but producers should pay attention to short-term increases to maximize profitability. From a supply perspective, the large number of corn acres in 2023 primes producers for double-crop wheat/soybeans. Production could increase in Kentucky, a key double-crop state, but I look for similar numbers nationally due to current pricing mechanisms.
2023 Situation
Kentucky’s tobacco sector continues to contract amidst declining consumer demand for tobacco products, international competition, and labor/yield challenges adversely impacting profit margins. The situation and outlook have reversed among tobacco types.
While U.S. burley use continues to fall amidst an accelerating decline in domestic cigarette sales, and import leaf substitution, burley growers were encouraged to grow more pounds in 2023 with increased contract volume offers coupled with higher contract price incentives. However, increased burley acres planted did not materialize (off 3%). Overall U.S. burley demand may have been around 70 million pounds, but it is likely that the 2023 crop will not total much more than 50-55 million pounds. Accounting for all the additional price adjustments, U.S. burley prices for the 2023 crop may average around $2.40 - $2.50/lb, compared to $2.21/lb in 2022.
Given the demand challenges facing burley, Kentucky’s dark tobacco sector has been the bright spot over the past decade as snuff sales increased and growers faced virtually no international competition. The situation has reversed as competition in the form of product competition has unfolded for the dark tobacco sector with nicotine pouches (which do not use dark tobacco) cutting into the snuff market (the primary use of dark tobacco). Consequently, dark tobacco contract volume was reduced significantly in 2023 with acreage harvested down by more than 20%. In addition, the 2023 dark tobacco crop was hurt dramatically by excessive rain leading to very poor yields and quality. As a result, the value of the Kentucky tobacco crop (burley + dark) may just barely exceed $200 million in 2023 compared to averaging around $250 million in recent years.
Exhibit 1: Value of Kentucky Tobacco Production
Source: USDA, UK Projections for 2023
2024 Outlook
U.S./Kentucky burley growers will once again have an opportunity to grow more pounds in 2024 given extremely tight global burley supplies. However, acreage responses will hinge critically on contract prices offered for the 2024 crop. U.S./Kentucky dark tobacco growers are expected to experience additional cuts in contract volume as the nicotine market adjusts to a changing consumer base. Wage rates for the labor-intensive crop are expected to surpass $15.00/hour which will continue to challenge profit margins at existing yields. Profit opportunities for cattle and grains may also impact the number of tobacco growers remaining in the industry. Consequently, the value of the 2024 Kentucky crop may be challenged to surpass much above $200 million unless price incentives are significantly higher, and growers experience a much better growing/curing season compared to this past year.
2023 Situation
Input costs remained up sharply during 2023 for most specialty crops, especially labor, pesticides, and capital items. Strong local retail markets helped strengthen demand and prices for both produce and nursery/greenhouse crops. Some significant business failures associated with controlled environment production were experienced, however, the scale of production remains significant and, despite the difficulties of transition, sales continue to expand significantly. Farm gate cash receipts for fruit are estimated at $24 million, vegetables at $55 million, and nursery and greenhouse crops at $120 million – all at or near record levels of sales for Kentucky. Controlled environment greenhouse production will contribute another $30-$50 million above that level.
Exhibit 1: Kentucky Produce & Nursey Cash Receipts
2024 Outlook
Strong competitive pressures will continue from outside of the U.S. in the produce market, challenging many of the wholesale market outlets for Kentucky farms. While Kentucky growers benefit from strong local demand, and strong local prices may remain in direct markets, import supply will continue to rise. Labor costs are a big constraint in this sector, accounting generally for 30-40% of production costs for most produce. Labor cost projections for 2024 are sharply higher and will put pressure on grower margins. New capital-intensive greenhouses and vertical farming systems continue to expand in Kentucky, primarily with a view toward regional wholesale markets.
The outlook for 2024 in Kentucky will continue to hinge on strong local demand for specialty crops as markets for many specialty crops trend downward nationally. Recovering restaurants and other wholesale channels, including the produce auctions, will help support continued strong markets in direct-to-consumer platforms. Garden center demand in Kentucky will be expected to keep pace with the strong growth nationally, helping the retail-oriented farms.
2023 Situation
While the overall economic contribution for the forest sector remained steady, approximately $13 billion, for 2023 there were significant discrepancies in market strength among sub-sectors. Lumber prices, to a large extent, drive average timber and log pricing. The last two quarters of 2022 encountered significant downturns in lumber prices across all species, with white and red oak dropping 91% and 106%respectively. Only a portion of these losses were recovered in 2023, for example, white and red oak recovered only 37% and 44%, respectively. Other species responded with modest gains in 2023, but only partially recovering from losses in 2022 with the exception of hard and soft maples that lost over 40% of their value in 2023. The sluggish oak lumber market was also felt in the railway tie log market especially for oak, with oak prices retreating to values paid for non-oak tie logs. Pulpwood demand in eastern Kentucky has suffered with the loss of markets thus further depressing timber markets and limiting forest management opportunities in that region. While western Kentucky pulpwood markets have rebounded since the re-opening of the Wickliffe pulp mill, overall prices are static. In total, the lackluster lumber, tie, and pulpwood markets have led to anemic timber values for woodland owners that have average-quality timber. The one bright spot continues to be white oak stave log prices. While flattening somewhat in 2023 prices have remained relatively high and there continues to be a strong demand to support a seller’s market throughout 2023.
Along with demand issues, overall the forest sector is plagued by a worker shortage, three smaller mills closed in 2023 and many mills are keeping log inventories low, which is unusual going into the winter. The latter shows a short-term fear of continuing soft markets and results in a lack of demand and reduced prices for average logs for many species. Part of this positioning is based on housing starts which are down.
2024 Outlook
However, there is some optimism in the sector that there will be a balance in supply and demand in 2024. This balance will be needed before we see a rebound in overall timber pricing for a large number of our species. The exception being white oak stave logs where demand will remain high enough to maintain prices throughout 2024.
Impact of Net Farm Incomes on Kentucky Commercial Crop Farms
Farm profitability affects farms and farm families in tax liability, the net farm income that enables the business to meet its financial obligations, and in farm family income. Data from the Kentucky Farm Business Management (KFBM) program illustrates how farm profitability has affected participating commercial crop farms.
Most farmers pay income tax on a cash basis: income received minus expenses paid and depreciation taken. Average 2022 Farm Profit or Loss for this group was $161,591. Crop farmers can expect high income tax liability again this year.
Net farm income (NFI) is a more accurate measure of profitability. It is gross income produced in the year minus cost of production regardless of when expenses are paid or income is received. The highest NFI yet seen in KFBM was $871,325 in 2021. Last year it dropped back to the 2020 level. Two reasons for the drop: 1) Total Cost Per Acre rose 21%, cutting the net by $184/ac. 2) Government Payments, a huge factor in farm recovery starting in 2017, fell to nearly nothing in 2022. Farmers can expect the same for 2023 and 2024.
USDA projects substantially lower 2023 NFI for all farms nationwide. For Kentucky crop farms, corn and soybean yields may offset lower prices, and the increase in cost of production has slowed, which could result in a less severe drop in NFI.
Net farm income directly affects farm financial condition by providing the means to meet obligations in long-term and short-term.
Solvency is the ability of the farm to meet its obligations in the long-term. A debt/asset ratio of less than 30% is healthy for a crop farm. Debt/asset ratio for these farms has been below 30% and falling for the past 6 years, due to increased NFI, good management decisions, and stable land prices.
Liquidity is the ability of the farm to meet its obligations in the short-term. Working capital is used to measure liquidity. It is current assets minus principal due in the next 12 months. The remainder is available to pay operating expenses, take advantage of opportunities, and meet challenges. Comparing working capital to principal due in the next 12 months gives the working capital ratio. A 2:1 or more ratio is healthy for a crop farm. These farms have had a healthy working capital ratio for the past three years due to management planning to keep current assets in the farm.
These farms are all owned and operated by families. They depend on NFI to contribute to Family Living. Total spending in 2022 was $95,988, a $24,000 increase over 2020 and earlier, led by increases in medical & general expenses.
2022 Situation
Agriculture continues to be on a wild ride with a multitude of factors impacting prices, income, and the overall outlook for the ag economy. Spiraling inflation topped the headlines in 2022, but other factors such as major weather events, continued supply chain disruptions, soaring input prices, labor challenges, and trade disruptions continued to offer challenges for most businesses this past year, including agriculture. On top of these factors, the war between two major global ag markets, Russia and Ukraine, generated significant impacts on commodity prices and the availability of both farm inputs, ag trade flows, and global food supplies. Despite these extreme events, the U.S. farm economy remained relatively strong in 2022. Even with record increases in input expenses and considerably lower government payments, USDA is projecting that U.S. net farm income will be higher in 2022.
The ag economy continues to depend heavily on trade outcomes. Despite several adverse trade headwinds such as a much stronger U.S. dollar (up more than 10% in 2022) and global economic growth cut in half, the value of U.S. agricultural exports will end up the year at record high levels, with gains across most ag commodities and major food products.
Leading the list of the largest export gains for ag products important to Kentucky (through September 2022) are U.S. soybean exports (+49%), dairy (+26%), beef (+ 21%) and poultry (+18%). U.S. distilled spirit exports are 25% higher, while forestry products are up 10%, both rebounding from dismal 2020- 2021 export levels. Pork exports are down 10%, and tobacco exports continue to plummet.
Certainly, higher commodity prices are responsible for the growth in export value as export volume was constrained by tight supplies for several ag commodities/products, not by a lack of demand. China remains the U.S. largest foreign customer for U.S. agricultural products, but U.S. ag sales to other major foreign markets, including Canada, Mexico, Japan, and the European Union all experienced double digit percentage increases through September 2022 compared to the same period last year.
U.S. ag production expenses are projected to increase by nearly 20% in 2022, which would be the highest annual dollar increase on record. While prices for some inputs such as fuel and fertilizer have moderated in recent months from their levels earlier in the year, they remain relatively high and volatile. Even with higher input prices, ag commodity prices have generally increased by a larger percentage as tight global supplies amidst strong export demand are keeping prices well above levels observed in recent years.
Interest rates have steadily increased in recent months in response to the Federal Reserve’s actions to fight inflation. Operating and real estate loans are now above 7% and will likely inch up more by the end of the year. Higher interest rates and tightening profit margins may soften the surge the growth in land values observed during the past years, but farm asset values remain strong. Consequently, even in the midst of some emerging concerns (higher interest rates, increasing debt loads, and uncertainty over the future value of farm prices, income, and assets), the balance sheet for U.S. agriculture remains solid heading into 2023, especially compared to the 2016-2020 period.
Kentucky
After a string of great years, mother nature was not kind to Kentucky farmers in 2022. Extensive periods of excess rain early in the growing season, followed by drought conditions during critical growing periods led to lower crop yields plus a poor curing season for tobacco. The December 2021 tornado in west Kentucky and the July 2022 floods destroyed ag infrastructure and likely affected 2022 farm marketings/income in these areas. While Kentucky farmers benefitted from relatively high national commodity prices, local grain prices were adversely impacted during the harvest season by the effects of low water levels on the Mississippi River limiting grain flow to domestic and export markets and inducing significant carryover of grain into 2023.
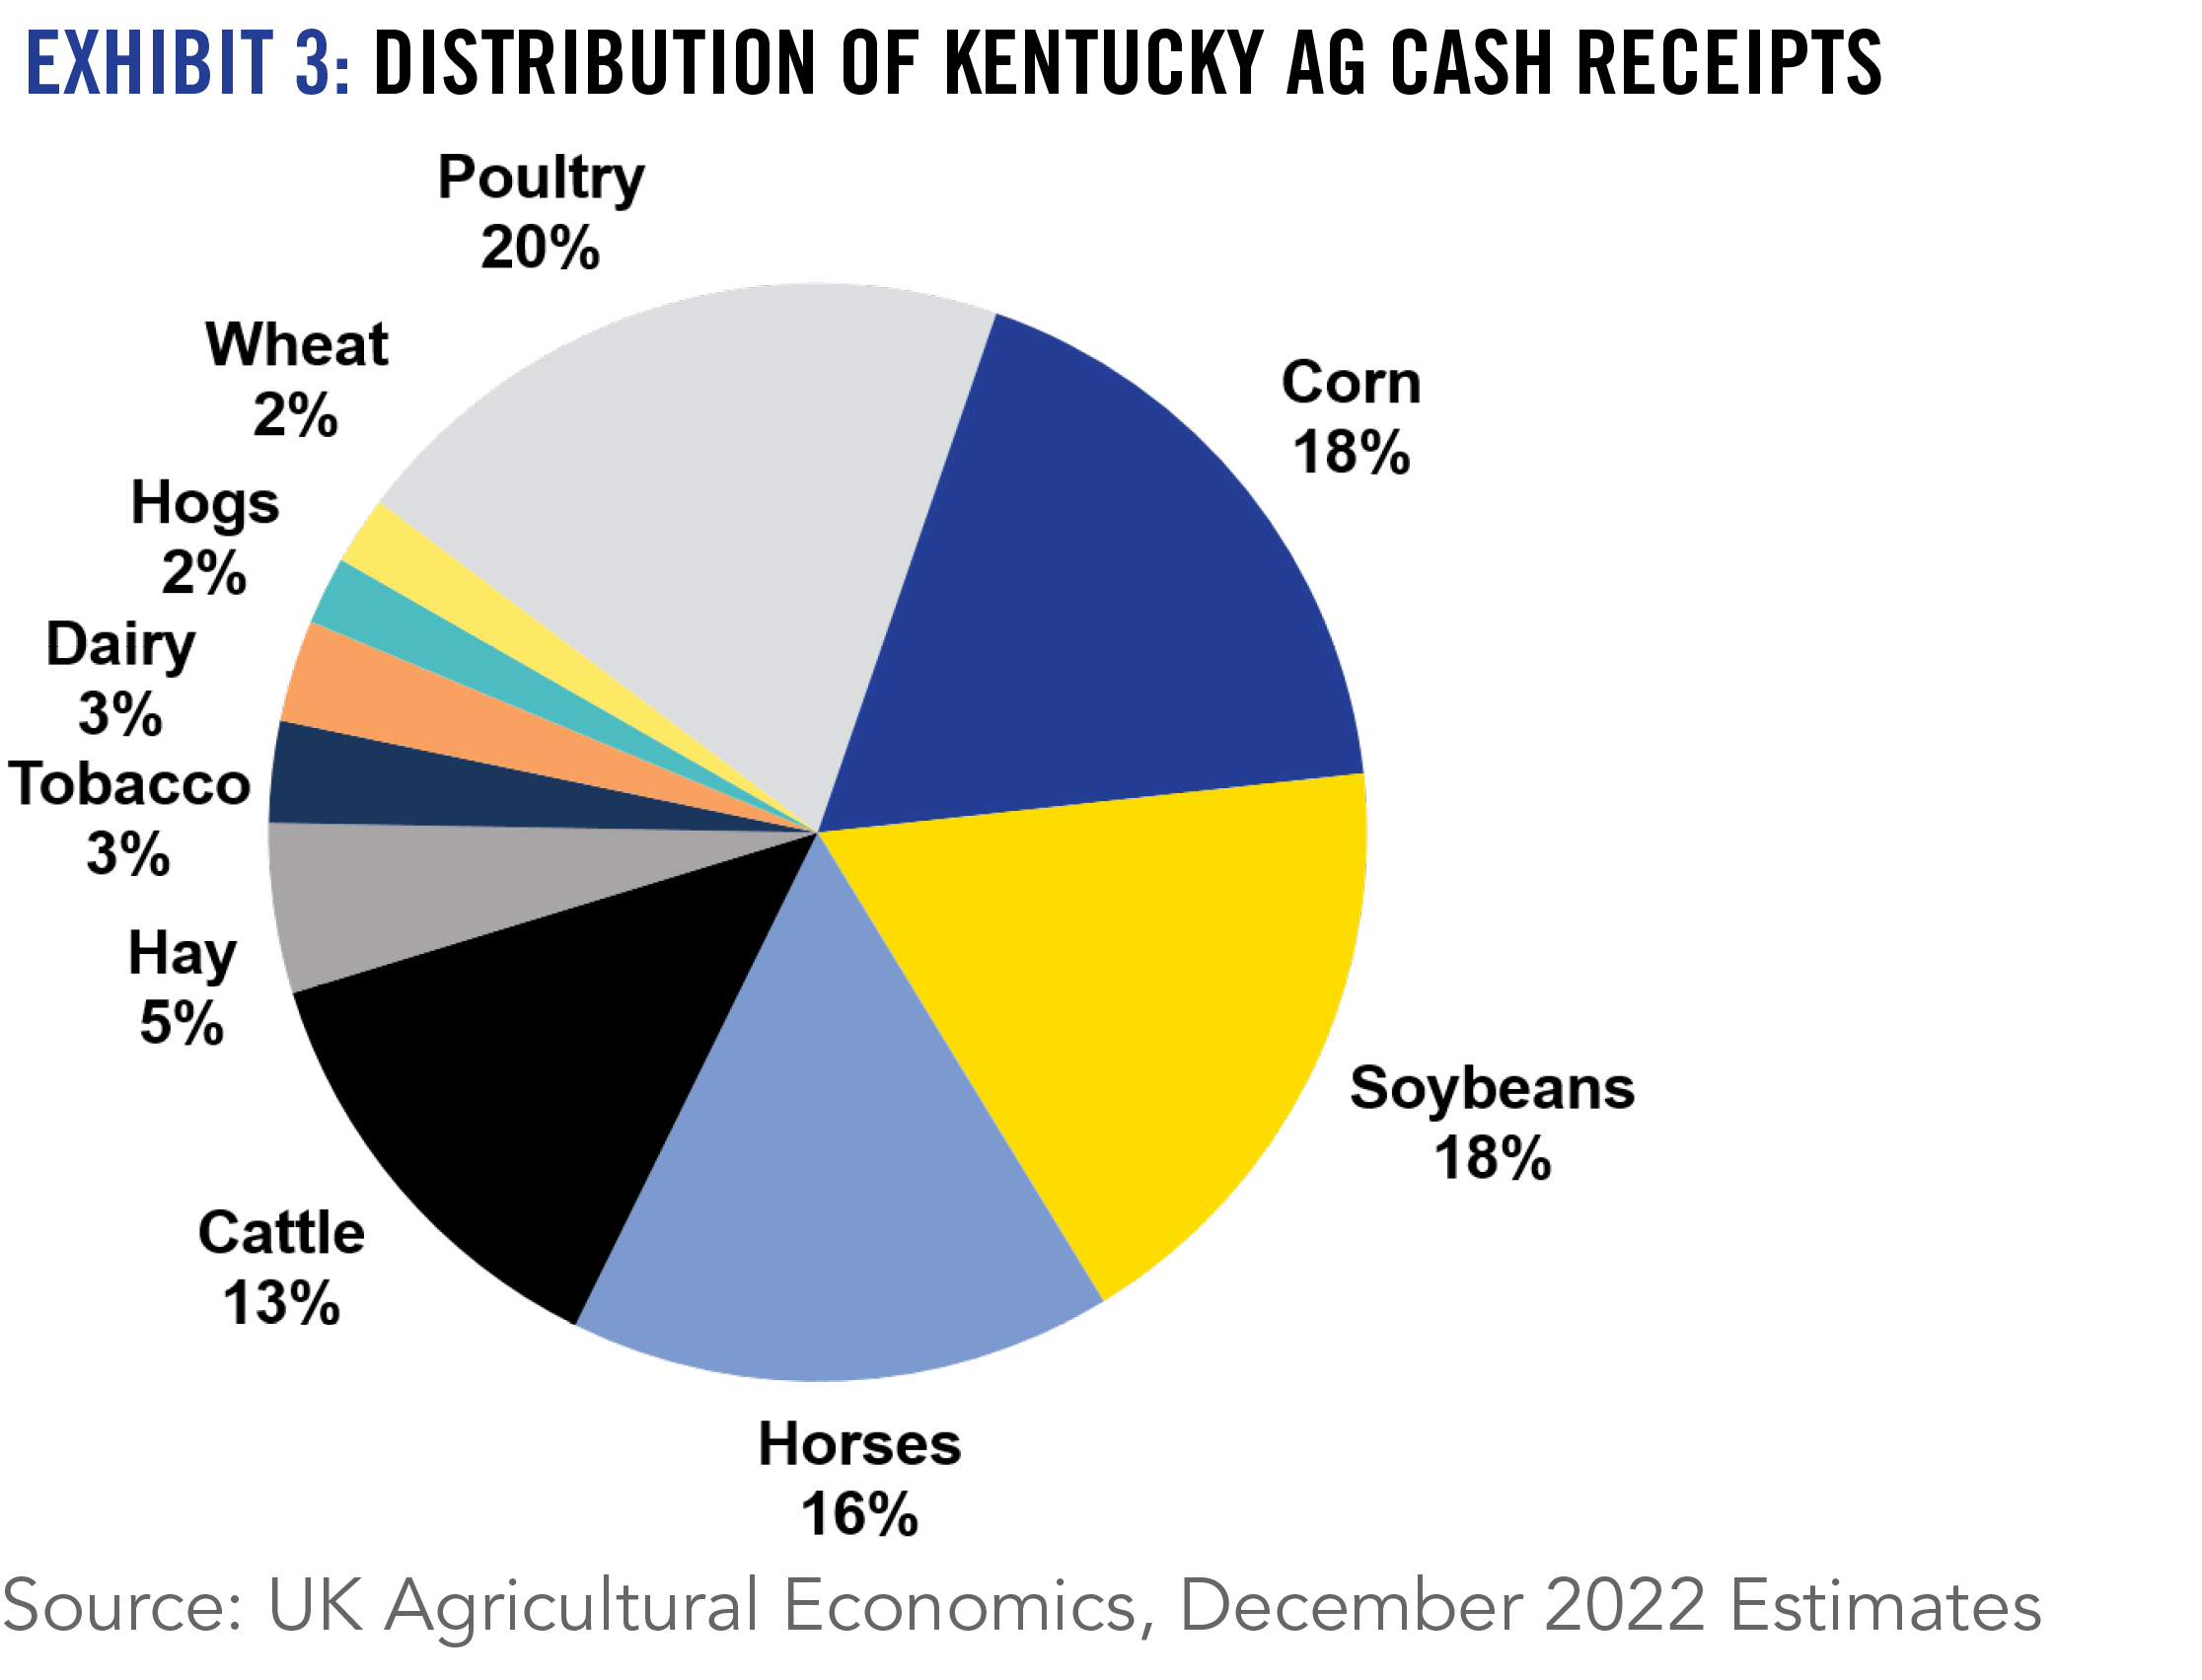
Despite these challenges, Kentucky ag cash receipts may approach a record high $8 billion for 2022, well surpassing last year’s record high of $6.9 billion. Adjusted for inflation, our 2022 receipt estimate if achieved, will be 19% higher than the inflation-adjusted average over the previous ten years. Overall, farm-level prices received by Kentucky farmers will likely exceed lower yields/marketings for most Kentucky ag enterprises. Despite challenges evolving from the tornado and avian influenza, poultry is expected to regain the top spot in Kentucky agriculture with a 20% market share of receipts, followed by soybeans and corn (both at 18%), horses (16%) and cattle (13%).
Kentucky farmers established a record net farm income in 2021 with exceptional yields and growing export markets. Inflated input prices and limited direct government farm payments for this year will partially offset Kentucky’s expected record level of farm cash receipts for 2022, but crop insurance payments should cushion the blow for Kentucky farmers impacted by natural disasters, leading to another year of relatively strong net farm income levels for Kentucky agriculture.
2023 Outlook
Historically, periods of high global ag prices often lead to a global production response which typically results in commodity prices falling more than sticky ag input prices. However, agriculture will enter 2023 with continued tight global supplies of most agricultural commodities and thus continued relatively high commodity prices. However, the upcoming year is filled with much uncertainty over issues such as the war in Ukraine, South American crop production response, economic challenges in China, the effects of inflation on interest rates and the cost and availability of ag inputs. U.S. ag export demand could be dampened by a slowing global economy and an anticipated higher valued U.S. dollar. Most ag economists expect commodity prices and margins to moderate in 2023, but still maintaining relatively high cash receipts and net income levels. But the outlook is very vulnerable to radicle changes in global economic, geopolitical events, weather and disease factors which could easy lead to extremely volatile farm prices and incomes. Consequently, producers must continue to monitor to changing conditions, and be ready to adjust marketing strategies often amidst this extreme uncertain marketplace.
2022 Situation
In a year when production was expected to be lower, beef production was actually higher in 2022. Wide spread drought and a relatively strong cull cow market resulted in a lot of cattle being pulled forward and a large proportion of females entering in the beef system. In fact, the size of the US cowherd has been decreasing since 2019, but we have not yet seen an annual decrease in beef production. While USDA estimates won’t be released until early 2023, it is likely that the size of the US beef cow herd decreased by another 3-4% for the year, which would put the herd near the levels seen in 2015.
2023 Outlook
While there is uncertainty about demand and weather going forward, the fundamentals look very strong in the beef cattle sector. A decrease in beef production of more than 5% is very likely for 2023 and the supply of feeder cattle and calves will continue to get tighter. The spring calf market should be extremely high, with 550 lb medium / large frame #1-2 steers averaging more than $2 per lb on a state average basis. Tight supplies and high feed prices will support heavy feeder prices, which should trend upward throughout the year. Value of gain will remain strong and opportunities to add weight to Kentucky cattle should exist, despite high feed costs. High value of gain should also lead to attractive margins for stocker operations that add lbs via forage from spring to fall.
2022 Situation
Avian Influenza (AI) was the primary story of poultry markets this year at the national level. While AI was found in Kentucky, it was largely contained and the impacts were limited. National broiler production was higher in 2022, but production was down considerably in the Commonwealth. Several operations were impacted by the tornadoes that ripped through much of Kentucky in December of 2021 and a processing plant in the Western part of the state operated at reduced capacity for a period of time. This, combined with an increase in time between flocks, worked to decrease production at the state level. Much was made of decreasing broiler prices through summer and fall, but wholesale price levels have remained above last year’s levels.
2023 Outlook
Feed and labor costs will again impact integrator margins and may continue to result in increased time between flocks in 2023, but Kentucky production levels should return to near normal levels. Poultry producers will continue to feel the impact of high energy costs on their returns per flock. Construction costs and higher interest rates will also limit growth in the sector and may impact upgrades to existing houses. While the industry remains stable, the last couple of years have driven home the importance of risk factors such as disease outbreak and natural disasters, both of which should be on the minds of Kentucky’s poultry producers.
2022 Situation
The year 2021 was a banner year for hog markets as prices reached their highest levels since 2014. Eastern Corn Belt hog prices actually exceeded those levels in 2022, but significantly higher feed prices ate into margins somewhat. Still, farrow-to-finish returns were positive for most of the year. Surprisingly, hog inventory has been decreasing since 2020, despite relatively attractive return levels. Export levels have decreased from their recent highs as China appears to have rebuilt its hog inventory, but remain well over 20% of domestic pork production.
2023 Outlook
USDA-ERS is predicting a slight increase in pork production in 2023, but that will primarily be a function in increasing productivity. Exports are also likely to face continued headwinds going forward. Hog prices will likely decrease from 2022 levels, but remain historically strong. As with all livestock species, feed prices for the coming year will impact profitability. However, farrow-to-finish returns are likely to be in the black for most of 2023.
2022 Situation
Equine markets have continued their very impressive recovery from the depressed market brought on by COVID-19. After seeing an increase of 38% from 2020 to 2021, Keeneland sales increased by another 9% in 2022. This was the highest sales level since 2007. A continued return to normal likely had a positive impact on markets for competition horses. Coming out of the pandemic, excess disposable income, an increase in remote work arrangements, and a possible change in priorities likely had a positive impact on the demand for horses of all types.
2023 Outlook
While there are risk factors that can impact equine markets, the general strength of the sector is likely to remain. Revenues generated from historical horse racing (HHR) continue to increase purses and attract quality horses to the state. This trend is also undoubtedly feeding into sale values and possibly stud fees, the two main components of equine farm level receipts in the Commonwealth. While the number of mares bred may continue to decline slightly, it is also possible that trend will be offset by strength in the markets. So, another increase in equine receipts at the state level seems very likely for 2023.
2022 Situation
Dairy cow inventory steadily increased for the first several months of 2022 as farm level milk prices improved, then largely flattened through summer and into fall. The U.S. All Milk price will average around $25 per cwt for the year, which will be more than $6 per cwt higher than 2021, despite the fact that milk price levels have retreated from their spring highs. This price improvement was partially offset by increased feed costs as the estimated feed cost included in the Dairy Margin Coverage (DMC) program ration increased by about $3 per cwt of milk produced from 2021 to 2022.
2023 Outlook
Dairy cow numbers in 2023 should be comparable to what was seen in 2022. But, productivity gains are likely to result in about a 1% increase in milk production across the U.S. Kentucky farm level milk prices will likely be a bit lower than 2022, but should average well above $20 per cwt. However, feed prices will continue to be the lead story. With feed prices at current levels, farm level milk prices in the low-mid $20’s will feel much more like milk prices in the upper-teens in a historically normal feed cost environment. As is always the case, profitability challenges will be especially felt on smaller scale dairies with higher cost of production.
2022 Situation
Total production for the 2022 national corn crop is projected to be 3% lower than the five-year average. Corn use for ethanol production is stable. Livestock feed use is projected to decrease 5% compared to the five-year average. Given these changes and that initial stocks were started out the marketing year at low levels (30% lower than the 5-year average), the USDA is projecting a 34% decrease ending stocks over the five-year average, pushing the expected U.S. on-farm corn price up to $6.80/bu for the 2022-23 marketing year. In Kentucky, corn prices are $6.40-6.70/bu as of late-November, with forward contracting prices jumping to $6.60-6.90/bu this winter in our better markets
2023 Outlook
2023 harvest contract corn futures are up $1.25/bu from expectations a year ago, resulting in forward contract pricing of $5.60-5.85/bu for the 2023 new crop delivery. This would be an increase of approximately $220/acre for 175 bu/acre corn crop. Fertilizer prices have increased slightly from for the 2023 crop, compared to the 2022 crop, resulting in approximately $20-25/acre increase over fertilizer prices for the 2022 corn crop. However, fertilizer prices are up significantly from pre-2021 levels, as well as other input costs. Luckily, the overall prices increases since 2020 results in much higher increase in revenue compared to these increases in costs.
2022 Situation
Total production for the 2022 soybean crop is projected to be 3% higher than the five-year average. U.S. soybean use are projected to be 5% higher than the five-year average, while soybean exports are projected to be 2% higher than the five-year average. The effect of these changes combined with low levels of initial stocks (44% below the five-year average) is a 54% drop in soybean ending stocks over the 5-year average, pushing the expected US on-farm soybean price up to $14/bu for the 2022-23 marketing year. In Kentucky, soybean prices are $14.20-14.50/bu as of late-November, with forward contracting prices $14.40-14.70/bu bu this winter in our better markets.
2023 Outlook
2023 harvest contract soybean futures are up $2.00/bu from expectations a year ago, resulting in forward contract pricing of $13.30-13.60/bu for the 2023 new crop delivery. This would be an increase of approximately $110/acre for 55 bu/acre soybean crop. Fertilizer prices are up approximately $25-35/acre increase over prices for the 2021 soybean crop.
2022 Situation
Soft Red Winter Wheat production in 2022 increased 17% compared to the 5-year average. However, when combined with extremely low initial stocks (39% below the 5-year average), the resulting available supply going into the marketing year is down 3% from the 5-year average. Domestic use is projected to be down 2% and exports up 38%, for a total use increase of 10% over the 5-year average. Combined with the available supply, the resulting ending stocks are projected to be down 35% compared to the 5-year average or about the same level as we started with this year. This has led to leveling off of prices. In Kentucky, cash prices as of late-November are around $7.30-7.60/bu. However, wheat prices were at or near $10/bu during early summer harvest time and much of the 2022 crop was sold at these levels.
2023 Outlook
2023 harvest contract wheat futures are about the same compared to expectations a year ago, resulting in forward contract pricing of $7.30-7.60/bu for the 2023 new crop delivery. Double-crop wheat and soybeans are projected to be considerably more profitable than full-season soybeans on the better wheat ground in Kentucky.
2022 Situation
Kentucky tobacco farmers had the opportunity to grow a larger crop in 2022 due to tight supplies, but declining margins led to continued concentration in the number of growers and mother nature took its toll on yields in certain areas and especially on quality with a very dry curing season. Kentucky’s tobacco production is forecast by USDA to be 10% lower in 2022 with burley production down 21%. Dark fire-cured production rebounded nearly 9% as a major buyer increased contract volumes by more than 50%, following an abrupt cut two years ago. Dark air production was relatively flat, while cigar tobacco acres declined.
Demand for U.S. burley continues to fall as less expensive foreign leaf has induced U.S. burley exports to plummet while the burley import share remains relatively high. After a year of fairly stable cigarette sales in 2020, U.S. cigarette consumption declines accelerated in 2021 and 2022, with annual sales volumes down by more than 7% --far exceeding annual pre-COVID declines of 3 to 4%. Alternatively, dark tobacco demand continues to benefit from stable smokeless tobacco sales coupled with virtually non-existent foreign competition. Contract prices for burley were boosted in 2022 to encourage additional production, but early marketing prices in the $2.20s/lb (vs a $2.07/lb average for the 2021 crop) will be challenged to meet grower satisfaction amidst higher input prices. Prices for later burley marketings will likely fall given quality issues. Dark tobacco prices for the 2022 crop are expected to be 10 to 20 cents/lb higher compared to last year’s $2.78/lb for dark fire-cured and $2.50/lb for dark air-cured. In aggregate, the value of Kentucky’s 2022 tobacco production may total around $250 million compared to $269 million in 2021, with dark tobacco perhaps exceeding one-half of the total value of the state’s tobacco crop.
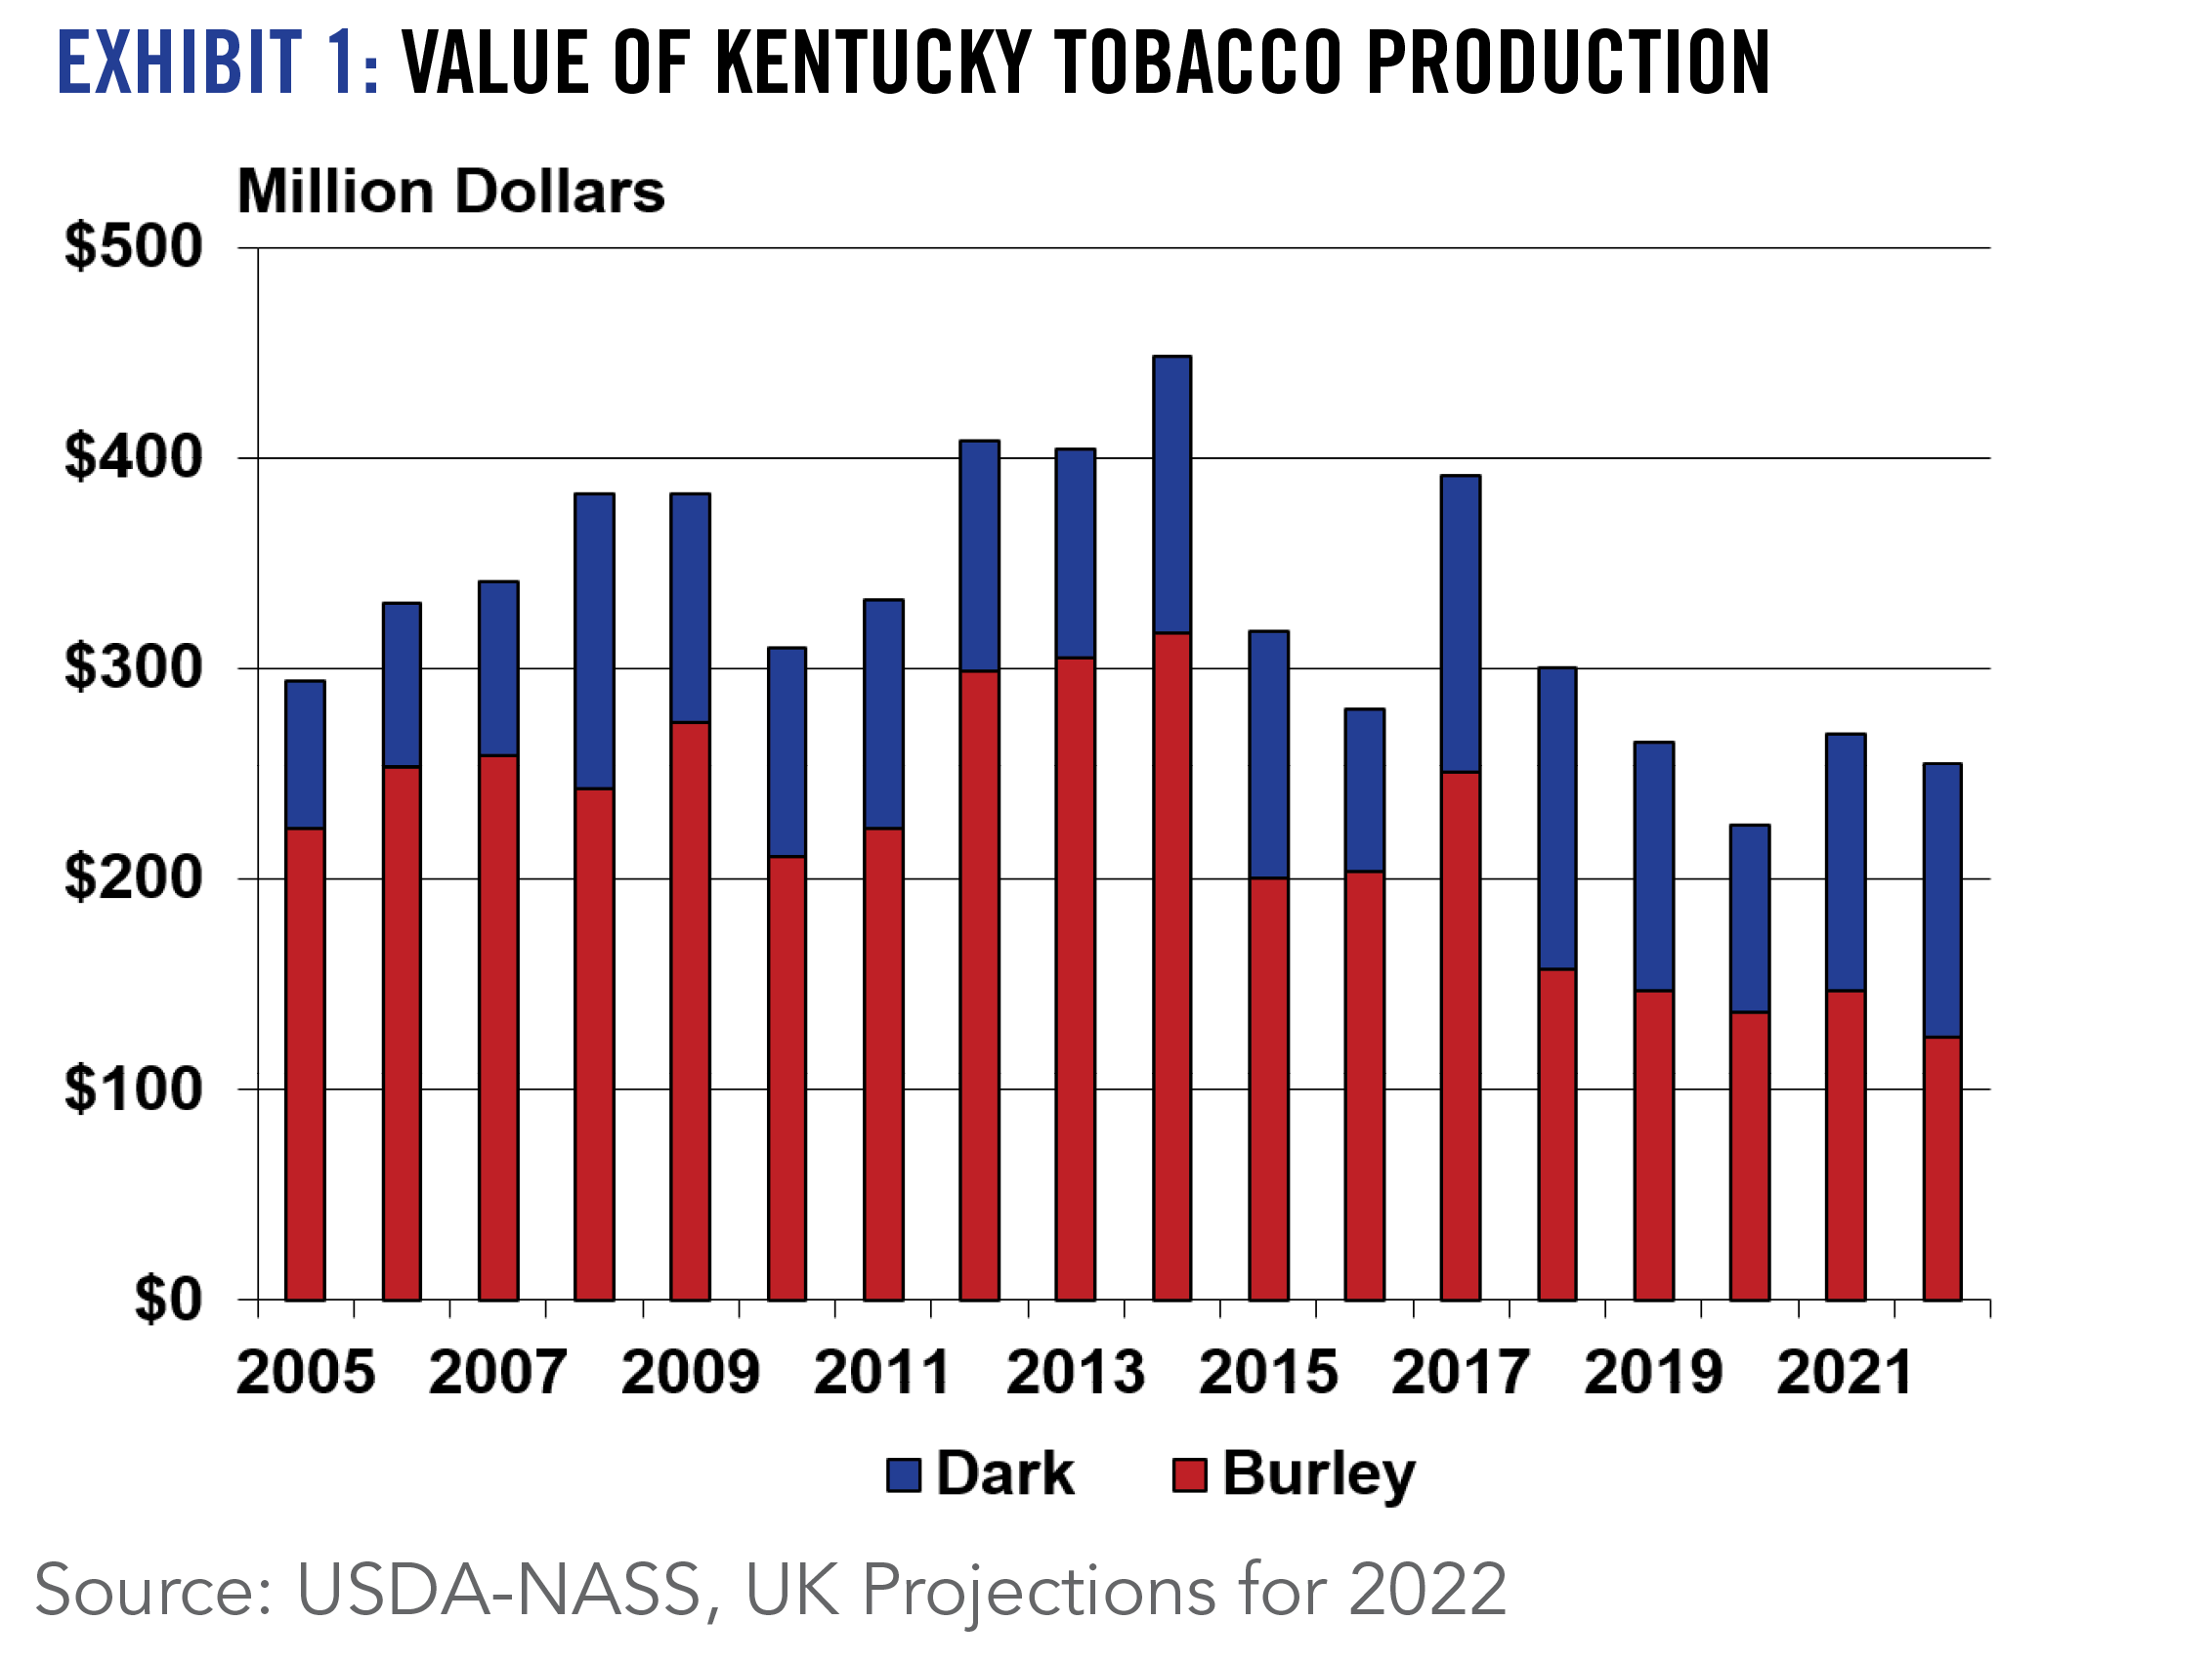
2023 Outlook
Despite current demand expectations, (especially for burley), Kentucky farmers will have an opportunity once again to increase acreage in 2023 due to tight supplies. However, the ultimate outcome will depend on contract prices and profit opportunities from alternative ag enterprises. The H2A wage rate is forecast to increase from $13.89/hour to $14.26/hour, putting additional upward pressure on production costs amidst stagnant yields. In reality without improved profit expectations, attrition in the number of farms growing tobacco in Kentucky will likely continue to evolve in 2023, which will create challenges for tobacco companies attempting to secure a boost in additional leaf inventories.
2022 Situation
Input costs were up sharply for most specialty crops, especially labor, fertilizer, and chemicals. Strong local wholesale, auction, and direct markets and expansion of controlled environment production, however, will lead to higher cash receipts for 2022. These revenues are projected to be at least $20 million for fruit, $45 million for vegetable, and $118 million for greenhouse and nursery crops in Kentucky.
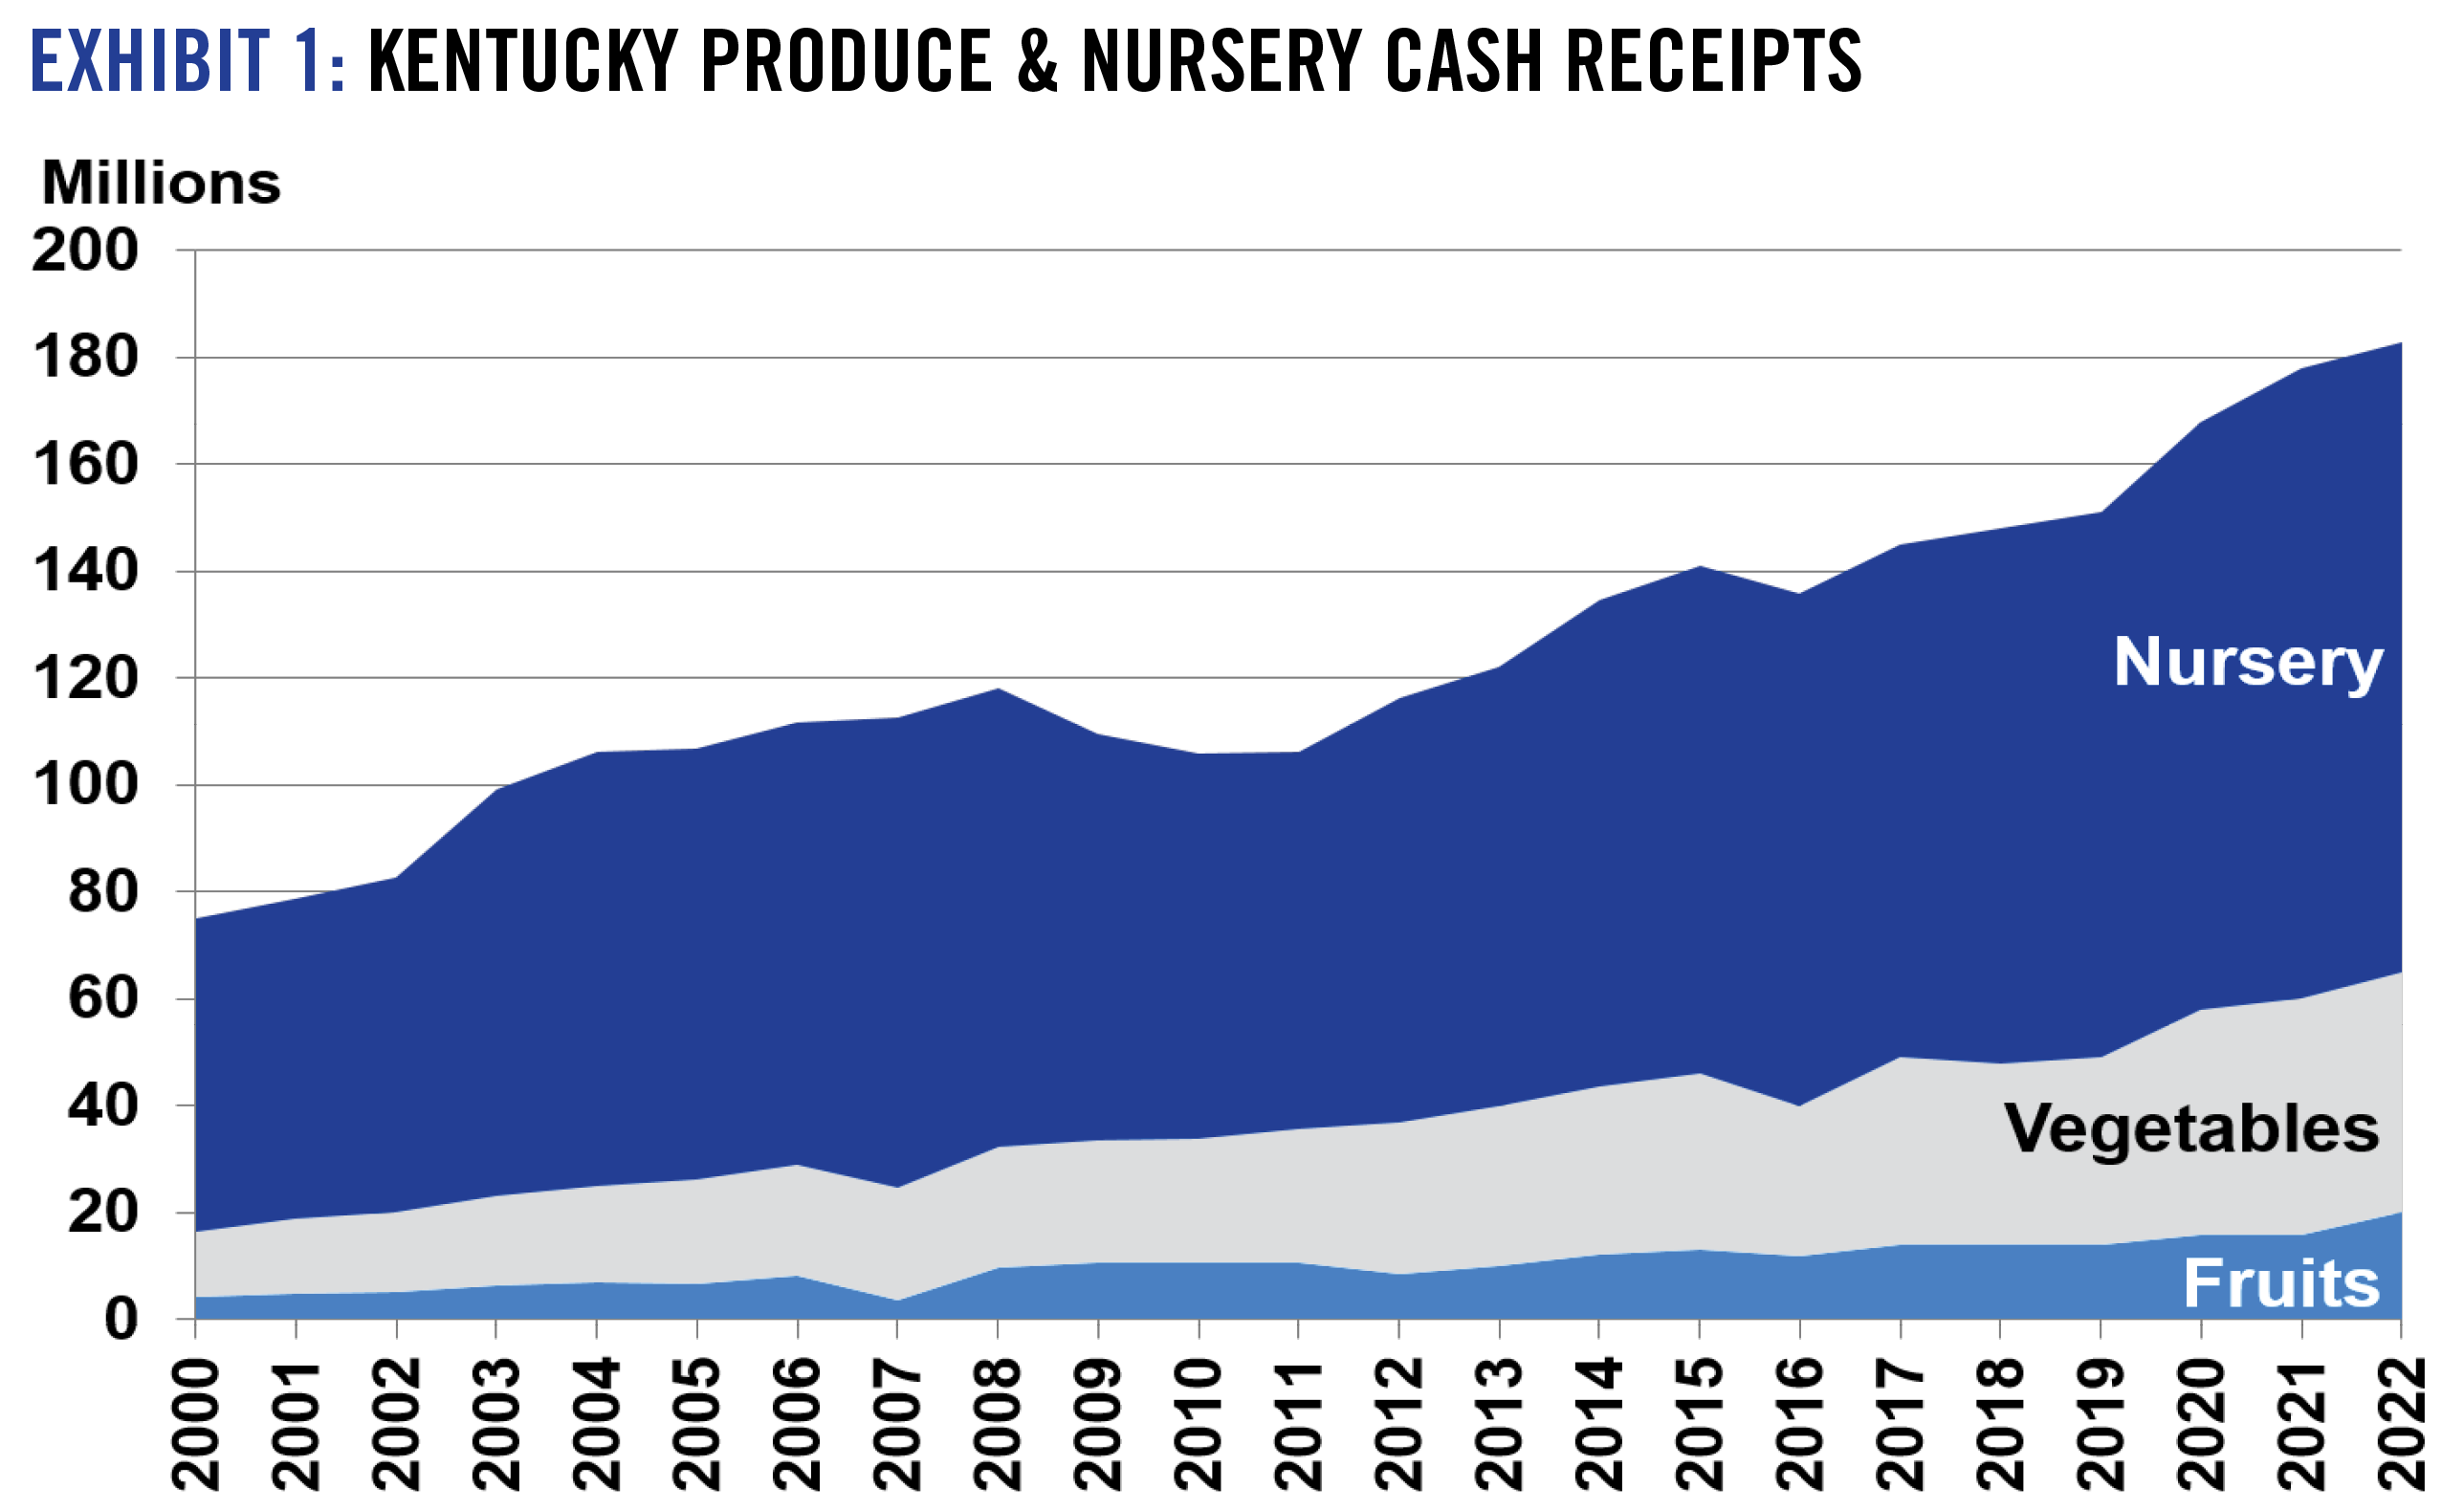
2023 Outlook
Strong competitive pressures will continue from outside of the U.S. in the produce market. While Kentucky growers benefit from strong local demand, and strong local prices may remain in direct markets, import supply will continue to rise. Labor costs are a big constraint for growth in this sector. High costs of other key production inputs are expected to continue, putting pressure on grower margins. New capital-intensive greenhouse production will continue to face both production cost and import market challenges in 2023.
The outlook for 2023 in Kentucky will continue to hinge on strong local demand for specialty crops as markets for many specialty crops trend downward nationally. Recovering restaurants and other wholesale channels, including the produce auctions, will help support continued strong markets in direct-to-consumer platforms. Garden center demand in Kentucky will be expected to keep pace with the strong growth nationally, but may be especially adversely impacted by continued high inflation.
2022 Situation & 2023 Outlook
2022 was a highly dynamic year for the forest sector. While the overall economic contribution is estimated to be unchanged from 2021 at $13 billion, individual commodities varied considerably over the year. Prices paid for all species of lumber logs increased throughout 2021, in some cases to unprecedented levels. These levels were maintained into 2022 during the first and second quarters. However, the third quarter saw a rapid decline in price across all species of lumber logs to an extent where all the gains of 2021 were lost. Across all species there was a 51% loss in value in the third and fourth quarters of 2022. Fortunately, other log products including cross tie logs, stave logs for cooperage and pulpwood have maintained more of their value throughout 2022. 2023 prices paid for lumber logs are expected to stabilize, however ultimately timber values will follow the overall economy and especially housing starts which are currently on the decline.
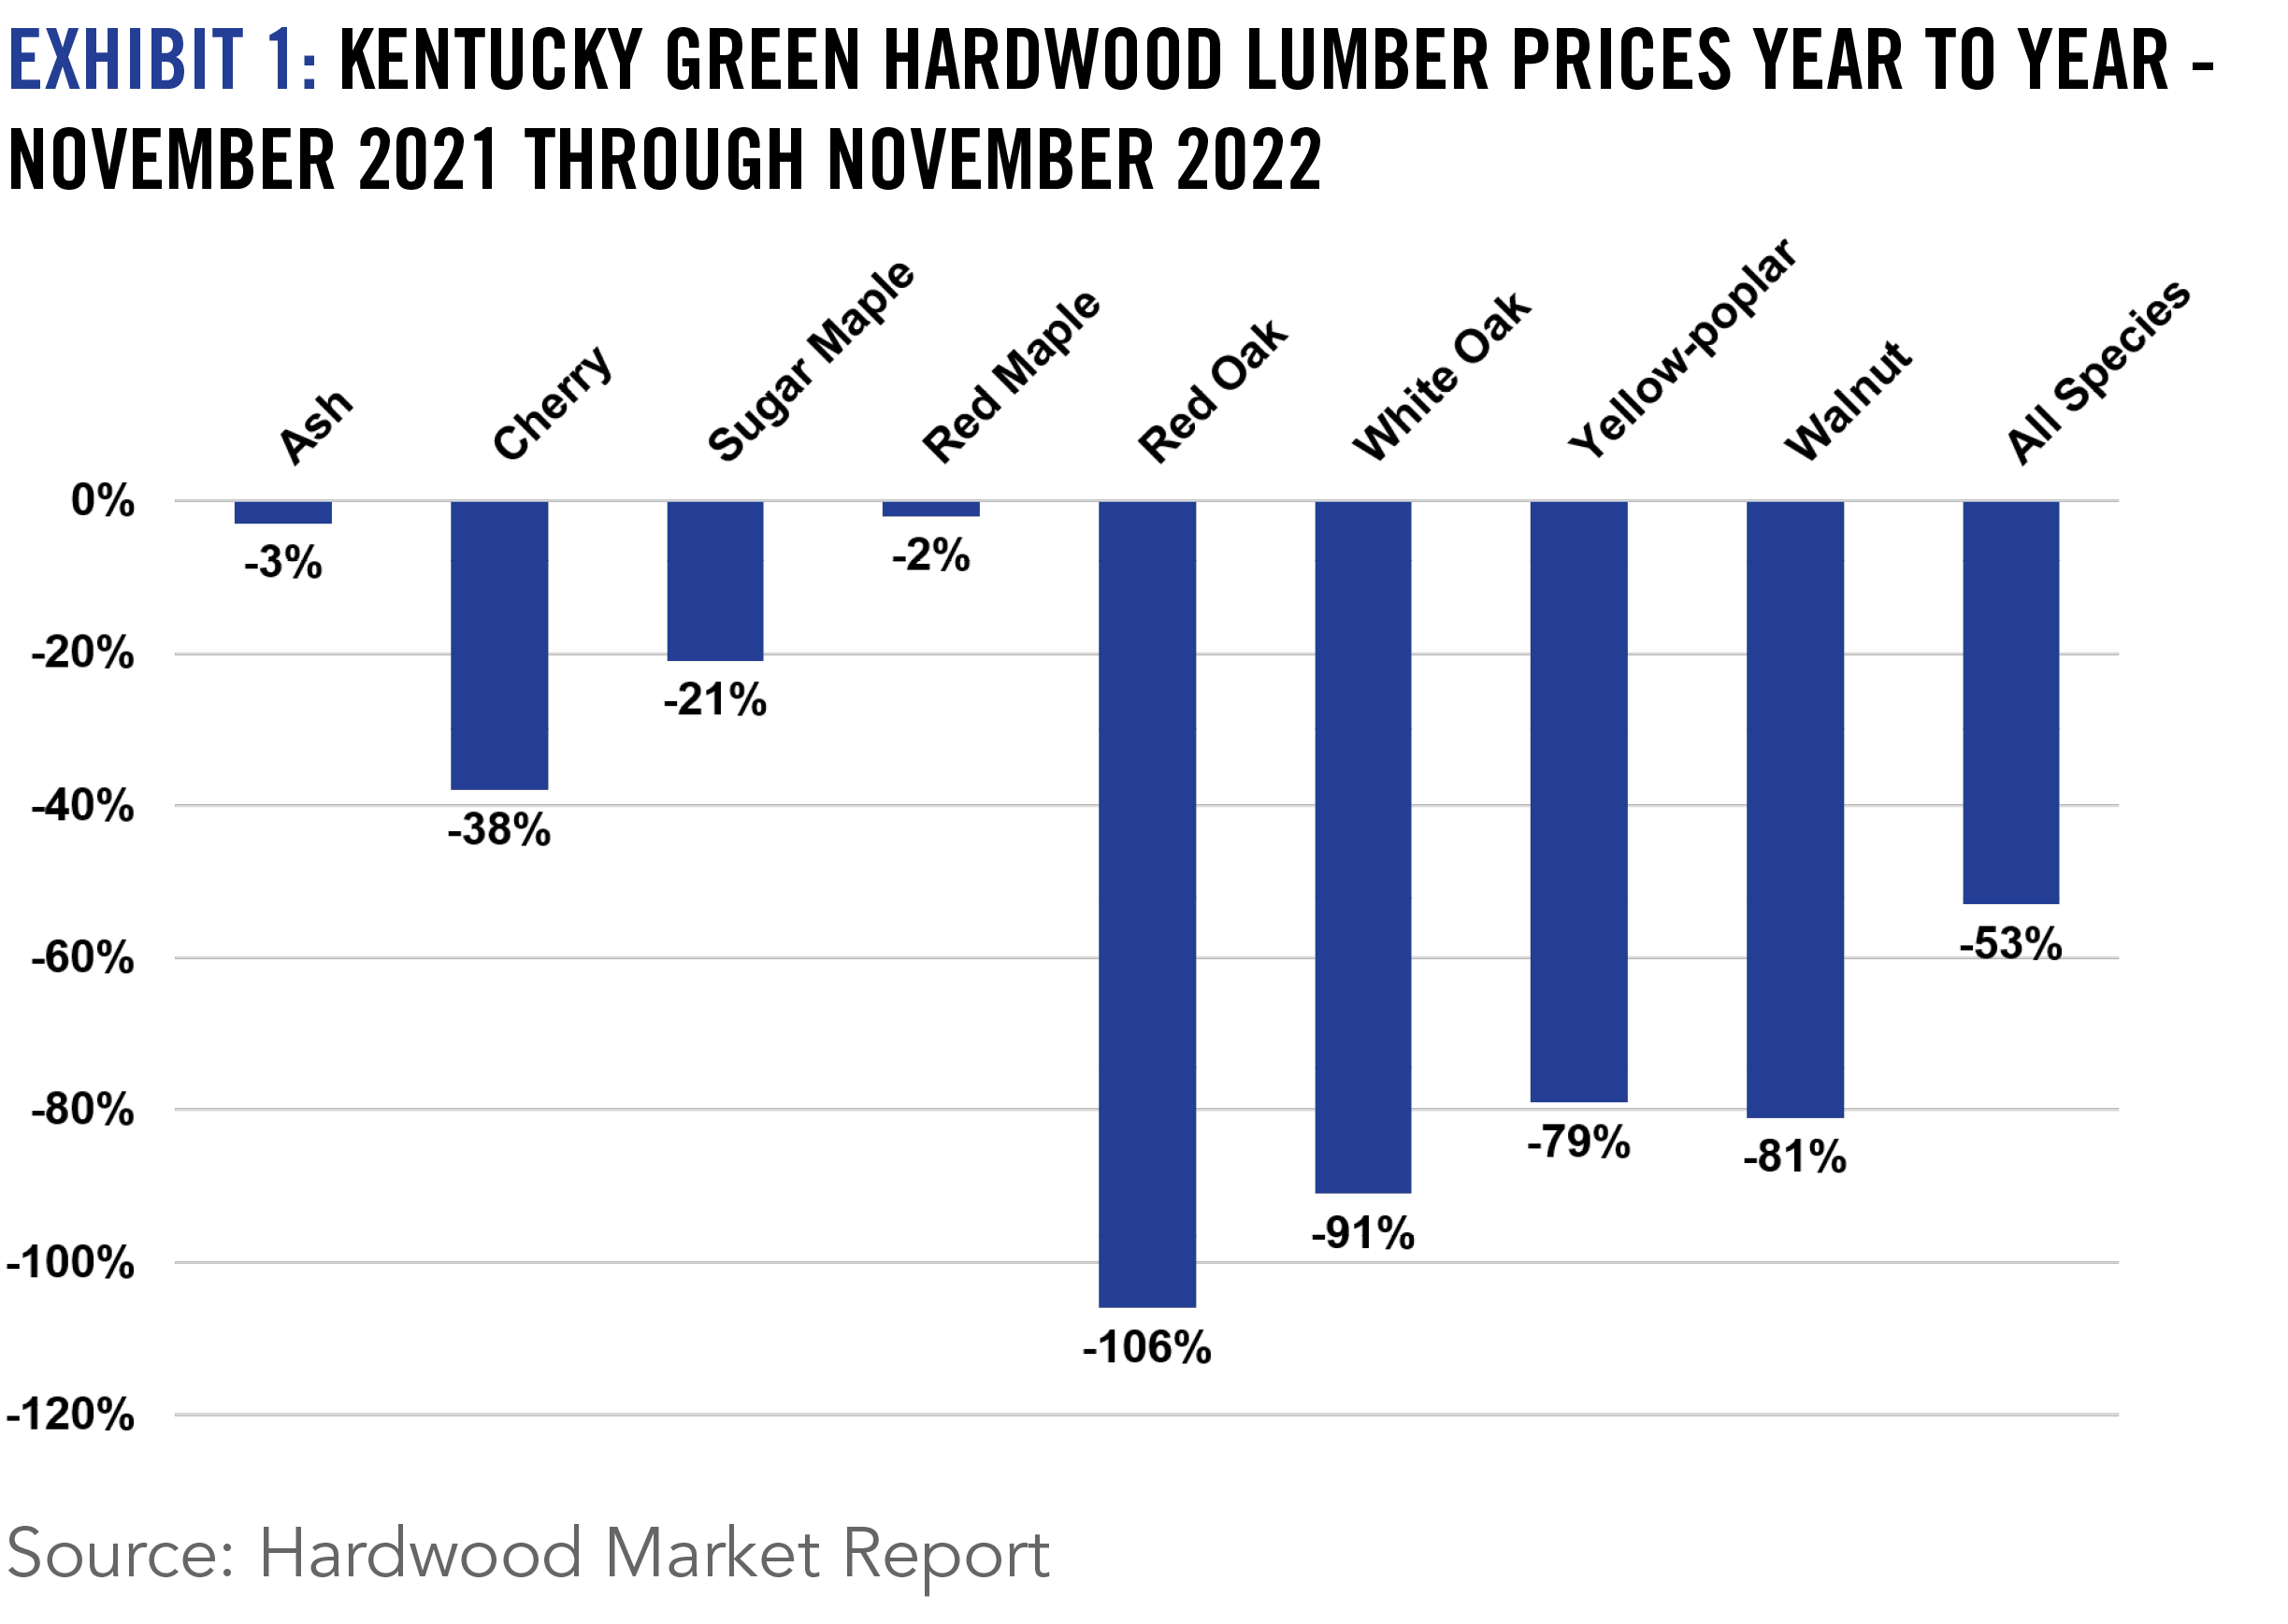
Impact of Net Farm Incomes on Kentucky Commercial Crop Farms
Continued recovery of farm profitability over the past five put the average Kentucky crop farm in a very sound financial position coming into 2022. High commodity prices are pushing average net farm income even higher this year, in spite of lower yields and higher input prices. Outlook for 2023 is just as bright.
This is based on data from commercial-sized crop farms participating in the Kentucky Farm Business (KFBM) management program. For 2022, the average farm cropped 2,375 acres and employed 4 full-time employees. Net farm income reached an all-time high over $871,000. Even adjusted for inflation this figure breaks the previous high set in 2013.
Balance sheets for these farms are very strong. Long-term financial health is very solvent with a debt-to-asset ratio of 28%. A ratio of less than 30% is considered healthy for a crop farm. High and steady land values have kept the ratio low and solvency strong for over ten years.
Financial health in the short run is measured by the working capital ratio. It compares the amount of current assets not needed to pay principal due in the next year to the amount of current liabilities. A healthy ratio is 2:1 or more. The average farm has rebuilt working capital to a financially healthy 2.5:1 ratio at the first of 2022. Farmers have used this working capital to pay for inputs and reduce current liabilities.
Conditions during the last decade seriously eroded farm financial health. Yields and prices in the 20’s have given Kentucky crop farm managers the opportunity to rebuild the farm’s financial health from farm profits.
Even farms in the lower third of income are experiencing profits. This follows six years where the average crop farm in the lower third of net farm income did not make a profit. Debt-to-asset ratios for this group have improved to 30% for the last two years. Working capital has also improved to 2.1:1 coming into 2022. Net farm income projections for 2022 and 2023 suggest that these farm mangers should have the opportunity to further strengthen farm financial health.
Average family living expense was $92,000. This is up sharply as a result of increased spending after COVID-19 and inflation. Spending is close to the national family average. Family living expense is expected to continue to rise with increasing profitability and continued inflation, in line with the general economy.
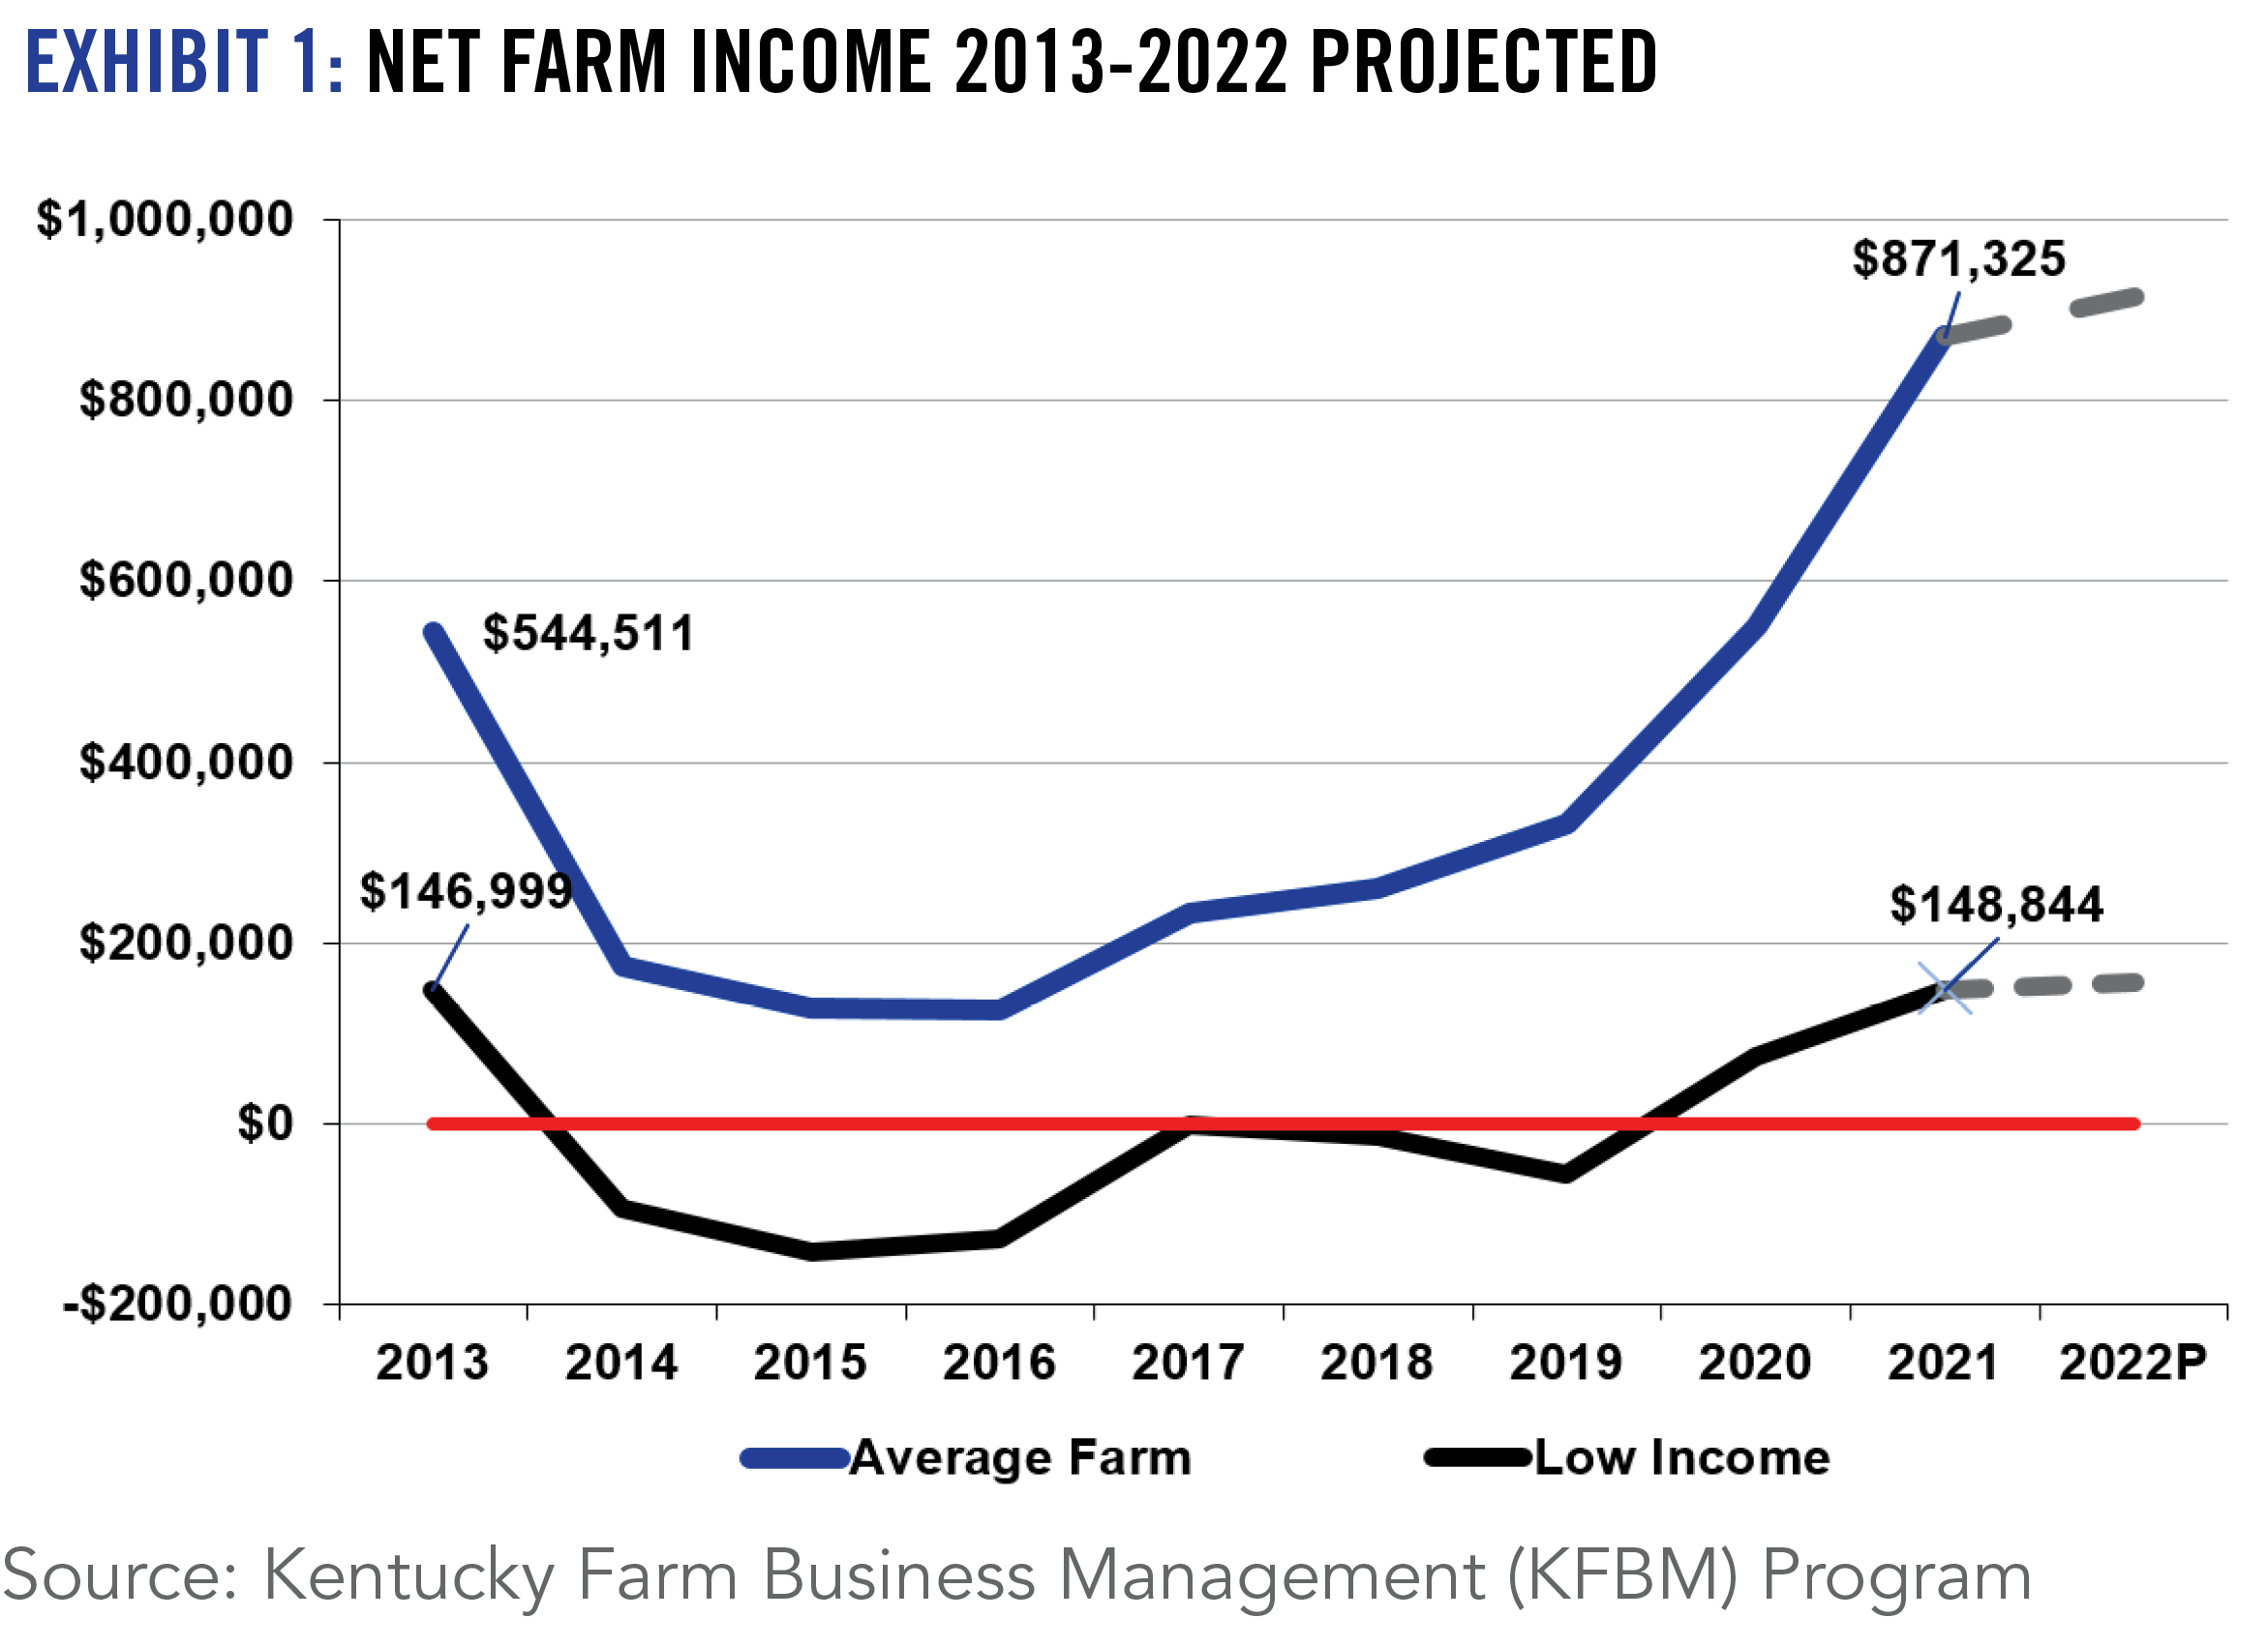
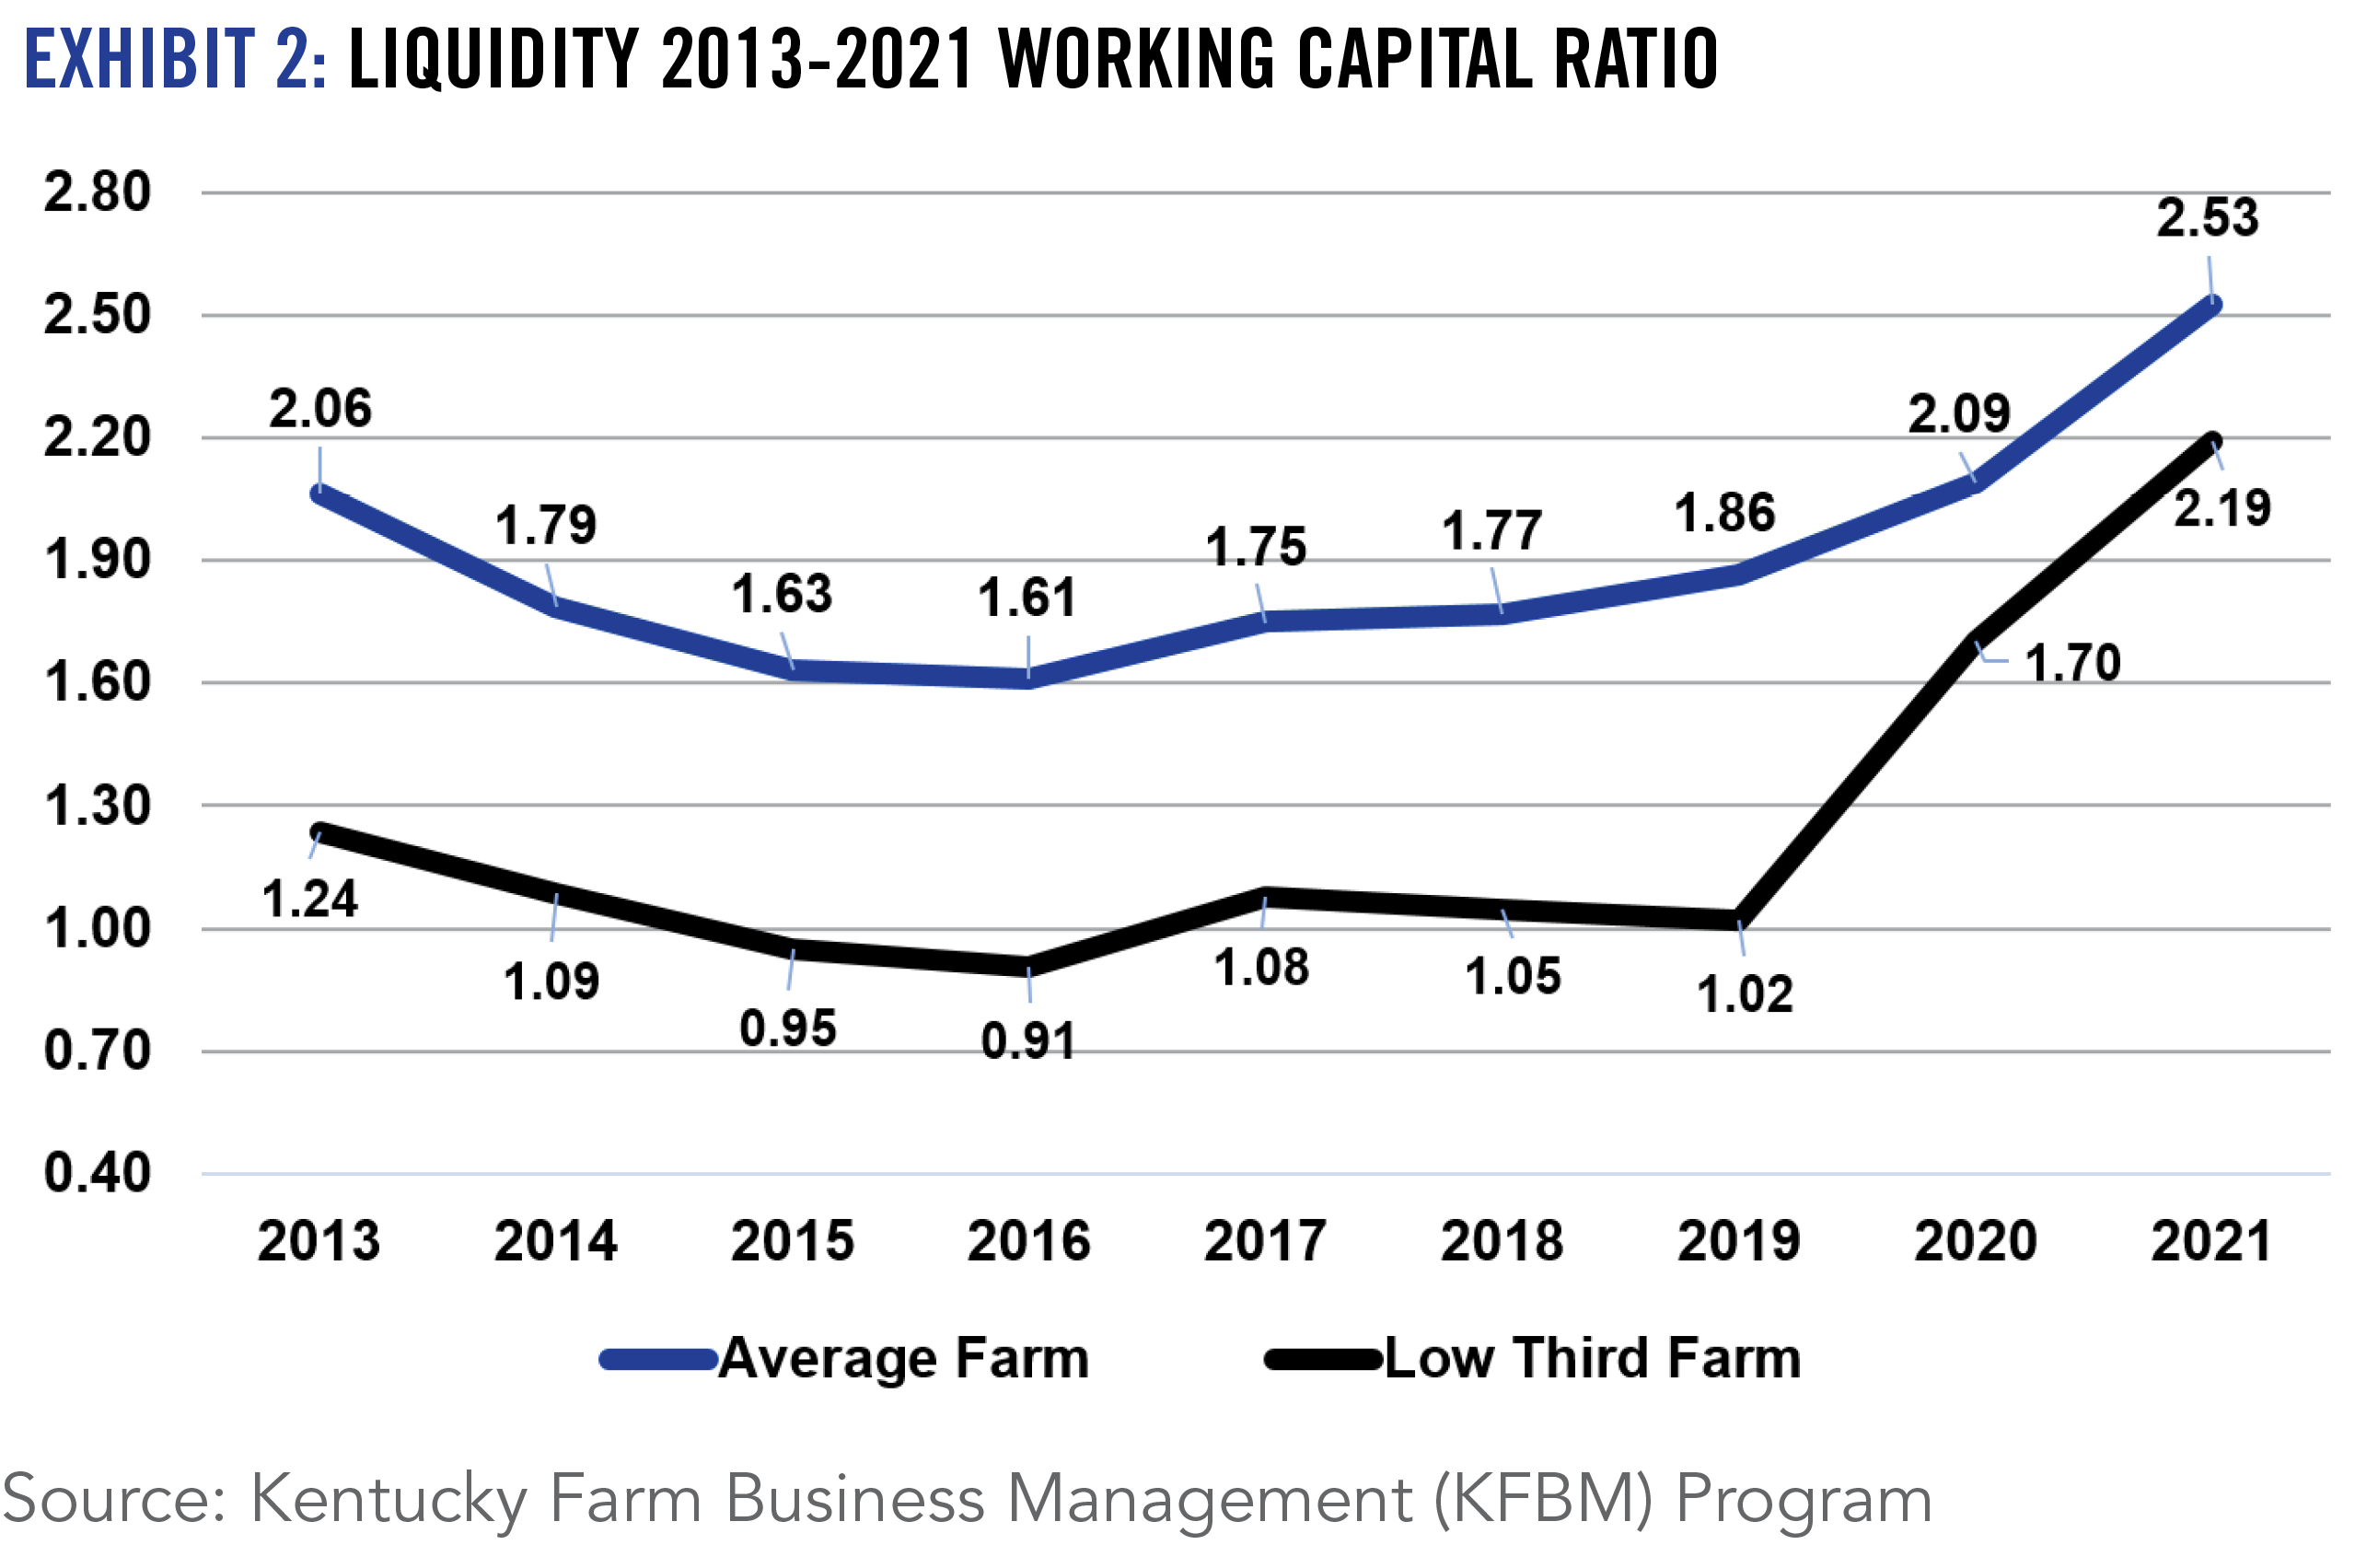
Agriculture, like many industries, has been challenged by a multitude of factors over the past 18 months including a relentless and ongoing global health pandemic, an initial meltdown of the global economy, major supply chain disruptions, continued trade tension, soaring inflation amidst higher energy, labor, and food costs, labor supply challenges, and major adverse weather events. Despite these impactful events, the U.S. farm economy has not only survived, but experienced remarkable growth, initially on the heels of significant government financial support, followed by strong export gains, impressive crop yields, and a growing global demand for meat products. In 2020, USDA claims that net farm income increased nearly 20%, with government payments comprising close to one-half of net farm income. For 2021, USDA is projecting an additional 23% gain in net farm income, which, if realized, would be the second-highest net farm income on record and the sixth-highest over the past fifty years when adjusted for inflation.
Direct government payments to U.S. farmers totaled a record $45.7 billion in 2020. Most of the payments were from the Coronavirus Food Assistance Program (CFAP) to assist farmers from COVID-19-induced price declines and the Market Facilitation Program (MFP) to compensate farmers from losses evolving from the trade wars. Government farm payments are projected to decline 40% in 2021, but are still projected by USDA to comprise around one-quarter of net farm income.
Accounting for both higher commodity prices and larger trade volumes, U.S. farm exports will likely end 2021 at record high levels of approximately $175 billion, following surprising growth in 2020. While most of the gains in U.S. ag exports in 2020 could be attributed to one market –China, and a few commodities – primarily corn, soybeans, and pork, export gains in 2021 were strong among most all of our major trading partners and across most ag commodities. Through October 2021, the value of U.S. corn exports has more than doubled, while U.S. beef exports are up 38%, forest products +28%, poultry +24%, dairy 18%, wheat +17%, soybeans +10%, and pork +8%. China remains the leading export market for U.S. agriculture, but the ag sector experienced strong demand in 2021 for U.S. ag commodities and food products from import markets like Mexico, Canada, Japan, and several other nations in Southeast Asia.
As a result of an improving farm economy, the U.S. farm balance reversed some concerning issues that surfaced from the economic downturn experienced in 2015-2019. Higher net farm income and continued low interest rates boosted land and other asset values in 2021, leading to improvements in many financial ratios, along with strengthening working capital, liquidity, and cash flow levels.
As for Kentucky, impressive grain crop yields, higher crop/livestock prices, and a strong equine market this past year are projected to boost Kentucky ag cash receipts to an estimated $6.75 billion in 2021, surpassing the record-high $6.5 billion set in 2014 and considerably higher than the $5.5 billion average over the past five years (2016-2020). Potential record-high state yields for corn and soybeans, coupled with strong market prices will enable these grain crops to rival poultry as Kentucky’s leading ag commodity for 2021.
Similar to the national trend, the government payments to Kentucky farmers will be significantly lower in 2021 versus 2020 when they approached nearly $700 million compared to an average of $183 million from 2015-2019. Despite much lower government payments and increased production costs, higher cash receipts will likely enable Kentucky net farm income to approach $2.5 billion in 2021, compared to averaging $1.7 billion for the proceeding five-year period.
U.S./Kentucky farmers will enter 2022 with commodity prices much higher than those recorded prior to the Covid-19 pandemic. Despite favorable commodity prices, the main concern confronting farmers as they begin planning for 2022 will be escalating farm input prices. After multiple years of relatively modest changes in farm input costs, farmers are bracing for the potential of double-digit percentage hikes in their overall cost of production, with much higher fuel, feed and fertilizer prices anticipated. Labor costs and supplies remain troublesome for not only farmers, but throughout the entire ag/food supply chain as well as the rest of the economy. Interest rates are still expected to remain relatively low for farmers in 2022, however, spiraling inflation may induce the Federal Reserve to take action to restrict money supplies and consequently boost interest rates to cool down inflation.
U.S. ag trade is expected to remain fairly robust in 2022, but this depends a lot on crop development in South America, how China responds following the ending of the two-year Phase I trade agreement signed in January 2020, and the outcome of the global economy amidst on-going COVID concerns and supply chain issues. In aggregate, the U.S./Kentucky farm economy still has a positive outlook for 2022, but profit margins are expected to narrow compared to 2021. Consequently, farmers will be advised to monitor input and commodity markets closely in developing purchasing and marketing strategies amidst this turbulent, volatile, and uncertain farm economy.
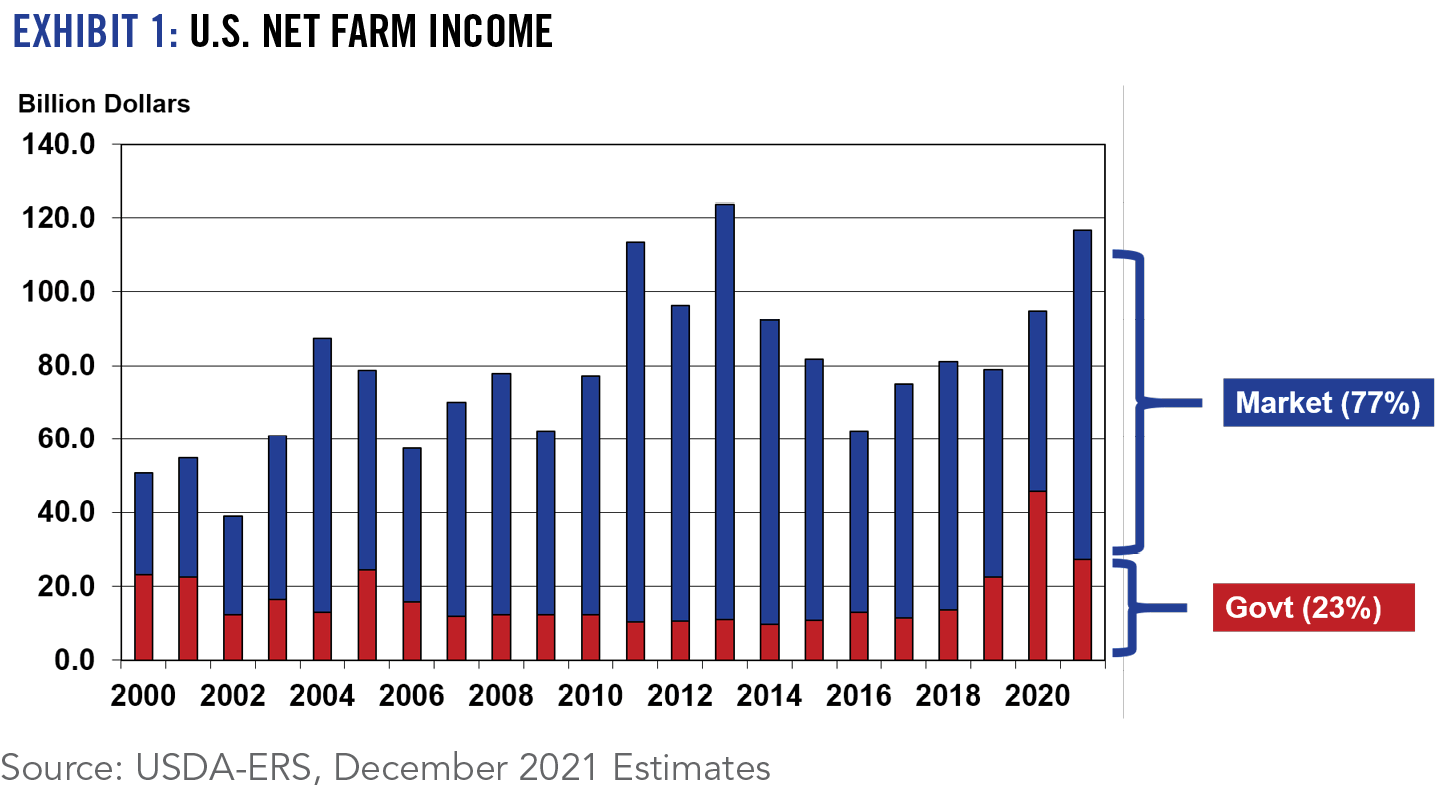
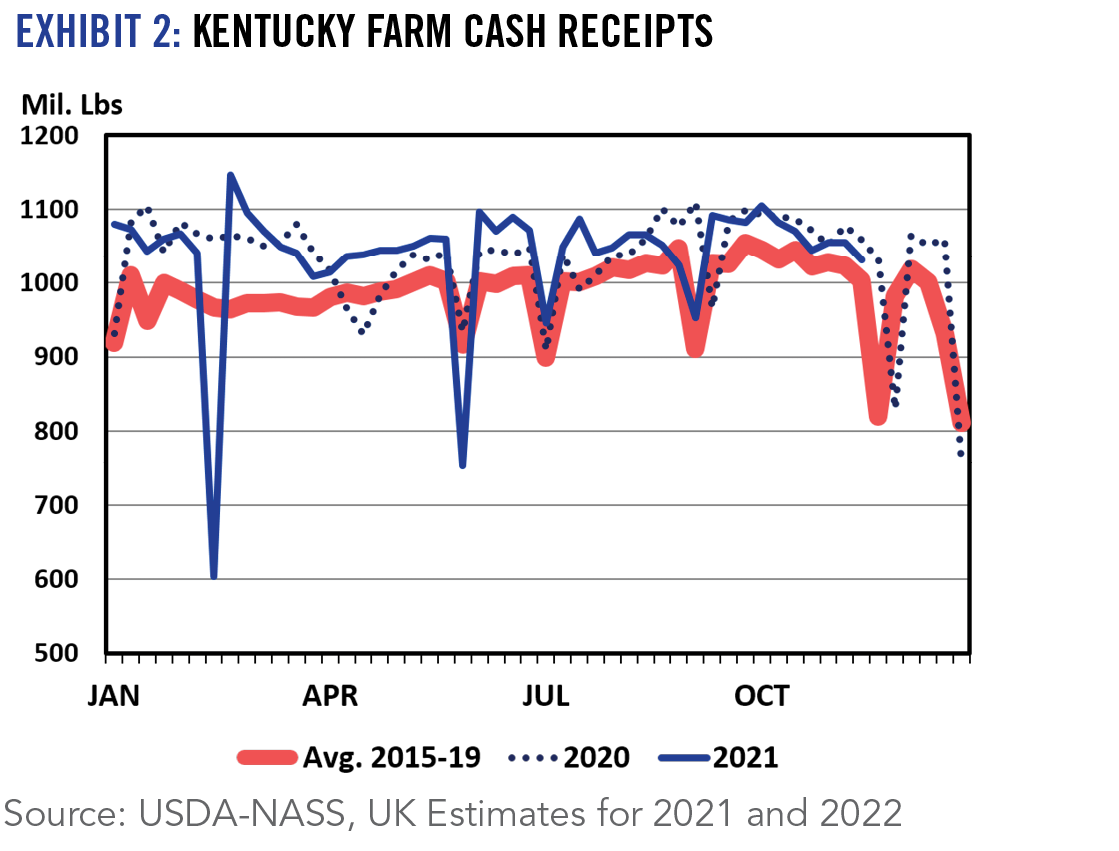
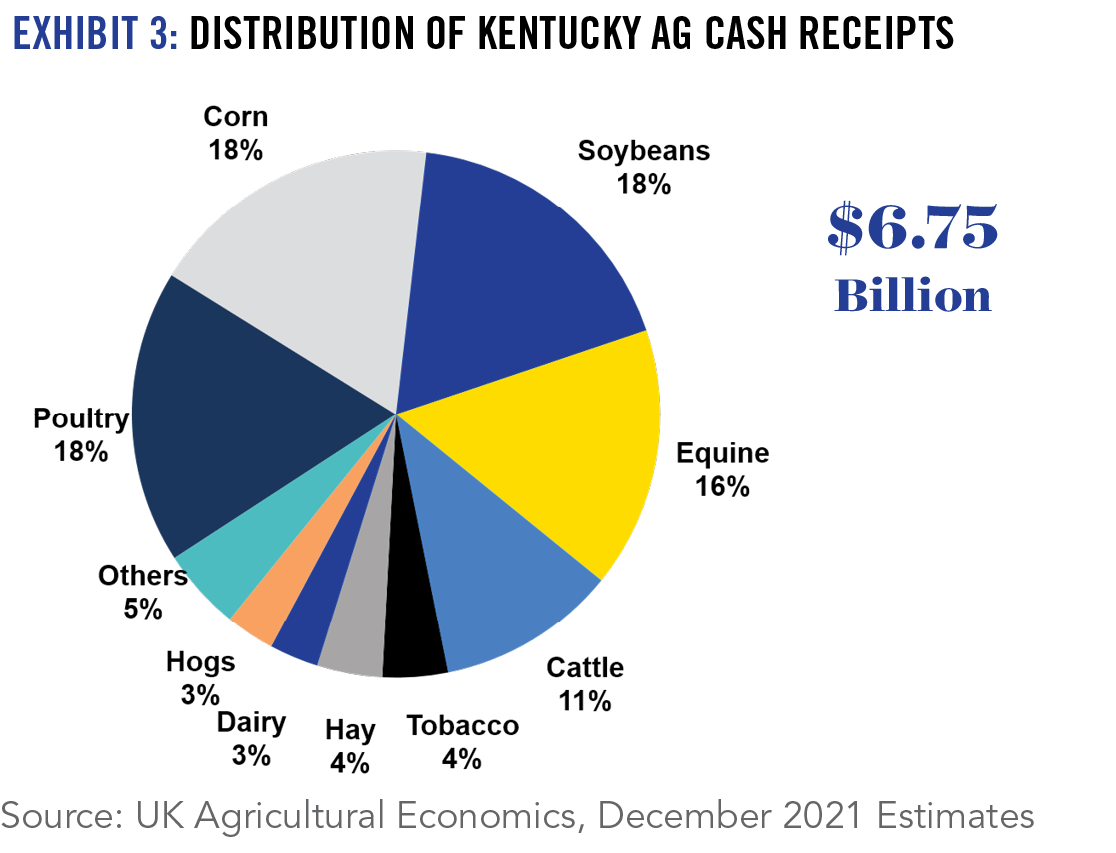
2021 Situation
Beef production was on track to reach its peak in 2020, but COVID-related processing challenges pushed some of that production in 2021. So, the supply of slaughter cattle was high for the first half of the year and fed cattle prices struggled. Finally in the fall, feedlots appeared to get more current and fed cattle prices rallied sharply. Beef export pace was also very swift for the year and should set an annual record by the time we turn the page on 2021.
In Kentucky, heavy feeder cattle prices improved a great deal through summer and fall and have been running over $10 per cwt above 2020 levels since July. The calf market has been the slowest to show improvement, but winter is always a challenging time to build momentum in calf markets. At the time of this writing (early December 2021), spring CME© feeder cattle futures contracts were trading in the upper $160’s. Despite the high feed prices, those spring price levels suggest potential for winter backgrounding programs at current calf prices.
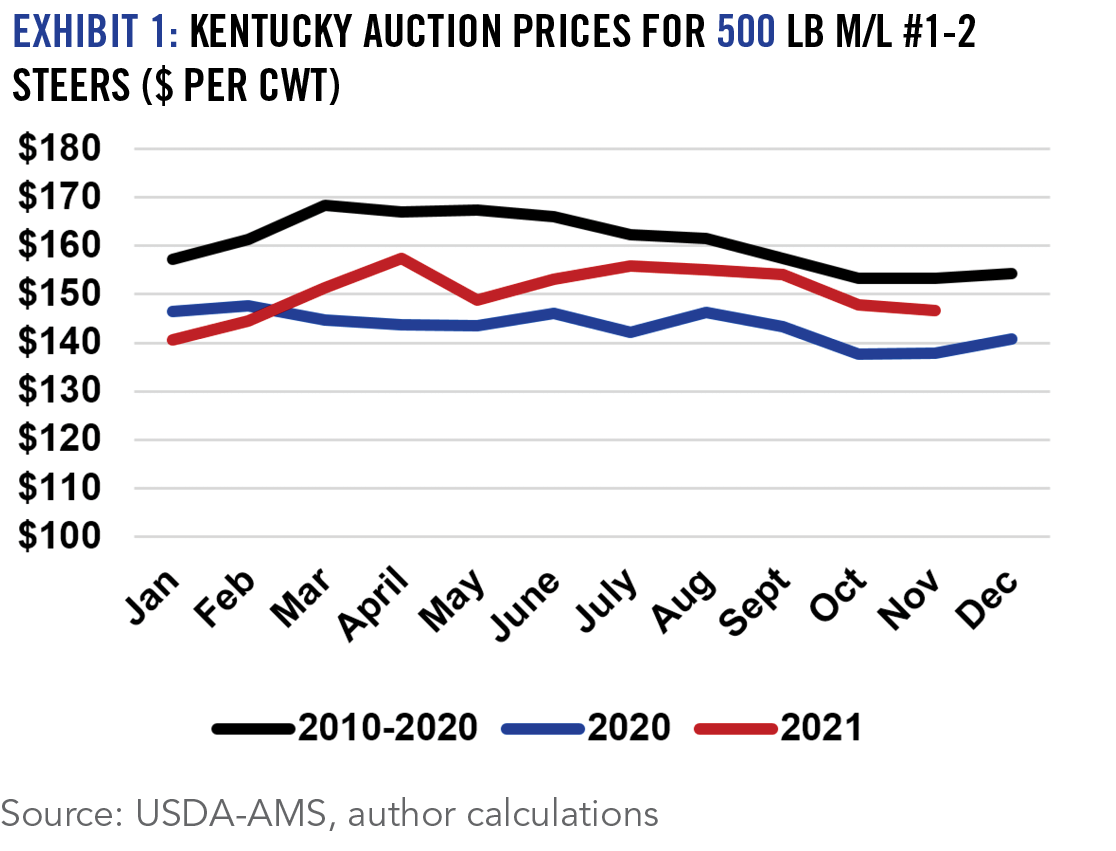
2022 Outlook
While COVID and the macroeconomy remain wildcards going forward, there is reason for optimism in 2022. It appears that we have moved through the largest fed cattle supplies of this cattle cycle and the cowherd continues to get smaller. Based on beef cow slaughter and heifer retention estimates, beef cow inventory should be down around 2% for the year. It is likely that we will see our best spring calf market since 2016. At the same time, feedlot preference will still be to place heavier cattle given high feed prices. This will keep value of gain high and should lead to good returns for growing operations, especially summer stockers.
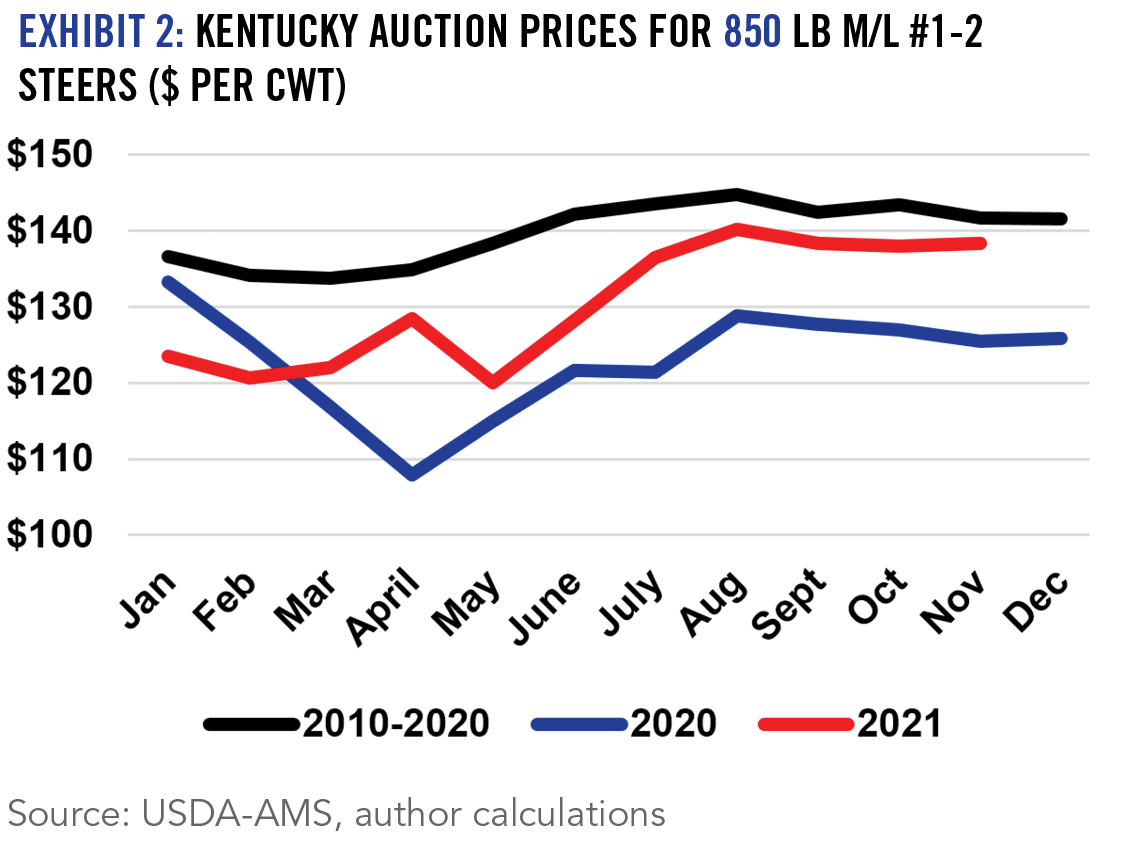
2021 Situation
Significant recovery was seen in broiler values, beginning in the fall of 2020 and continuing into 2021. Price improvement was seen across most all products, notably for breasts and wings, with wings reaching record highs. Year over year, the composite broiler value is up by more than 35%. Production for the year is likely going to be about 1% higher, which is less than normal for the broiler sector. The ice storm across the Southern region in February, and another sizeable decrease in production around Memorial Day, partially explain the slower than normal growth for the year. Both these impacts are clearly visible on the broiler production chart.
2022 Outlook
The price improvement that has been seen across the broiler sector has worked to strengthen the overall industry and is likely to remain steady in 2022. However, it does appear that production growth in the sector will be more moderate next year, comparable to what was seen in 2021. It is likely that some of this may be labor related as 2-3% annual increases in broiler production have been common in recent years. Regardless, the industry seems stable and opportunities for Kentucky producers will remain.
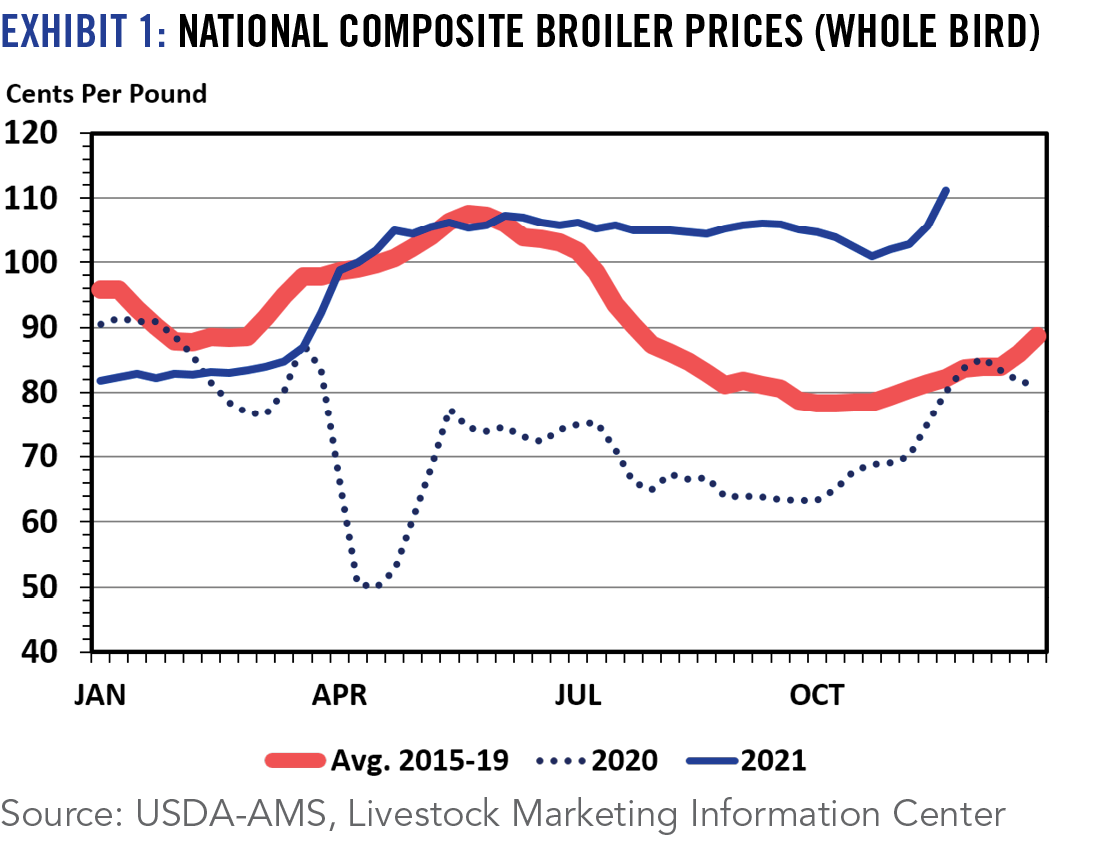
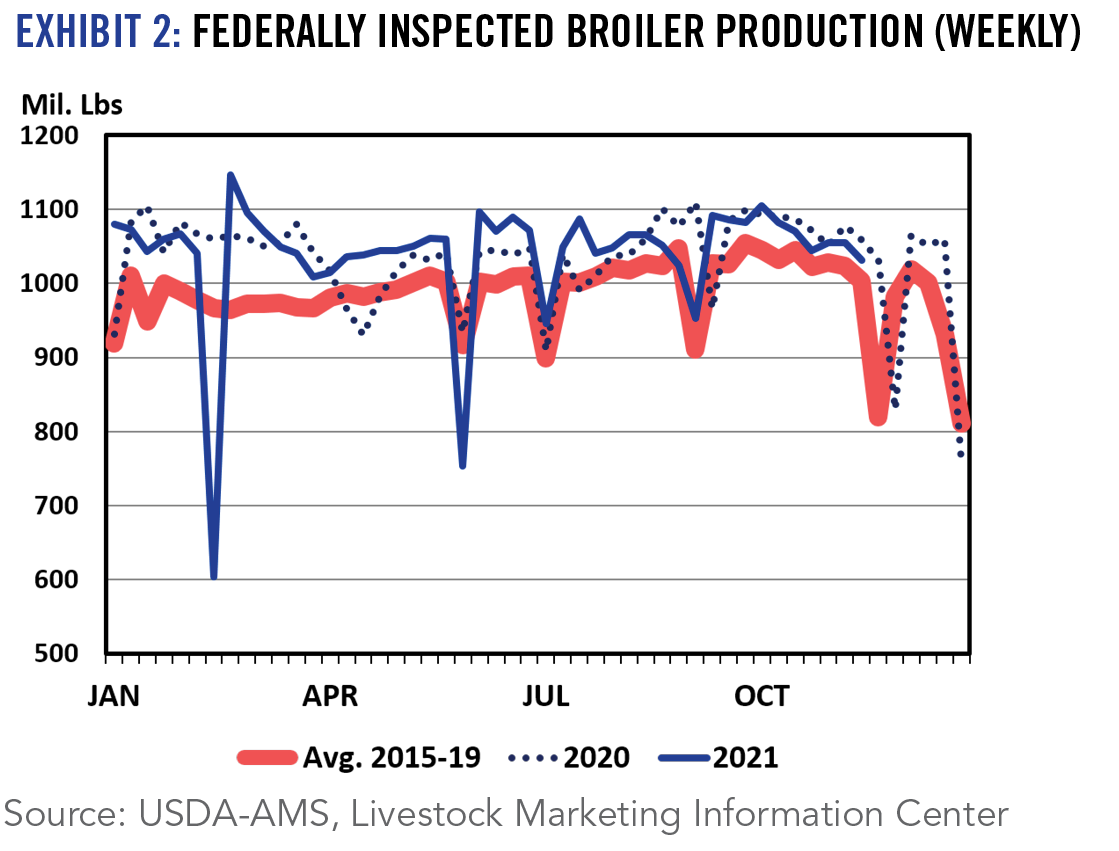
2021 Situation
Equine markets made a very impressive recovery in 2021, far exceeding most expectations early in the year. After being down 30% in 2020, annual sales receipts at Keeneland rose by 35% for the year. Given the COVID impacts on markets in 2020, it is likely that 2019 is a better year for comparison. Compared to two years ago, this year’s sales levels were off just 3.5% on considerably fewer horses being sold. It is worth noting that the sale average was higher in both the September yearling and November breeding stock sales than in 2019.
2022 Outlook
While it would be unrealistic to expect another year-over-year increase in magnitude like was seen in 2021, it certainly appears that equine markets are on firm footing. General recovery from COVID should continue, as should the impact of historical horse race (HHR) gaming on purses, which likely impacts values. These same factors should also impact stud fees in the upcoming season, which are another significant contributor to Kentucky equine receipts. While strong stud fees may be partially offset by a slight decrease in the number of mares bred in 2022, a moderate increase in equine receipts at the state level would appear likely.
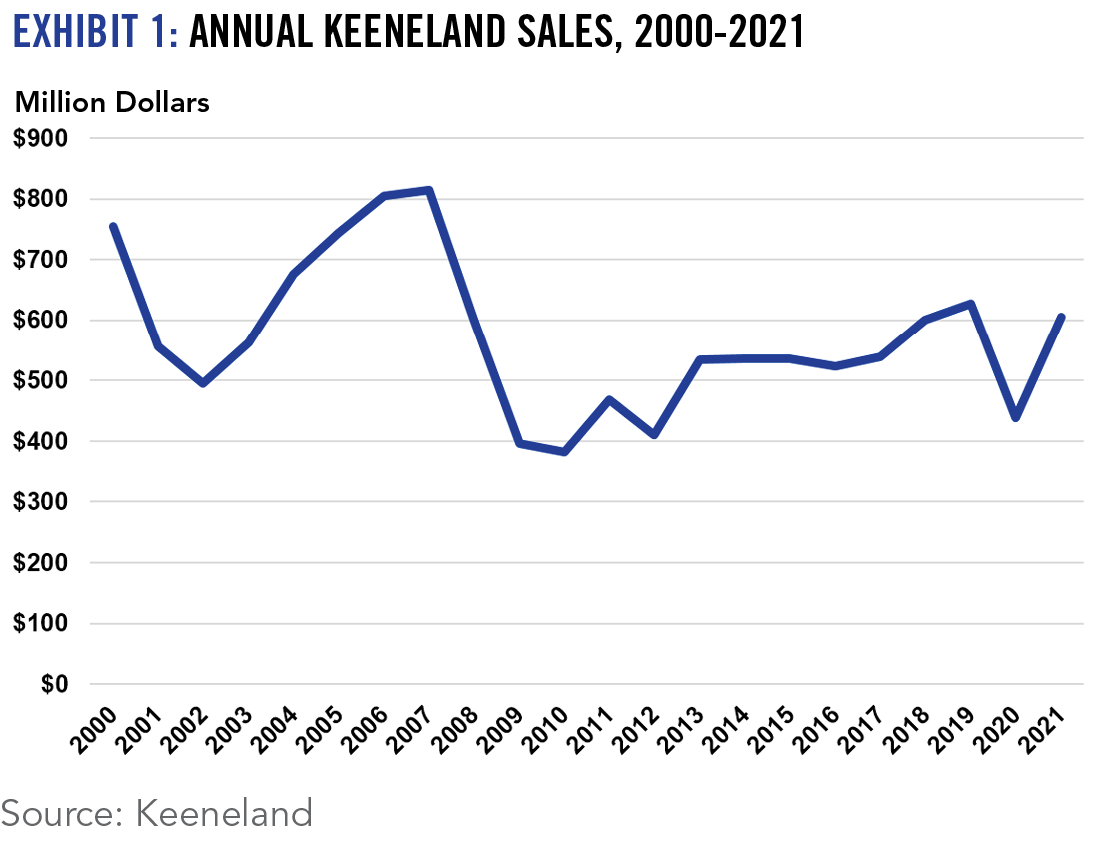
2021 Situation
Dairy cow inventory was growing as we entered 2021 and didn’t start to decrease until May. So, milk production was up for the year, especially during the second quarter. The U.S. All Milk price should average a little over $18 per cwt, which is not far from 2020 levels. Prices have been less volatile and the relationship between class III and class IV milk has been more normal. But, the story of 2021 is really less about milk price and more about feed costs, which are impacting dairy margins. To put this in perspective, from August 2020 to August 2021, the estimated ration cost for the Dairy Margin Coverage (DMC) program increased by $4.48 per cwt of milk produced.
2022 Outlook
Dairy cow numbers in 2022 should be comparable to what was seen in 2021. However, productivity gains are likely to result in about a 1% increase in milk production across the U.S. Kentucky farm level milk prices should average higher for the year in 2022, exceeding $20. However, feed prices are likely to continue to be the lead story. With feed prices at current levels, $20 milk will feel more like $16 milk and profitability concerns will remain, especially for smaller scale dairy operations.
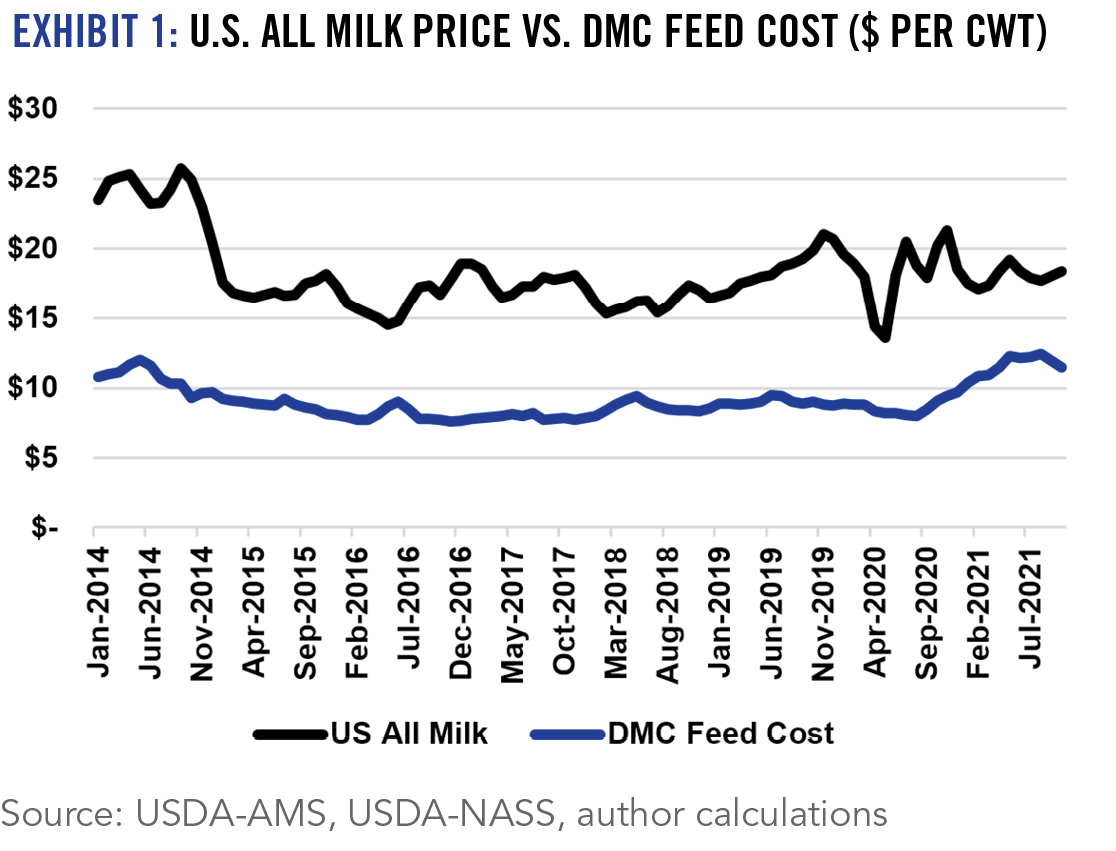
2021 Situation
In a lot of ways, 2021 looks like the 2020 that was expected for the hog market, had it not been for COVID-19. Production was actually down from 2020, but demand was strong, resulting in the strongest hog market we had seen since 2014. Eastern Corn Belt market formula hog prices will average in the low $90’s for the year, on a carcass weight basis, and were above $100 per cwt from April to August. Like all of the livestock sector, profitability was greatly impacted by feed costs, making overall price levels a bit misleading without that context. Expansion of contract hog production in Kentucky continued to grow.
2022 Outlook
Pork production for 2022 should be comparable to 2021. However, it continues to appear that China is rebuilding their hog inventory. Pork exports to China were down 37% for the first nine month of 2021, compared to the same period in 2020, and that is likely to continue into 2022. Hog prices should moderate, but remain at relatively high levels, from a historical perspective. But, as with all livestock species, feed prices for the coming year will reduce profitability.
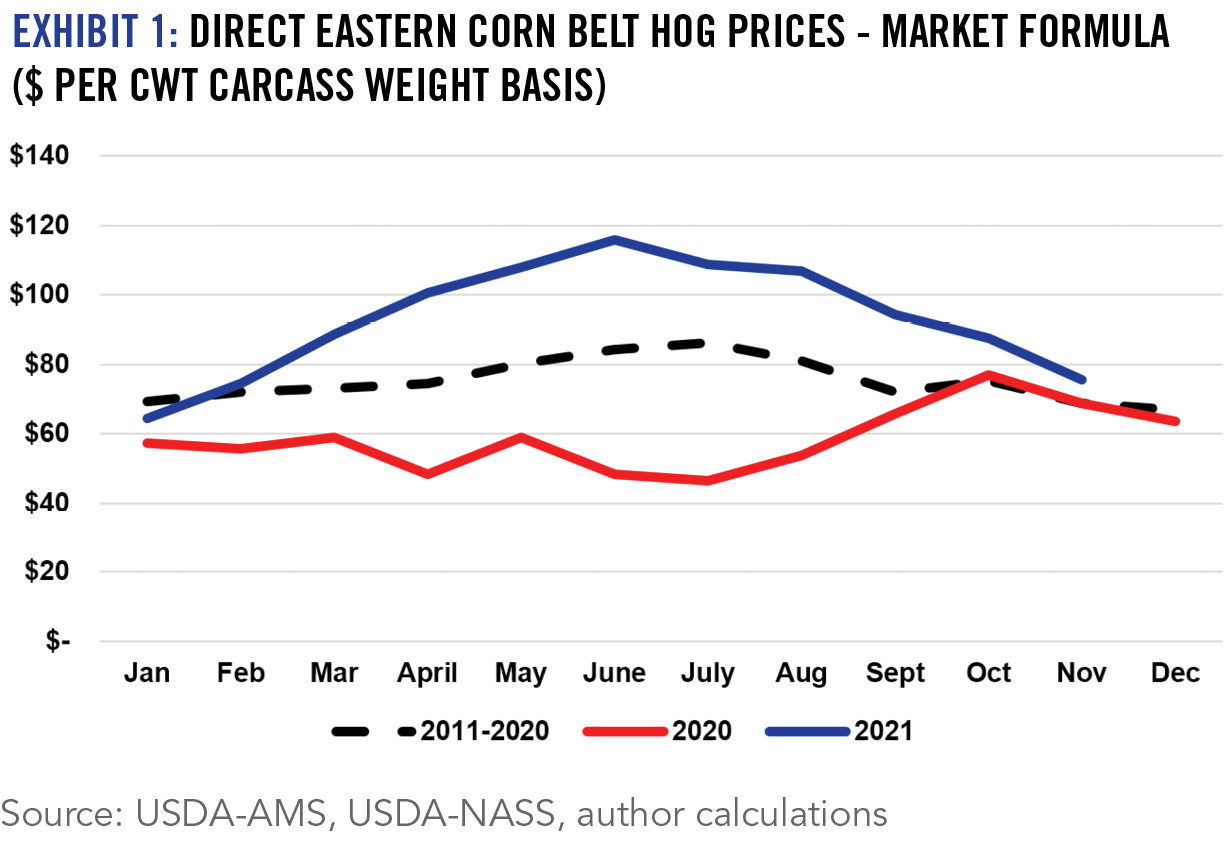
2021 Situation
Total production for the 2021 corn crop is projected to be 5% higher than the five-year average. Corn use for ethanol production is projected to be back at the five-year average after dipping in 2020 due to COVID. Livestock feed use is projected to increase 2%, and exports are projected to increase 10% compared to the five-year average. Given these changes and that initial stocks started out the marketing year at low levels, the USDA is projecting a 24% decrease ending stocks over the five-year average, pushing the expected US on-farm corn price up to $5.45/bu for the 2021-22 marketing year. In Kentucky, corn prices are $5.50-5.75/bu as of late-November, with forward contract prices jumping to $5.65-5.90/bu this winter in our better markets.
2022 Outlook
2022 harvest contract corn futures are up $1.50/bu from expectations a year ago, resulting in forward contract pricing of $5.00-5.30/bu for the 2022 new crop delivery. This would be an increase of approximately $260/acre for 175 bu/acre corn crop. Fertilizer prices have increased dramatically for the 2022 crop, resulting in approximately $100-125/acre increase over fertilizer prices for the 2021 corn crop.
2021 Situation
Total production for the 2021 soybean crop is projected to be 6% higher than the five-year average. U.S. soybean use is projected to be 6% higher than the five-year average, while soybean exports are projected to be 3% higher than the five-year average. The effect of these changes combined with low levels of initial stocks would be a 30% drop in soybean ending stocks over the 5-year average, pushing the expected U.S. on-farm soybean price up to $12.10/bu for the 2021-22 marketing year. In Kentucky, soybean prices are $12.20-12.45/bu as of late-November, with forward contract prices $12.25-12.50/bu this winter in our better markets.
2022 Outlook
2022 harvest contract soybean futures are up $2.35/bu from expectations a year ago, resulting in forward contract pricing of $11.70-12.00/bu for the 2022 new crop delivery. This would be an increase of approximately $130/acre for 55 bu/acre soybean crop. Fertilizer prices are up approximately $20-30/acre increase over prices for the 2021 soybean crop.
2021 Situation
Soft Red Winter Wheat production in 2021 increased 26% compared to the 5-year average. However, when combined with extremely low initial stocks, the resulting available supply going into the marketing year is down 3% from the 5-year average. Domestic use is projected to be up 12% and exports up 28%, for a total use increase of 17% over the 5-year average. Combined with the available supply, the resulting ending stocks are projected to be down 42% compared to the 5-year average. This has led to steep increases in price. In Kentucky, cash prices as of late-November are around $7.50-7.90/bu. Forward contract new crop prices (June/July) for 2022 in Kentucky are around $7.40-7.75/bu.
2022 Outlook
2022 harvest contract wheat futures are up $2.00/bu from expectations a year ago, resulting in forward contract pricing of $7.40-7.75/bu for the 2022 new crop delivery. This would be an increase of approximately $150/acre for 75 bu/acre wheat crop.
2021 Situation
Kentucky’s tobacco production is forecast by USDA to be 5% higher in 2021 on the heels of increased dark tobacco production. Burley production (down 5% in Kentucky and 4% nationally) was plagued with excessive rainfall in certain areas continuing the trend of disappointing yields in recent years. Demand for U.S. burley continues to fall as less expensive foreign leaf has induced U.S. burley exports to plummet while the burley import share continues to rise. After a year of fairly stable cigarette sales in 2020, U.S. cigarette consumption declines have accelerated in 2021 (down 7% as of late November), exceeding annual pre-COVID declines. Alternatively, dark tobacco demand continues to benefit from stable smokeless tobacco sales coupled with virtually non-existent foreign competition. Plus, the quality of the 2021 dark tobacco crop is described as “one of the best in years.” Prices for the smaller 2021 burley crop may average around $2.05/lb (vs $2.00/lb in 2020), with a fairly wide range of prices offered by the various tobacco companies. Dark tobacco prices for the 2021 crop remained relatively stable --mid $2.40s for dark air and mid $2.70s for dark fire-cured. In aggregate, the value of Kentucky tobacco production will total around $250 million compared to averaging $295 million over the past three years, with dark tobacco approaching one-half of the total value of the state’s tobacco crop.
2022 Outlook
Declining profit margins, labor challenges, and GAP requirements will likely continue to erode the grower base, but the decline in the number of farms growing tobacco may begin to stabilize in 2022. Despite declining demand, burley growers may not see much change in contract volume for 2022 coming off an anticipated short 2021 crop. The dark tobacco sector has made some supply adjustments in recent years to establish a more manageable supply/demand balance. Thus, the outcome for 2022 contract volume for dark tobacco growers will depend greatly on whether the relatively large 2021 crop forecast by USDA (72.3 million lbs nationally, or a 19% increase from 2020) actually materializes and company expectations of how future product sales may change amidst continued uncertainty on regulations, taxes, and emerging alternative tobacco product sales.
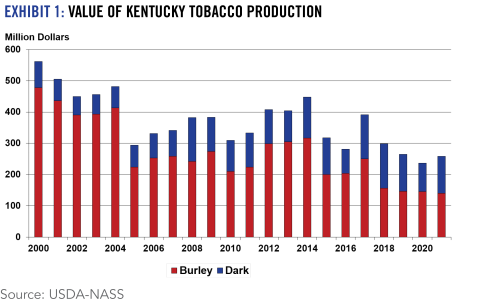
2021 Situation
The hemp industry continues to struggle to find its balance in the agricultural economy. As expected, the industry is still working through hemp inventories produced in 2019 and 2020, which have continued to suppress farm gate prices and significantly limited producers’ interest in growing the crop. In Kentucky, 1,675 acres of hemp were harvested in 2021 representing a 63% decrease over 2020. This decrease is consistent with hemp acreages across the U.S. Hemp production destined for the CBD market continues to dominate with 90% of Kentucky’s 2021 acres grown for this purpose. Seed/grain production decreased from 4% to 2.5% from 2020 to 2021 while hemp grown for fiber almost doubled, from 4% to 7.5%, over the same period.
2022 Outlook
Uncertainty around regulations, specifically THC content, approval for use in pet and livestock feed, inconsistent smokeable laws between states, and FDA approval continue to hinder growth in the hemp sector. Some processors continue to explore new marketing channels by focusing on cannabinoids other than CBD (i.e. CBG, CBN, etc.) or other THC attributes (i.e. delta 8,10). However, significant increases in hemp production are not expected until current stocks are processed (or destroyed because of storage issues) or demand shifts. Significant financial losses incurred by many hemp producers in the previous years will likely continue to deter production until market economics stabilize. Hemp continues to be a small sector of agriculture that still has a ways to go before stability is realized. In the meantime, hemp production continues to be risky and rife with uncertainty.
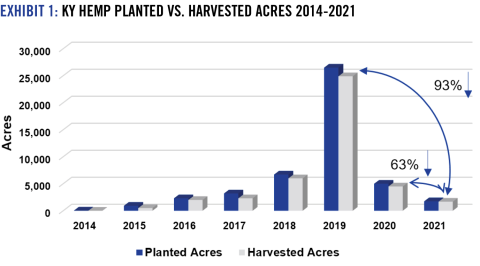
2021 Situation
Higher prices and good yields in specialty crops, which includes produce and nursery, will likely allow the sector to exceed the record revenues of 2020, but rising input costs will limit profitability and sector growth. 2021 cash receipts are expected to be at least $16 million for fruit, $44 million for vegetables and $118 million for nursery and greenhouse production.
2022 Outlook
Strong competitive pressures will continue from outside of the U.S. in the produce market. While Kentucky growers benefit from strong local demand, and strong local prices may remain in direct markets, import supply will continue to rise. Labor costs are a big constraint for this sector. Covid impacts have been challenging for a sector that typically has 30-40% of its production costs connected to labor.
The outlook for 2022 will continue to hinge on strong demand for local specialty crops. Recovering restaurants and other wholesale channels, including the produce auctions, will help support continued strong markets in direct-to-consumer platforms. Garden center demand in Kentucky will be expected to keep pace with the strong growth nationally, which includes a strong home improvement sector and consumer spending.
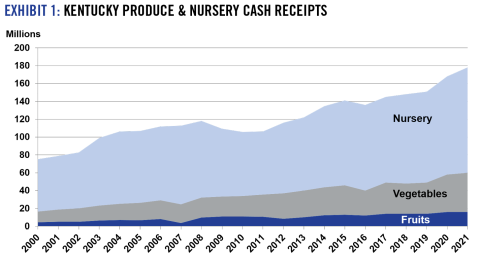
2021 Situation
2021 saw a sharp recovery in demand for hardwood timber and associated products compared to the soft markets experienced in 2019 and 2020. The uptick in domestic demand for wood products that caused substantial price increases in softwood construction products finally reached hardwood markets.
Kentucky has benefited as prices for Kentucky’s lumber have climbed dramatically in the first 6 months and remained stable throughout the year. Demand has outstripped supply across all species resulting in a 71% increase in hardwood lumber prices. The figure shows the unprecedented increase in prices for important species from November 2020 to November 2021. The increase in lumber price has direct bearing upon log prices resulting in a sellers markets for timber with landowners experiencing increases in stumpage value across the commonwealth.
2022 Outlook
Current lumber and timber demand will continue into 2022. Relatively high prices for tie logs used in manufacturing railway cross-ties, stave logs for barrel production, along with lumber logs is expected to continue resulting in higher prices paid for hardwood timber especially white oak, black walnut and yellow-poplar.
The uptick in demand resulted in an estimated overall economic contribution from the forest sector to Kentucky’s economy slightly shy of 14 billion dollars in 2021 with projected improvement in 2022. Exports are also expected to increase as the pandemic wanes and tariffs on wood exports to China are no longer in play. Unfortunately, historical pulpwood markets in southeast and western Kentucky have evaporated with the closing or restructuring of paper mills in Kentucky and Tennessee. While supply chain issues and labor shortages will continue to plague the industry, domestic demand should remain high, providing opportunities for landowners selling timber in 2022.
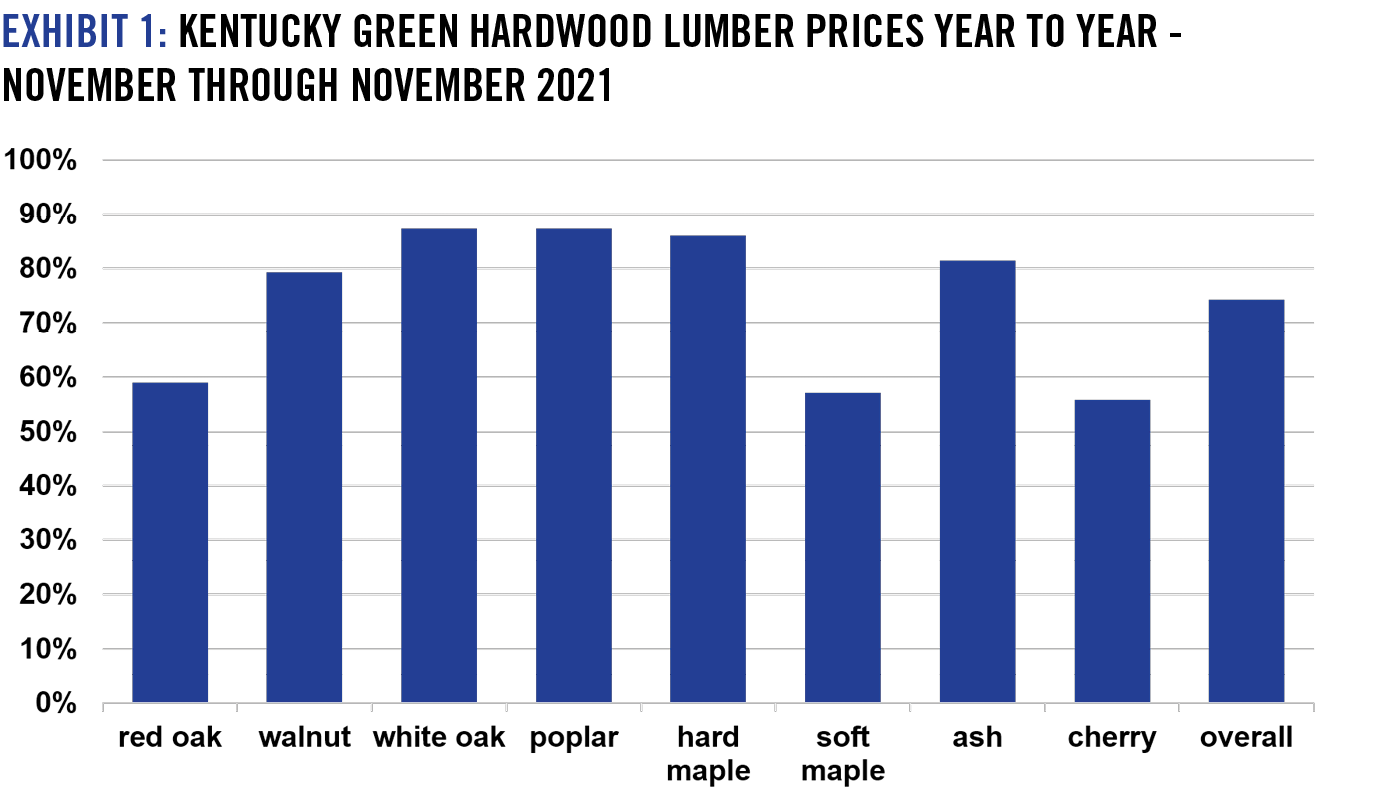
Impact of Net Farm Income on Kentucky Commercial Crop Farms
Rising net farm incomes over the last four years have put Kentucky crop farms in a very sound financial position coming out of 2020. Projections of higher yields and prices will push net farm income even higher, giving farm managers the opportunity to further solidify the farm’s financial health.
This is based on data from commercial-sized crop farms participating in the Kentucky Farm Business (KFBM) management program. For 2020, the average farm cropped 2,500 acres and employed 4 full-time employees. The average net farm income reached an all-time high of nearly $550,000 in 2020. Even farms in the lower third of income showed a profit in 2020.
Average family living expense was $71,964, down from $78,569 in 2019 as a result of COVID-19. This does not include income and self-employment taxes. Family living expense is expected to rise significantly for 2020 and to continue rising in line with the general economy.
Long-term financial health is reflected in the debt-to-asset ratio. A ratio of 30% or less is considered healthy as the farm’s assets are sufficient to support its liabilities. High and steady land values have supported an average 29% debt-to-asset ratio for the last five years. The ratio has been above 30% for the last 10 years for low-income farms, but improved to 30% in 2020.
Financial health in the short run is measured by the working capital ratio. It compares the amount of current assets required to pay principal due in the next year to the amount of current assets not obligated. A healthy ratio is 2:1 or more. The average farm has rebuilt working capital to a financially healthy 2:1 ratio in 2020 for the first time in seven years. Lower-income farms made great gains in reaching a 2:1 ratio and should have the opportunity to further strengthen that position this year.
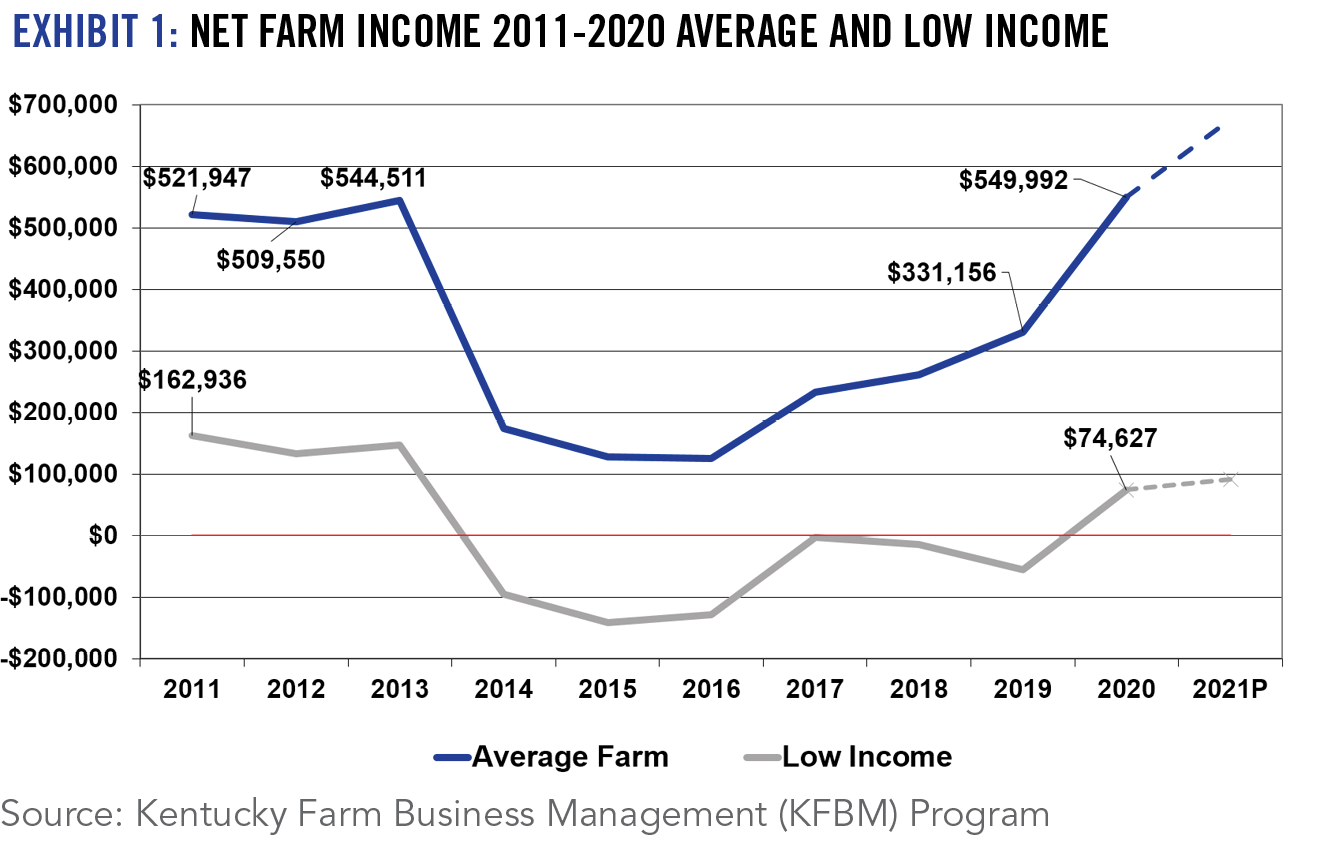
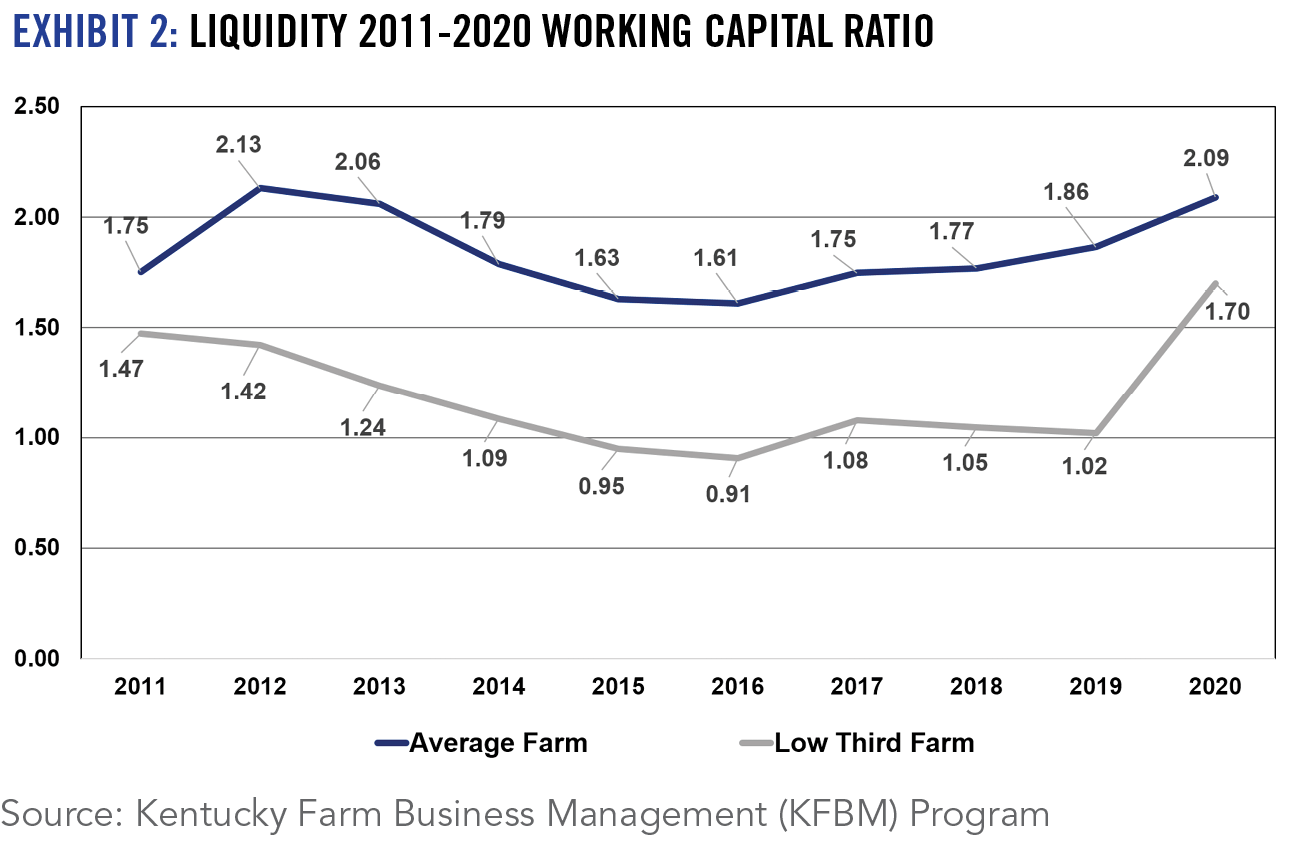
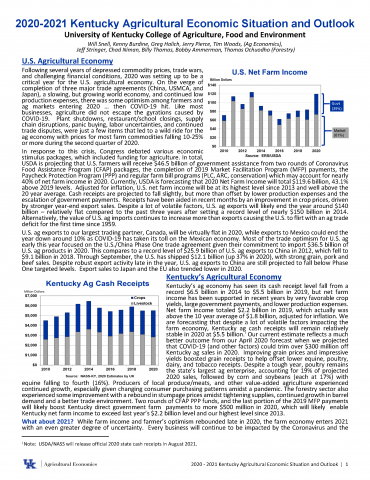
Following several years of depressed commodity prices, trade wars, and challenging financial conditions, 2020 was setting up to be a critical year for the U.S. agricultural economy. On the verge of completion of three major trade agreements (China, USMCA, and Japan), a slowing, but growing world economy, and continued low production expenses, there was some optimism among farmers and ag markets entering 2020 … then COVID-19 hit. Like most businesses, agriculture did not escape the gyrations caused by COVID-19. Plant shutdowns, restaurant/school closings, supply chain disruptions, panic buying, labor uncertainties, and continued trade disputes, were just a few items that led to a wild ride for the ag economy with prices for most farm commodities falling 10-25% or more during the second quarter of 2020.
In response to this crisis, Congress debated various economic stimulus packages, which included funding for agriculture. In total, USDA is projecting that U.S. farmers will receive $46.5 billion of government assistance from two rounds of Coronavirus Food Assistance Program (CFAP) packages, the completion of 2019 Market Facilitation Program (MFP) payments, the Paycheck Protection Program (PPP) and regular farm bill programs (PLC, ARC, conservation) which may account for nearly 40%f of net farm income in 2020. Currently, USDA is forecasting that 2020 Net Farm Income will total $119.6 billion, 43.1% above 2019 levels. Adjusted for inflation, U.S. net farm income will be at its highest level since 2014 and well above the 20 year average. Cash receipts are projected to fall slightly, but more than offset by lower production expenses and the escalation of government payments. Receipts have been aided in recent months by an improvement in crop prices, driven by stronger year-end export sales. Despite a lot of volatile factors, U.S. ag exports will likely end the year around $140 billion – relatively flat compared to the past three years after setting a record level of nearly $150 billion in 2014. Alternatively, the value of U.S. ag imports continues to increase causing the U.S. to flirt with an ag trade deficit for the first time since 1959.
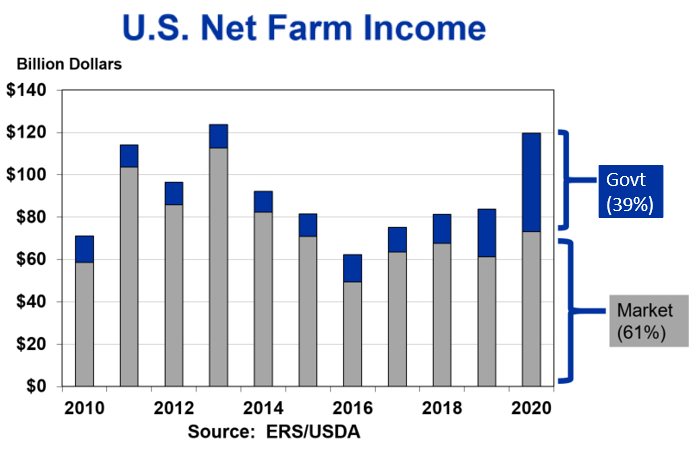
U.S. ag exports to our largest trading partner, Canada, will be virtually flat in 2020, while exports to Mexico could end the year down 10% or more as COVID-19 has taken its toll on the Mexican economy. Most of the trade optimism for U.S. ag early this year focused on the U.S./China Phase One trade agreement given their commitment to import $36.5 billion of U.S. ag products in 2020. This compares to a record level of $25.9 billion of U.S. ag exports to China in 2012, which fell to $9.1 billion in 2018. Through September, the U.S. has shipped $10.7 billion (up 37% in 2020), with strong grain, pork and beef sales. Despite robust export activity late in the year, U.S. ag exports to China are still projected to fall below Phase One targeted levels. Export sales to Japan and the EU also trended lower in 2020.
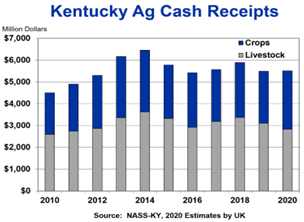
The financial condition of the average commercial-sized Kentucky crop farm began 2020 in much better financial shape than in previous years. This is part of a three-year trend of increasing net farm income that has enabled these farms to build working capital. The projected increase in net farm income for 2020 will provide an opportunity for farmers to further improve their financial condition in face of uncertainty in 2021. Net farm income is projected to be higher because of higher-than-normal yields, a sharp rise in commodity prices at the end of harvest, and large government supplemental payments. Observations are based on commercial-size crop farms participating in the Kentucky Farm Business Management program.
Cattle
Despite optimism coming into 2020, COVID’s demand and supply chain disruptions rocked cattle markets, especially in spring and summer. The backlog of fed cattle that was created by lower spring harvest levels pressured prices all through the marketing chain. Heavy feeder cattle prices decreased by more than $25 per cwt from January to April, but did manage to gain a good portion of that back by early fall. Calf markets failed to see their typical spring run-up and fall prices have been very close to 2019 levels. Cull cow and bull markets were a relative bright spot as less harvest volume impacts were seen in those markets and ground beef demand benefited from increased at-home consumption. Assuming that COVID impacts lessen in 2021, improvements should be seen in both domestic and international beef demand. This, combined with a smaller calf crop should pave the way for price some improvement next year. 550 lb steer calves are likely to average in the $160’s by spring and should hold the $140’s in the fall on a state average basis, with groups and higher quality calves selling at considerable premiums.
Poultry
Kentucky’s poultry sector has generally continued to grow in size for many years and this was again the case coming in to 2020. But, poultry markets were impacted by COVID and wholesale broiler prices will likely be down nearly 20% for the year. Interestingly, egg prices have been higher for 2020 and rose considerably during the early stages of the pandemic. In reality, the vast majority of Kentucky’s contract poultry producers are somewhat isolated from these market impacts. However, they are impacted by increases in time between flocks as integrators adjust to market signals, which was the case for many growers this year. While 2020 brought challenges, growth is likely to continue over time, and 2021 should be a much improved year for the sector.
Hogs
With general optimism about trade, and continued concern over African Swine Fever in China, the hog industry came into 2020 expecting a solid year. USDA inventory estimates also suggested increased hog numbers in the Commonwealth for 2020, with much of the increase in contract integrated operations. Eastern Cornbelt hog prices mirrored 2019 for the first three months of the year before COVID’s impact on demand and processing took its toll. Prices fell by more than 40% from March to July and 2020 actually saw seasonal lows around the time the hog market typically makes its highs. However, prices have rallied since summer and set up for a much better 4th quarter. While reports continue to suggest China is rebuilding hog numbers, potential for strong exports and improved domestic demand exist for 2021, and hog producers should see a much better year. Eastern Cornbelt hog prices should start 2021 in the $60’s on a carcass weight basis, but find the $70’s by summer.
Equine
After exceeding $1 billion in both 2018 and 2019, Kentucky farm level equine receipts will drop considerably in 2020. Both the number of horses sold and median prices were down in yearling and breeding stock sales. While the timing of COVID likely had limited impact on stud fees in 2020, stud fees are likely to decline on average in 2021. It is almost a certainty that sale values will continue to be depressed into next year as well. While the market for upper-tier horses has the potential to stay relatively strong, impacts are likely to be felt across the vast majority of the equine market. When sales value, stud fees, and continued declines in the number of mares bred are considered, KY equine receipts will likely be even lower in 2021.
Dairy
Kentucky came into 2020 with another decrease in dairy cow numbers and dairy producers have dealt with an extremely volatile market. The US All Milk price for the first nine months of the year ranged from a low of $13.60 per cwt in May to a high of $20.50 in July. Much of the volatility has been driven by large swings in cheese prices, which have considerable impact on farm level milk prices. Additionally, the 2019 change in the way that the base skim milk pricing factor was calculated, combined with de-pooling in response to higher class III prices, greatly impacted producer price differentials for much of the year. Producers have received some help in the form of Coronavirus Food Assistance Program (CFAP) payments and the Dairy Margin Coverage (DMC) program. But, increasing feed prices have also cut into returns this fall. Looking ahead, indicators suggest that the dairy herd is growing at the national level, which means increased production is likely for 2021. Given this, demand for dairy products will have to improve for producers to see widespread price improvement in the coming year. A farm level milk price range of $17-19 per cwt would seem realistic for 2021.
Corn
Total production for the 2020 corn crop is projected to be just 2% higher than the five-year average. Corn use for ethanol production is projected to be 5% lower than the five-year average, but is roughly balanced by a projected 5% increase in livestock feed use. The biggest change expected for the 2020-21 marketing year is a significant increase in corn exports, projected to be 27% higher than the five-year average. The combined affect would be an 18% drop in corn ending stocks over the five-year average, pushing the expected U.S. on-farm corn price up to $4.00/bu for the 2020-21 marketing year, compared to the five-year average of $3.50/bu. This would be the highest average on-farm corn price seen since 2013. Projected corn prices for the 2021-22 marketing year also look strong, with U.S. on-farm prices in the $3.85-3.95/bu range. This would be about $.40/bu higher than the five-year average. In Kentucky, corn prices are $3.70-3.90/bu as of mid-November, with forward contracting prices jumping to $4.10-4.40/bu this winter in our better markets.
Soybeans
Total production for the 2020 soybean crop is projected to be just 1% higher than the five-year average. U.S. soybean use are projected to be 8% higher than the five-year average, while soybean exports are projected to be 14% higher than the five-year average. The combined effect of this increased usage would be a 60% drop in soybean ending stocks over the 5-year average, pushing the expected U.S. on-farm soybean price up to $10.40/bu for the 2020-21 marketing year, compared to the five-year average of $8.96/bu. As with corn, this would be the highest average on-farm soybean price seen since 2013. Projected soybean prices for the 2021-22 marketing year also look strong. Futures prices for the 2021 crop are roughly $1.00/bu below the 2020 crop, and would likely result in U.S. on-farm prices of around $10/bu for the 2021-22 crop marketing year. Although lower than projected for 2020-21, this would be over $1.00/bu higher than the five-year soybean price average. In Kentucky, soybean prices are $10.80-11.10/bu as of mid-November, with forward contracting prices jumping to $11.20-11.90/bu this winter in our better markets.
Wheat
Soft Red Winter Wheat production in 2020 increased 11% from 2019 but is still 13% below the 5-year average. Combined with low initial stocks, the resulting available supply going into the marketing year is down 24% from the 5-year average. Domestic use is projected to be down 7% and exports down 28%, for a total use reduction of 14% over the 5-year average. However, given that the available supply is down 24%, the resulting ending stocks are projected to be only 40% of the 5-year average. This has led to steep increases in price, up around $1.00/bu since June. In Kentucky, cash prices as of mid-November and forward contracting prices through the winter are both around $6/bu, prices that have not been observed in years. Forward contract new crop prices (June/July) for 2021 in Kentucky are also around $6/bu.
Tobacco
Kentucky’s tobacco sector continued to shrink in 2020 amidst contract volume reductions in response to slumping export markets, imports, lower cigarette sales, and a surplus of dark tobacco stocks. Tobacco acres are projected to be down around 15% in 2020 with yields highly variable across the state. Even with slightly higher market prices, the value of Kentucky tobacco production may fall from $268 million in 2019 to around $225 to $235 million versus averaging $311 million over the past five years. Kentucky tobacco growers did benefit from being a part of CFAP payments, expected to total more than $20 million, along with an expansion in Connecticut broadleaf (cigar) tobacco acres. The reduction in domestic cigarette sales moderated in 2020, snuff consumption was stable, while the growth in vaping products moderated. Despite anticipated lower tobacco product sales and sluggish exports, contract volumes for the coming year may remain relatively stable or could actually increase for some individual growers as leaf stocks are ending 2020 fairly tight and frustrated growers exit. Profit margins will likely continue to be squeezed with higher labor costs, GAP requirements, limited yield gains, and stagnant leaf prices, resulting in continued concentration among growers. Uncertainty on issues such as restricting nicotine levels/flavorings, taxes, immigration, trade, and emerging non-combustible tobacco products will continue to dampen the outlook for the remaining Kentucky tobacco growers.
Hemp
Kentucky’s hemp industry took a major pullback in 2020 in response to experiences “learned” from the 2019 crop, characterized by a dramatic drop in prices, unsold stocks, limited processing capacity, regulatory uncertainty, and overall production/marketing frustrations. KDA reported farm sales totaling $51.3 million in 2019, up from $17.8 million in 2018 and $7.5 million in 2017. While the number of grower licenses issued in Kentucky remained stable (960 in 2020 vs 978 in 2019) around 160 licensees indicated that they would not plant a crop in 2020 in hopes of finding a buyer for their unsold inventory from previous years. Licensed hemp acres in Kentucky for 2020 totaled 32,000 acres (following a record high 60,000 acres in 2019), with planted acres reportedly around 5,000 (95% for CBD). Nationally, licensed hemp acres fell an estimated 20-30% in 2020 (vs over 500,000 licensed (250,000 planted) acres in 2019, while the number of hemp licenses issued actually increased. Despite the dramatic cut in acres, a glut of stocks remains with supply chain challenges and company bankruptcies. Given CBD challenges, there appears to be a growing interest nationally in hemp grain and fiber production, but increasing corn/soy prices and processing issues may hinder expansion. The downward spiral in farm-level prices has moderated in recent months, with Kentucky hemp biomass price averaging $0.63/%CBD, conventional grain prices, $0.45-$0.55/lb, organic grain prices, $1.00-$1.25)/lb, and fiber, $0.05-$0.12/lb. Low price expectations in conjunction with unsold stocks, market and regulatory uncertainty, and minimal infrastructure development will likely keep acreage and enthusiasm down in 2021 as the emerging industry works off excess supplies and adjusts to changing market/regulatory conditions.
Fruits, Vegetables, Greenhouse
Horticulture markets in Kentucky are made up of many pieces and cash receipts, especially in the current environment, are difficult to monitor. Costs are up, especially labor and Covid compliance. But revenues are also up for the most part – although some relatively wide swings in a number of our traditional direct markets. Direct to restaurant and school sales were down substantially. Farm markets sales were up a little, with CSA and agritourism sales up significantly. However, wineries were hit hard with limits to on-site tasting. Auctions were up considerably, approximately 25% YOY. Garden center sales were higher with retail nursery sales noted to be around 20% higher nationally with wholesale nursery up slightly less. Although early for final 2020 estimates, total produce and nursery cash receipts will likely be at record levels for Kentucky, approaching $160 million.
Forestry
Timber and lumber markets improved in 2020 compared to 2018-2019. While the removal of tariffs on hardwood exports into China has increased log and lumber prices for red oak and white oak continues to be high demand for barrels and other products, the health of individual industries varies considerably. One key issue is the shortage of logs. This is a consequence of low timber prices in 2018-19 that resulted in a reduction in timber sales. Ultimately, this has played a role in decreasing logging capacity, reducing log supply and log inventories at mills going into winter. The increasing demand for logs to satisfy lumber and other wood product orders and the limited supply of logs has created a seller’s market for timber with overall stumpage prices increasing, a trend which is expected to continue into 2021. On a negative note, the recent and unexpected closure of a pulp and paper facility in eastern TN (Kingsport) and the continued lack of strong pulpwood market in western Kentucky negatively impacts landowners’ timber value and the ability to perform good forest management. In summary, the forestry sector contributed $12.9 billion in total output to Kentucky’s economy and we expect this contribution to remain steady with stumpage values continuing to improve in 2021 providing opportunities for landowners to sell timber. However, we remain concerned over logging capacity, the long-term health of small mill operations, and lack of markets for low grade pulpwood across the state.
Contributing authors: Dr. Jeff Stringer, Chad Niman, Billy Thomas, Bobby Ammerman, Dr. Thomas Ochuodho of the Department of Forestry and Natural Resources.
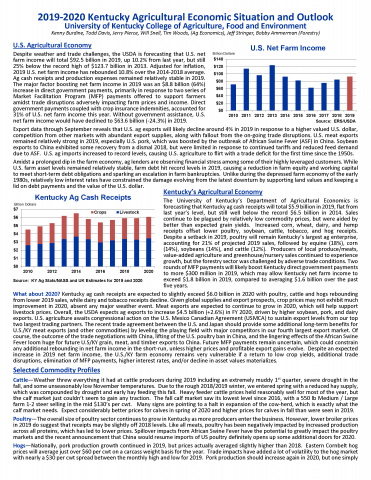
U.S. Agricultural Economy
Despite weather and trade challenges, the USDA is forecasting that U.S. net farm income will total $92.5 billion in 2019, up 10.2% from last year, but still 25% below the record high of $123.7 billion in 2013. Adjusted for inflation, 2019 U.S. net farm income has rebounded 10.8% over the 2014-2018 average. Ag cash receipts and production expenses remained relatively stable in 2019. The major factor boosting net farm income in 2019 was an $8.8 billion (64%) increase in direct government payments, primarily in response to two series of Market Facilitation Program (MFP) payments offered to support farmers amidst trade disruptions adversely impacting farm prices and income. Direct government payments coupled with crop insurance indemnities, accounted for 31% of U.S. net farm income this year. Without government assistance, U.S. net farm income would have declined to $63.6 billion (-24.3%) in 2019.
Export data through September reveals that U.S. ag exports will likely decline around 4% in 2019 in response to a higher valued U.S. dollar, competition from other markets with abundant export supplies, along with fallout from the on-going trade disruptions. U.S. meat exports remained relatively strong in 2019, especially U.S. pork, which was boosted by the outbreak of African Swine Fever (ASF) in China. Soybean exports to China exhibited some recovery from a dismal 2018, but were limited in response to continued tariffs and reduced feed demand due to ASF. U.S. ag imports increased to record levels, causing U.S. agriculture to flirt with a trade deficit for the first time since the 1950s.
Amidst a prolonged dip in the farm economy, ag lenders are observing financial stress among some of their highly leveraged customers. While U.S. farm asset levels remained relatively stable, farm debt hit record levels in 2019, causing a reduction in farm equity and working capital to meet short-term debt obligations and sparking an escalation in farm bankruptcies. Unlike during the depressed farm economy of the early 1980s, relatively low interest rates have constrained the damage evolving from the latest downturn by supporting land values and keeping a lid on debt payments and the value of the U.S. dollar.
Kentucky’s Agricultural Economy
The University of Kentucky’s Department of Agricultural Economics is forecasting that Kentucky ag cash receipts will total $5.9 billion in 2019, flat from last year’s level, but still well below the record $6.5 billion in 2014. Sales continue to be plagued by relatively low commodity prices, but were aided by better than expected grain yields. Increased corn, wheat, dairy, and hemp receipts offset lower poultry, soybean, cattle, tobacco, and hog receipts. Despite a setback in 2019, poultry will remain Kentucky’s largest ag enterprise, accounting for 21% of projected 2019 sales, followed by equine (18%), corn (14%), soybeans (14%), and cattle (12%). Producers of local produce/meats, value-added agriculture and greenhouse/nursery sales continued to experience growth, but the forestry sector was challenged by adverse trade conditions. Two rounds of MFP payments will likely boost Kentucky direct government payments to more $300 million in 2019, which may allow Kentucky net farm income to exceed $1.8 billion in 2019, compared to averaging $1.6 billion over the past five years.
What about 2020? Kentucky ag cash receipts are expected to slightly exceed $6.0 billion in 2020 with poultry, cattle and hogs rebounding from lower 2019 sales, while dairy and tobacco receipts decline. Given global supplies and export prospects, crop prices may not exhibit much improvement in 2020, absent any major weather event. Meat exports are expected to continue to grow in 2020, which will help support livestock prices. Overall, the USDA expects ag exports to increase $4.5 billion (+2.6%) in FY 2020, driven by higher soybean, pork, and dairy exports. U.S. agriculture awaits congressional action on the U.S. Mexico Canadian Agreement (USMCA) to sustain export levels from our top two largest trading partners. The recent trade agreement between the U.S. and Japan should provide some additional long-term benefits for U.S./KY meat exports (and other commodities) by leveling the playing field with major competitors in our fourth largest export market. Of course, the outcome of the trade negotiations with China, lifting of the U.S. poultry ban in China, and the lingering effects of the African Swine Fever loom huge for future U.S/KY grain, meat, and timber exports to China. Future MFP payments remain uncertain, which could constrain any additional rebounding in net farm income in the short-run, unless higher prices and profitable export gains evolve. Despite an expected increase in 2019 net farm income, the U.S./KY farm economy remains very vulnerable if a return to low crop yields, additional trade disruptions, elimination of MFP payments, higher interest rates, and/or decline in asset values materializes.
Cattle—Weather threw everything it had at cattle producers during 2019 including an extremely muddy 1st quarter, severe drought in the fall, and some unseasonably low November temperatures. Due to the rough 2018/2019 winter, we entered spring with a reduced hay supply, which was compounded by drought and early hay feeding this fall. Heavy feeder cattle prices held reasonably well for most of the year, but the calf market just couldn’t seem to gain any traction. The fall calf market saw its lowest level since 2016, with a 550 lb Medium / Large farm 1-2 steer selling in the mid $130’s per cwt. Many signs are pointing to a halt in expansion of the cow-herd, which is exactly what the calf market needs. Expect considerably better prices for calves in spring of 2020 and higher prices for calves in fall than were seen in 2019.
Poultry—The overall size of poultry sector continues to grow in Kentucky as more producers enter the business. However, lower broiler prices in 2019 do suggest that receipts may be slightly off 2018 levels. Like all meats, poultry has been negatively impacted by increased production across all proteins, which has led to lower prices. Spillover impacts from African Swine Fever have the potential to greatly impact the poultry markets and the recent announcement that China would resume imports of US poultry definitely opens up some additional doors for 2020.
Hogs—Nationally, pork production growth continued in 2019, but prices actually averaged slightly higher than 2018. Eastern Cornbelt hog prices will average just over $60 per cwt on a carcass weight basis for the year. Trade impacts have added a lot of volatility to the hog market with nearly a $30 per cwt spread between the monthly high and low for 2019. Pork production should increase again in 2020, but one simply cannot overstate the significance of African Swine Fever on the Chinese hog sector and pork exports to China have been steadily increasing through the year as a result. Prospects are for significantly better prices in 2020 and this is likely to spill over into all meat markets.
Equine—Kentucky equine receipts should increase in 2019 for the third straight year. On a percentage basis, the increase is likely to be smaller than 2018, but another year exceeding $1 billion is very welcome news. A relatively strong economy likely supported both sales and stud fees for 2019. The Keeneland September yearling sale was down slightly from 2018, but total sales were actually higher, largely due to the strength of the November breeding stock sale. Provided economic conditions don’t drastically change, this strength should continue into 2020.
Dary—After a brutal year in 2018 that saw a continued decline in Kentucky dairy numbers, things did improve somewhat during 2019, as US All Milk price increased by a little more than $2 per cwt for the year. Most of the improvement in price occurred in the second half of the year. The year 2019 also marked the first year of the Dairy Margin Coverage (DMC) program, which replaced the Margin Protection Program for Dairy. The new DMC program offers higher coverage levels, lower premiums, and provided margin support January through July.
Corn—U.S. planted and harvested area of corn increased by +.8 and 0.1 million acres, respectively, from 2018. The potential yield of 167 bushels/acre produced a U.S. corn crop totaling 13.6 billion, which is a 759 million bushel reduction from 2018. Total corn supply is projected to be 763 million bushels smaller than last year because of the slightly smaller carry-in. Total corn use is projected to be 559 million bushels smaller due to reduced exports and reduced feed/residual demand. Ending stocks are projected to be trimmed by 204 million bushels, which would support a higher U.S. marketing year average farm price of $3.85/bushel. The USDA currently projects 2020 planted area to increase by 4.6 million acres. Assuming trend yields, the USDA projects corn stocks to increase to over 2.7 billion bushels, with a U.S. MYA farm price of $3.40/bushel.
Soybeans—U.S. planted and harvested area of soybeans declined by 12.7 and 12.0 million acres, respectively, from 2018. The potential yield of 46.9 bushels per acre produces a 2019 soybean crop that is 878 million bushels smaller than last year’s crop. Total soybean supply is reduced by 397 million bushels due to the large carry-in. Soybean use is projected to increase slightly from 2018 but is 289 million bushels less than the use for the 2017 crop. Ending stocks are projected almost to be halved from the previous year but are still the second largest in the last decade. The U.S. MYA price is projected to increase to $9.00/bushel. USDA projects 2020 soybean area to increase by 7.5 million acres with stocks to increase to over 530 million bushels.
Wheat—U.S. planted and harvested wheat are decreased by 2.6 and 2.4 million acres, respectively, from 2018. Harvested yield increased from last year to 51.7 bushels per acre. A smaller carry-in and reduced imports partially offset the effect of the larger 2019 wheat crop. Total use is projected to increase from 2018 with feed/residuals and exports driving the increase. The strong demand is expected to reduce stocks to a stocks-to-use ratio of 48.1%. Even with reduced stocks, the U.S. MYA price is projected lower than last year’s price at $4.60/bushel. USDA is projecting 2020 wheat seeding to decline by 2.6 million acres with a slight reduction in ending stocks to 921 million bushels. If realized, the stocks would be the smallest quantity since the 2014-15 marketing year.
Tobacco—Kentucky’s tobacco sector continued to shrink in 2019 as U.S. burley exports fell (-30%), while burley leaf imports grew (+40%) even in the midst of an accelerated decline in domestic cigarette sales (-5 to-6%). In addition, the dark tobacco sector is being adversely impacted by declining smokeless tobacco sales, following more than two decades of growth. Despite controversy, alternative tobacco products (vaping/e-cigarettes and heat-not-burn) are displacing some traditional tobacco products, with much uncertainty on their long-term impact on leaf tobaccos. The U.S. burley crop may total 80-85 million pounds (-15 to 20%) in 2019, while U.S. dark tobacco production may be around 75 million pounds (-10 to 15%). Despite lower production, leaf prices are not expected to change much from last year’s levels, given contract price levels and some curing quality issues for burley. Overall, Kentucky tobacco cash receipts will likely fall below $300 million for 2019, compared to averaging $356 million over the past 5 years. Lower tobacco production levels may move the sector to a more balanced supply/demand levels for 2020, which may result in fairly stable contract volumes for the coming year. Grower profit margins continue to be squeezed with higher labor costs coupled with limited yield gains and stagnant leaf prices, resulting in continued concentration among growers.
Hemp—Kentucky’s hemp sector continues to evolve, with opportunities, new challenges, and much regulatory and economic uncertainty. Interest in the crop swelled in Kentucky as well as across the nation, following the passage of the 2018 farm bill, coupled with promising income opportunities amidst a depressed ag economy. Hemp acreage across the nation increased from less than 100,000 acres in 2018 to reportedly over 500,000 licensed acres in 2019, with perhaps more than 250,000 acres harvested. Over 90% of Kentucky’s planted acres (26,500) in 2019 were devoted to CBD production. As expected, the escalation of production outplaced the growing CBD product market, causing farm-level prices to decline by 50% or more. According to the Kentucky Department of Agriculture, hemp processors paid Kentucky growers $17.75 million in 2018. Based on price and production estimates, Kentucky farm-level hemp sales may total $55 to $65 million in 2019 (1% of Kentucky ag cash receipts). Adequate processing infrastructure, credit/transportation issues, weed control, seed identity, labor issues, and timely payments provided additional challenges this past year. With dozens of new states coming on board for 2020, supply expansion may continue to be a concern, despite an overall growing product market. Moving forward, growers are advised to closely monitor and evaluate their own personal risk tolerance, contract terms, and business relations as this industry matures amidst much regulatory and economic uncertainty.
Fruits, Vegetables and Greenhouse—Yields and markets for KY produce remained firm despite very dry growing conditions mid-summer. Produce sales continue to be made up substantially of farm market and other direct to consumer sales, contributing around 40 to 50% of the total. Record imports and labor costs have dampened produce markets nationally. The nursery industry benefitted from a 12 year high in housing starts in 2019. Consumer spending and disposable income, which also increased sharply in 2019, certainly helped contribute to stronger nursery markets, including plant sales.
Forestry—While the overall estimated 2019 economic contribution of the Kentucky forest sector remained stable at $13.2 billion, there was considerable volatility among products and species. The down-trending Asian export markets for wood products, exacerbated by tariffs, and coupled with a soft domestic market hit red oak hard, significantly reducing prices for red oak lumber and timber. The presence of red oak in many of our woodlands decreased their overall value and landowners made decisions not to sell timber. This negatively impacted logging and primary wood manufacturing and this situation will continue into 2020. There were some bright spots with the startup of the idled Phoenix paper mill in Wickliffe, KY igniting a dormant pulpwood market in western Kentucky. White oak and walnut logs remain in high demand, resulting in high prices which are expected to continue into 2020 and beyond. Increasing demand for white oak stave logs for whisky barrels, along with a stable market for crosstie logs has helped to prop up the logging sector and kept some primary wood manufacturing facilities from experiencing significant losses. While white oak markets will continue to increase and cross tie markets are estimated to remain stable through the first half of 2020, a significant amount of uncertainty in other wood product markets, not limited to red oak, will likely lead to lower stumpage prices in the near future.
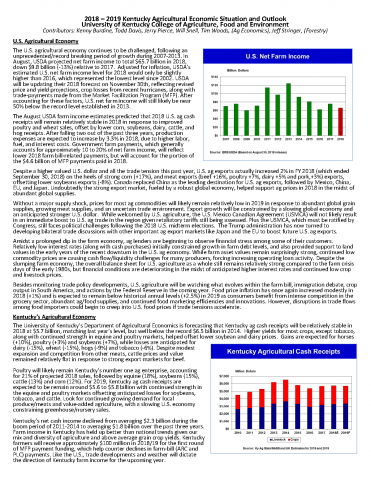
U.S. Agricultural Economy
The U.S. agricultural economy continues to be challenged, following an unprecedented/record breaking period of growth during 2007-2013. In August, USDA projected net farm income to total $65.7 billion in 2018, down $9.8 billion (-13%) relative to 2017. Adjusted for inflation, USDA’s estimated U.S. net farm income level for 2018 would only be slightly higher than 2016, which represented the lowest level since 2002. USDA will be updating their 2018 forecast on November 30th, reflecting revised price and yield projections, crop losses from recent hurricanes, along with trade-payments made from the Market Facilitation Program (MFP). After accounting for these factors, U.S. net farm income will still likely be near 50% below the record level established in 2013.
The August USDA farm income estimates predicted that 2018 U.S. ag cash receipts will remain relatively stable in 2018 in response to improved poultry and wheat sales, offset by lower corn, soybeans, dairy, cattle, and hog receipts. After falling two out of the past three years, production expenses are expected to increase by 3.3% in 2018, due to higher labor, fuel, and interest costs. Government farm payments, which generally accounts for approximately 10 to 20% of net farm income, will reflect lower 2018 farm bill-related payments, but will account for the portion of the $4.6 billion of MFP payments paid in 2018.
Despite a higher valued U.S. dollar and all the trade tension this past year, U.S. ag exports actually increased 2% in FY 2018 (which ended September 30, 2018) on the heels of strong corn (+17%), and meat exports (beef +16%, poultry +7%, dairy +5% and pork,+3%) exports, offsetting lower soybeans exports (-8%). Canada replaced China as the leading destination for U.S. ag exports, followed by Mexico, China, EU, and Japan. Undoubtedly the strong export market, fueled by a robust global economy, helped support ag prices in 2018 in the midst of abundant global supplies.
Without a major supply shock, prices for most ag commodities will likely remain relatively low in 2019 in response to abundant global grain supplies, growing meat supplies, and an uncertain trade environment. Export growth will be constrained by a slowing global economy and an anticipated stronger U.S. dollar. While welcomed by U.S. agriculture, the U.S. Mexico Canadian Agreement (USMCA) will not likely result in an immediate boost to U.S. ag trade in the region given retaliatory tariffs still being assessed. Plus the USMCA, which must be ratified by Congress, still faces political challenges following the 2018 U.S. midterm elections. The Trump administration has now turned to developing bilateral trade discussions with other important ag export markets like Japan and the EU to boost future U.S. ag exports.
Amidst a prolonged dip in the farm economy, ag lenders are beginning to observe financial stress among some of their customers. Relatively low interest rates (along with cash purchases) initially constrained growth in farm debt levels, and also provided support to land values in the early years of the recent downturn in the U.S. ag economy. While farm asset values remain surprisingly strong, continued low commodity prices are causing cash flow/liquidity challenges for many producers, forcing increasing operating loan activity. Despite the slumping farm economy, the overall balance sheet for U.S. agriculture as a whole still remains relatively strong compared to the farm crisis days of the early 1980s, but financial conditions are deteriorating in the midst of anticipated higher interest rates and continued low crop and livestock prices.
Besides monitoring trade policy developments, U.S. agriculture will be watching what evolves within the farm bill, immigration debate, crop output in South America, and actions by the Federal Reserve in the coming year. Food price inflation has once again increased modestly in 2018 (+1%) and is expected to remain below historical annual levels (+2.5%) in 2019 as consumers benefit from intense competition in the grocery sector, abundant ag/food supplies, and continued food marketing efficiencies and innovations. However, disruptions in trade flows among food importers could begin to creep into U.S. food prices if trade tensions accelerate.
Kentucky’s Agricultural Economy
The University of Kentucky’s Department of Agricultural Economics is forecasting that Kentucky ag cash receipts will be relatively stable in 2018 at $5.7 billion, matching last year’s level, but well below the record $6.5 billion in 2014. Higher yields for most crops, except tobacco, along with continued strength in equine and poultry markets, helped offset lower soybean and dairy prices. Gains are expected for horses (+10%), poultry (+3%) and soybeans (+7%), while losses are anticipated for dairy (-15%), wheat (-15%), hogs (-9%) and tobacco (-6%). Despite modest expansion and competition from other meats, cattle prices and value remained relatively flat in response to strong export markets for beef.
Poultry will likely remain Kentucky’s number one ag enterprise, accounting for 21% of projected 2018 sales, followed by equine (18%), soybeans (15%), cattle (13%) and corn (12%). For 2019, Kentucky ag cash receipts are expected to be remain around $5.6 to $5.8 billion with continued strength in the equine and poultry markets offsetting anticipated losses for soybeans, tobacco, and cattle. Look for continued growing demand for local produce/meats and value-added agriculture, with a slowing U.S. economy constraining greenhouse/nursery sales.
Kentucky’s net cash income declined from averaging $2.3 billion during the boom period of 2011-2014 to averaging $1.8 billion over the past three years. Farm income in Kentucky has held up better than national trends given our mix and diversity of agriculture and above average grain crop yields. Kentucky farmers will receive approximately $100 million in 2018/19 for the first round of MFP payment funding, which help counter declines in farm-bill (ARC and PLC) payments. Like the U.S., trade developments and weather will dictate the direction of Kentucky farm income for the upcoming year.
Cattle-- Despite higher production levels across all three major meats, cattle prices managed to hold relatively steady for 2018. A strong economy and impressive export levels (despite trade issues) both worked to somewhat offset the supply challenges. Frequent rain created some challenges, but also resulted in good forage growth through summer and fall for much of Kentucky. Calf prices for the year actually averaged about $8 per cwt higher than 2017; heavy feeder cattle prices were virtually changed. While there are signs that cow-herd expansion may be slowing, expect an increase in beef cow numbers for 2019. This, coupled with another round of production increases for pork and poultry, suggests lower prices for cattle year-over-year for 2019. Look for a seasonal increase in prices during the spring, but expect prices by fall 2019 to be below fall 2018 levels.
Poultry--The poultry sector continues to grow in Kentucky as receipts are forecast to approach $1.2 billion for 2018. Broiler prices spent most of the spring and summer above 2017 levels, but did fall sharply from late summer to early fall. This decline is seasonal, but the drop in 2018 was sharper than usual. All indicators are that the sector will continue to grow in Kentucky in 2019.
Hogs-- With pork production up nearly 3% for 2018, hog prices came under pressure, averaging around $60 per cwt in the Eastern Cornbelt on a carcass weight basis. This represents more than a $5 per cwt decrease from 2017, and is likely near, or below, production costs for most operations. Looking ahead to 2019, another sizeable increase in pork production is expected as hog inventory continues to grow at the national level. Trade will be an especially important factor for hog prices as over 20% of U.S. pork production is typically exported.
Equine-- Kentucky equine receipts continue to show strength and should exceed $1 billion for 2018. A relatively strong economy and another Triple Crown winner likely supported both sales and stud fees for 2018. The Keeneland September yearling sale was up more than 20% from 2017. It is likely that this strength will continue into 2019.
Dairy-- Kentucky dairy cow numbers were estimated by USDA to be flat from January 2017 to January 2018, but have certainly declined during this year. Many producers were impacted by loss of contracts with Dean’s and all were impacted by unattractive margins. Farm level milk prices for the year were down more than $1.50 per cwt from 2017. Prices are forecast to improve slightly, especially in the second half next year, but margins will still be very challenging.
yield of 178.9 bushels/acre produced a Kentucky corn crop totaling 14.6 billion; however, smaller carry-in offsets the larger crop and reduces supply from last year. Strong domestic and export use is projected to reduce stocks to an 11.5% stocks-to-use ratio. The U.S. marketing-year average farm price for 2018/19 is pegged at $3.60/bushel up $0.24 per bushel from 2017. Currently, USDA projects 2019 corn area to increase by 2.9 million acres from 2018, with an updated estimate to be released in February 2019.
Soybeans—U.S. planted and harvested area of soybeans declined by 1 and 1.2 million acres, respectively, from 2017. The potential record yield of 52.1 bushels per acre provides a record U.S. soybean production of 4.6 billion bushels. Total use is projected to fall by 189 million bushels because of reduced exports with China. Ending stocks are forecast to increase to a record 955 million bushels and the largest stocks-to-use ratio since 1985. The U.S. marketing-year average farm price for 2018/19 is projected at $8.60 per bushel. Currently, USDA expects 2019 soybean area to decrease by 6.6 million acres from 2018.
Wheat-- U.S. wheat planted and harvested increased by 1.8 and 2.1 million acres, respectively, from 2017. Harvested yield also increased from last year to 47.6 bushels per acre. The larger 2018 wheat crop was partially offset by a smaller carry-in and reduced imports. Total use is projected to increase from 2018 with exports driving the increase. The strong demand is expected to reduce stocks to below a stocks-to-use ratio of 43.7%. Reduced stocks will support a higher U.S. marketing-year farm price of $5.10 per bushel. USDA projects 2019 wheat area to increase by 3.2 million acres from 2018. The delayed corn harvest and wet fall weather may reduce this amount.
Tobacco-- Slumping demand/contract volume coupled with an extremely poor growing season resulted in a significantly lower burley crop. Beltwide 2018 marketings may struggle to exceed 100 million pounds, compared to over 140 million pounds in 2017. In the midst of declining global demand for burley, world burley production was up by 15%. Overall demand for U.S. burley may only total around 100 to 110 million pounds given declines in domestic cigarette sales (-4 to 5%) and burley leaf exports (-5 to 7%). After two decades of growth, sales of snuff show signs of leveling off, hindering dark tobacco demand. E-cigarettes/vaping products, which contain virtually no U.S. tobacco content, continue to take market share away from traditional tobacco products. Cigarette manufacturers continue to invest in new reduced risk tobacco products, although the leaf content of these products likely contain limited amounts of U.S. leaf. Tumbling U.S. burley demand, and slowing snuff sales will likely lead to additional reductions in contract volume for 2019. The value of Kentucky tobacco production may struggle to exceed $300 million in 2018 compared to averaging $366 million over the past ten years. Given the current outlook, labor/regulatory challenges, product demand changes, and tighter margins, look for continued concentration in the number of Kentucky farms growing tobacco in 2019.
Fruits, Vegetables and Greenhouse-- Generally favorable growing conditions in 2018 led to expansion of local produce supply out of Kentucky. Market shortages in 2017 played strongly to Kentucky’s favor. Prices were generally back near typical regional prices leading to slightly lower overall revenue for fruit and vegetable growers. The 2018 estimate of $48 milllion in produce sales is made up substantially of farm market and other direct to consumer sales, contributing around 40 to 50% of the total. The nursery industry benefitted from an 11 year high in housing starts in early 2018, but has since been adversely impacted by higher interest rates. Consumer spending, which also increased sharply in 2018, is expected to slow somewhat in 2019, constraining the growth in sales.
Forestry-- The forestry sector has been stable in 2018 contributing a total of $13.2 billion to Kentucky’s economy. Upward price trends for white oak stave (barrel) logs and railway tie logs are predicted to continue into 2019. Rapid log exporting to China has flattened. The third and fourth quarters have seen a decline black walnut, red oak, and ash. Downward pressure on log prices for red oak and ash due to tariffs and sluggishness of China’s economy have been countered by wet weather, keeping log inventories low, and prices stabilized. It will be early spring before which of these countering forces will prevail. Declines in housing starts will likely depress domestic demand for oak, hickory and yellow-poplar leading to stable stumpage prices in 2019.
