
The Ag Census Confirms Geographic and Commodity Shifts in the Kentucky Farm Economy

Author(s): Will Snell
Published: March 28th, 2024
Shareable PDF
The twenty-year time frame between the latest USDA Ag Census (2022) released earlier this year and the 2002 Ag Census occurred during a period of dramatic changes in Kentucky agriculture. During this two-decade period, the tobacco buyout was passed (in 2004) and implemented (2005-2014), the Kentucky Agricultural Development Board made significant investments to support ag diversification across the Commonwealth, and the state’s agricultural economy benefited greatly from growth in grain receipts (increased by more than 400%) and poultry receipts (increased by more than 200%). On the other end of the spectrum, tobacco receipts fell by 44% from 2002 to 2022, while dairy sales increased less than 10%. Overall, the Census data reveal that the market value of agricultural products sold in Kentucky increased from $3.1 billion in 2002 to $8.0 billion in 2022. However, the increase was not spread uniformly across the state. The two most western Kentucky Agricultural Statistical Districts (Purchase and Midwestern) experienced increases surpassing 200%, while the Eastern and Northern Kentucky districts realized minimal gains (53% and 27% respectively).
Table 1: Market Value and Market Share by Kentucky Agriculture Statistical District (2002 vs 2022)
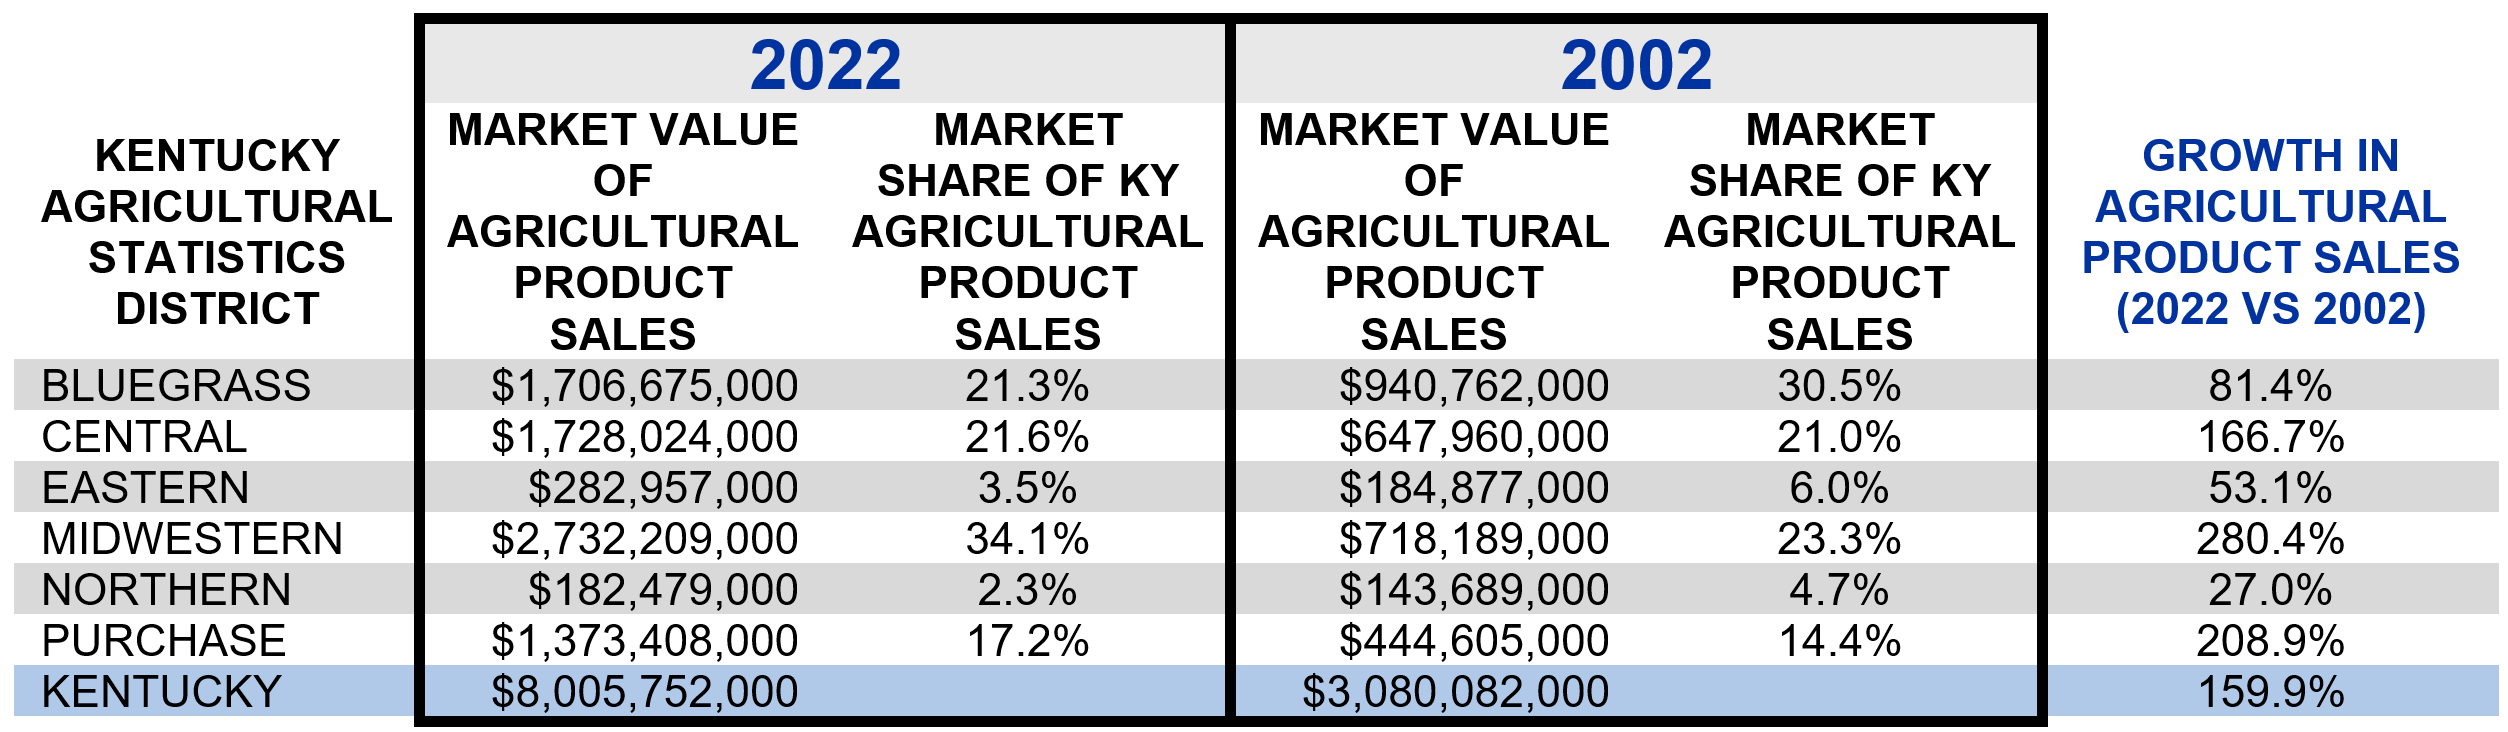
Source: USDA Ag Census, For a list of counties in each of the Kentucky Agricultural Statistics Districts, click here and go to page 3.
Collectively, the Midwestern and Purchase regions accounted for 51.3% of Kentucky ag sales in 2022 compared to 37.7% of sales in 2002. The largest dollar gains by county recorded over the twenty-year period occurred in Graves County (+$323.5 million), Daviess County (+$273.2 million), McLean County (+$217.2 million), Christian County (+$186.7 million), and Webster County (+$181.6 million). Fifteen Kentucky counties, primarily in eastern and northern Kentucky experienced losses in ag sales from 2002 to 2022.
During this twenty-year period Kentucky grain (corn, soybeans, and wheat) acres harvested increased by 40%, while the state’s tobacco acres fell 60%. The Kentucky cattle inventory declined 22% from 2002-2022, dairy cow numbers were 62% lower, while the number of broilers sold were fairly steady, dropping only 3%.
Figure 1: Dollar Change in the Market Value of Agricultural Product Sales (2022 vs. 2002)
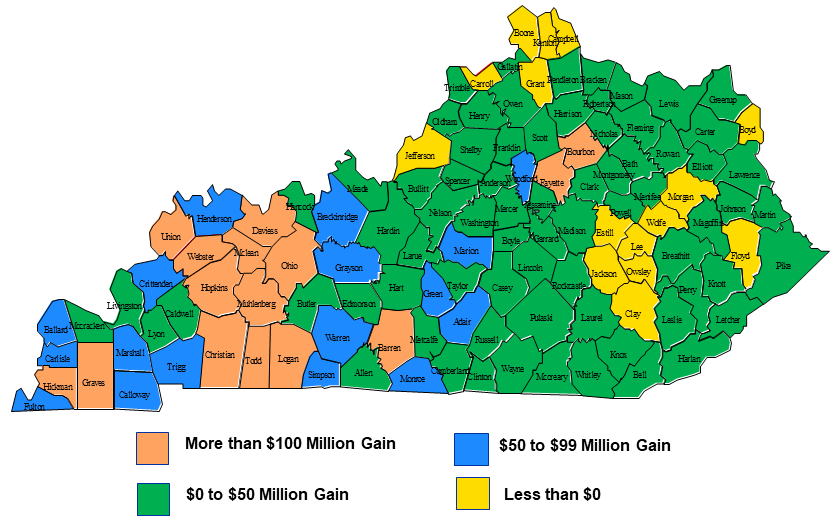
Source: USDA Ag Census
Figure 2: Percentage Change in the Market Value of Agricultural Product Sales (2022 vs. 2002)
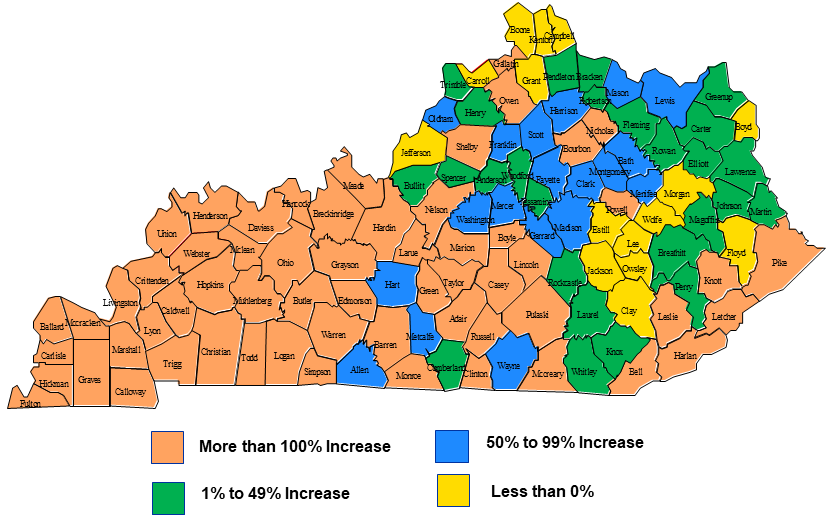
Source: USDA Ag Census
Figure 3: Market Value of Kentucky Agricultural Sales (2022 vs. 2002)
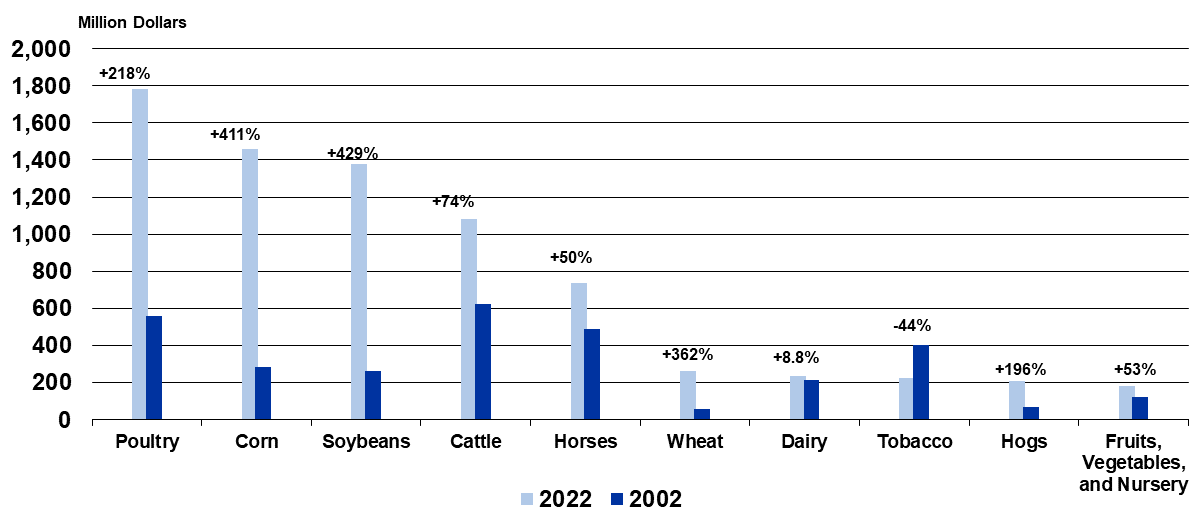
Source: USDA Ag Census
Recommended Citation Format:
Snell, W. “The Ag Census Confirms Geographic and Commodity Shifts in the Kentucky Farm Economy." Economic and Policy Update (24):3, Department of Agricultural Economics, University of Kentucky, March 28th 2024.
Author(s) Contact Information:
Will Snell | Extension Professor | wsnell@uky.edu
Recent Extension Articles
Maximizing Value: 2024 Spring Application of Broiler Litter for Grain Crop Production
Jordan Shockley
Spring is here and grain producers across the state are gearing up for planting. One of the many decisions producers have to make before planting is in regard to their nutrient management plan. Broiler litter provides a great opportunity as a complete fertilizer and is being produced and used throughout the state in grain production. However, the value of broiler litter can vary greatly depending on the management practices, nutrient content of the litter, soil test data and commercial fertilizer prices.
Stocker Outlook for 2024
Greg Halich & Kenny Burdine
Temperatures are getting warmer, the grass is getting greener, and the calf market is starting to take off. These are tell-tale signs of spring in Kentucky, and we are experiencing all three. There are signs pointing to an early spring, which likely means that some stocker operators have begun placing calves in order to get ahead of the spring price run. But the strong calf market does create questions for stocker operators purchasing calves for sale this fall. The purpose of this article is to assess the likely profitability of summer stocker programs for 2024 and establish target purchase prices for calves based on a range of return levels.

Subscribe to our monthly Economic & Policy Update e-newsletter to receive our top articles straight to your inbox.
Connect with Us
![]()
![]()
![]()
![]()