
Dairy Margin Coverage Provides Some Help in Challenging Milk Market
Author(s): Kenny Burdine
Published: July 28, 2023
Shareable PDF
Dairy producers continue to struggle with decreasing farm-level milk prices and high feed costs. For the first five months of 2023, the US All Milk price averaged $21.16 per cwt, which was more than $4 per cwt lower than the first five months of 2022. In fact, US All Milk dropped below $20 per cwt in May for the first time since October 2021. Lower milk prices are never a welcome change, but they are especially problematic in the current feed price environment. While farm-level milk prices were considerably lower for the January-May time period this year, feed prices were actually higher. Using the Dairy Margin Coverage (DMC) feed ration as a proxy for feed cost to produce a cwt of milk, feed costs were almost $1 per cwt higher during the first five months of this year. Needless to say, this combination puts a serious squeeze on dairy producers. The figure below shows both US All Milk Price and Dairy Margin Coverage (DMC) feed costs since January of 2014 and the recent convergence of the two lines is very obvious. (Note: Dairy-DMC did not exist for this entire time period, but the chart was intended to give historical perspective).
Figure 1: U.S. All Milk Price and DMC Feed Cost
January 2014 to May 2023, $ per cwt
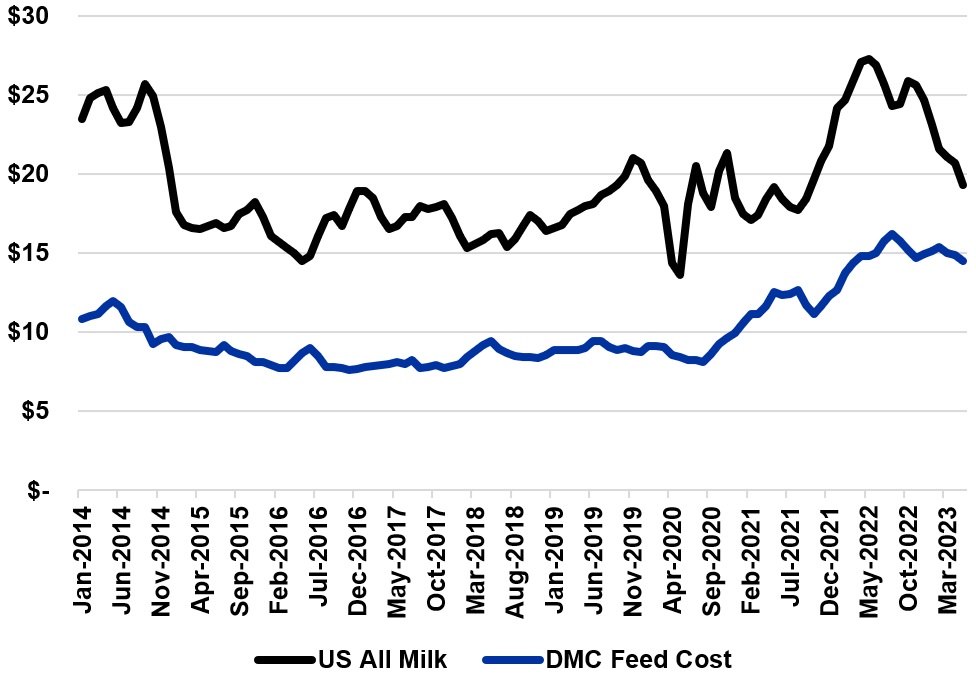
Source: USDA-NASS, USDA-FSA
While I would prefer market conditions be different, times like this are good opportunities to discuss risk management strategies. Dairy producers should consider all risk management opportunities available to them including Dairy Revenue Protection, Livestock Gross Margin (LGM) for Dairy, forward contracts, futures and options, etc. But the Dairy Margin Protection (DMC) program is a relatively inexpensive way to get some margin protection, especially on an operation’s first 5 million lbs of milk production history. Because it is readily available and inexpensive, I suggest to producers that DMC should be their first layer of risk protection. In fact, producers that enrolled in the DMC program at the highest level ($9.50 per cwt) have received a payment in each of the first five months of 2023.
The chart below tracks DMC margin back to January of 2014 and one can easily see the last several months. The last point on that chart is May of 2023 for which the DMC actual margin was $4.83. While it can’t be seen in the chart, one would have to go back to 2012 to find a lower DMC margin than that, had the program existed back then. In terms of the payment level for May 2023, participating producers received a payment of $4.67 for that month’s share (1/12) of the production history they chose to cover. While a dairy producer would be better off if prices were such that a DCM payment was not triggered, a payment of this magnitude absolutely makes a difference.
Many risk management tools today are market-based. By that, I mean that available coverage levels and costs evolve with market conditions. Examples of this would include Livestock Risk Protection and Livestock Gross Margin Insurance, as well as crop insurance for which reference prices are determined by February futures. But DMC really is a countercyclical tool. The margin levels that can be purchased are available regardless of market conditions. In fact, producers may enroll in DMC at times when the likelihood of payouts is extremely high. Every operation should consider all available tools when putting together their risk management plan, but it’s hard to imagine that DMC-Dairy would not be one of the tools in their risk management toolbox.
Figure 2: DMC Margin - U.S. All Milk Price Minus DMC Feed Cost
January 2014 to May 2023, $ per cwt
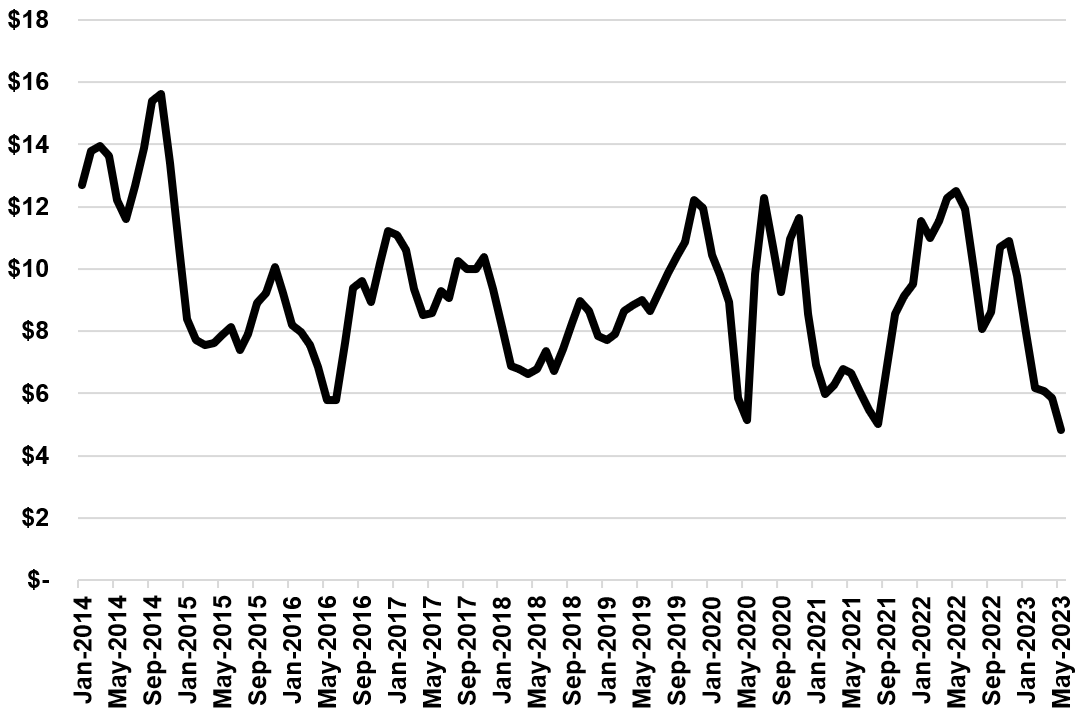
Source: USDA-NASS, USDA-FSA, author calculations
Recommended Citation Format:
Burdine, K. "Dairy Margin Coverage Provides Some Help in Challenging Milk Market." Economic and Policy Update (23):7, Department of Agricultural Economics, University of Kentucky, July 28, 2023.
Author(s) Contact Information:
Kenny Burdine | Extension Professor | kburdine@uky.edu
Recent Extension Articles
Summaries of Produce Auction Quantities and Prices Available Soon
Savannah Columbia
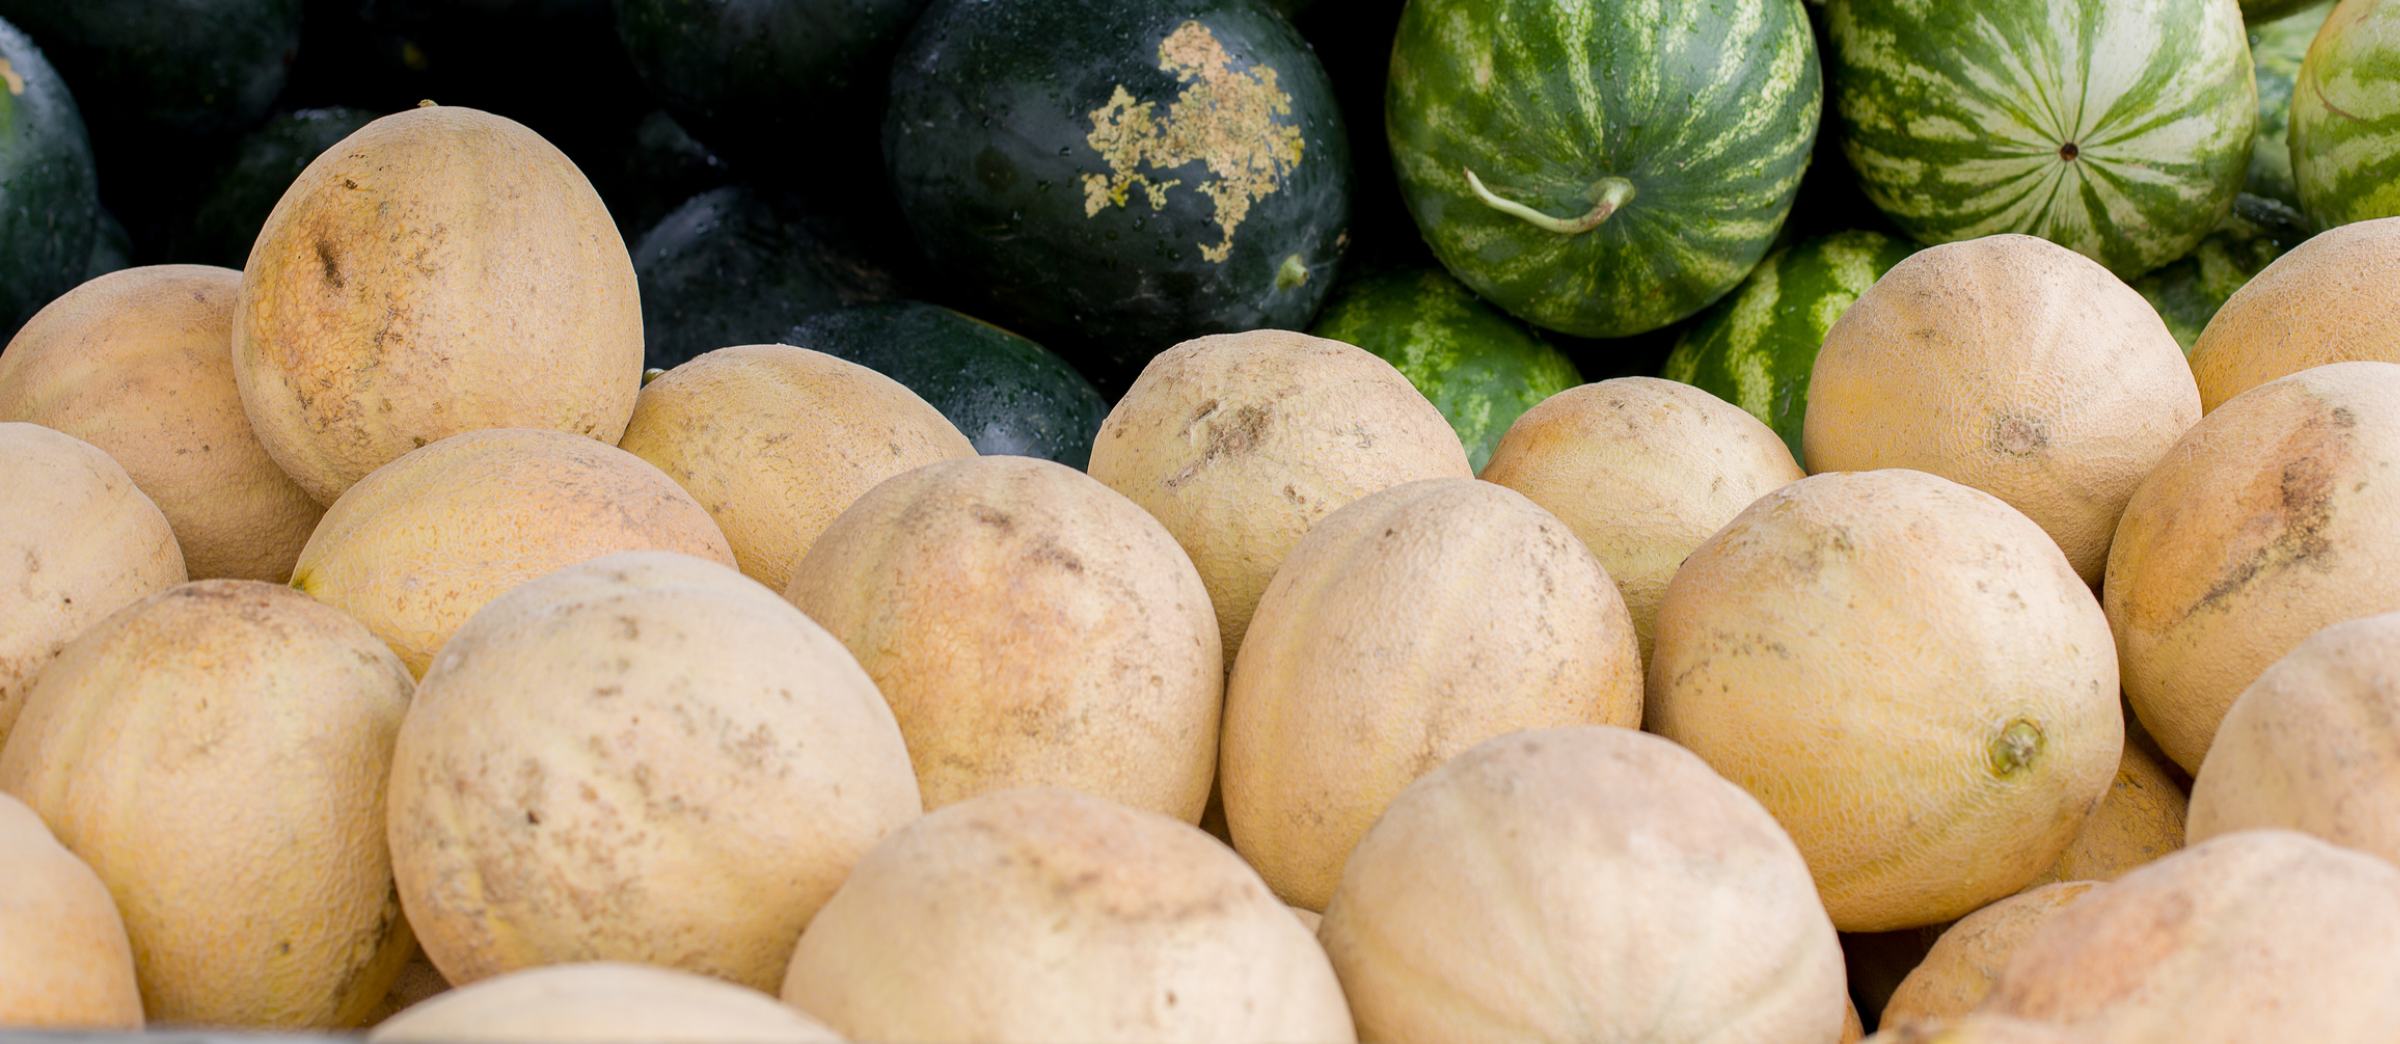
The produce auction is a marketing channel for growers producing fruit and vegetable crops, nursery crops, and ornamentals. The produce auction serves growers as a market to sell large quantity crops while it serves buyers or consumers as a place to purchase bulk fresh, local products. The forthcoming report Three-Year Average Prices & Quantities at Kentucky Produce Auctions: 2020-2022, compares average volumes and prices for 16 crops (listed under Crops & Units) from two major Kentucky produce auctions for the 2020, 2021, and 2022 seasons.

Highlights of the 2022 Kentucky Equine Survey
Jill Stowe
As Kentucky’s equine industry navigated significant changes in the past decade, (emerging from the Great Recession in 2008-2009, the global COVID-19 pandemic in 2020-21, and natural disasters in 2021 and 2022), it experienced areas of both growth and contraction. The number of equine and equine operations declined, but income increased. In addition, the total value of equine and equine-related assets in the state was $27.7 billion in 2022, up more than 18% from 2012.

Subscribe to our monthly Economic & Policy Update e-newsletter to receive our top articles straight to your inbox.
Connect with Us
![]()
![]()
![]()
![]()