
Price Dynamics at Kentucky Farmers Markets, 2021-2023

Author(s): Brett Wolff
Published: February 28, 2024
Shareable PDF
In a previous Economic and Policy Update article, 2023 Kentucky Vegetable & Fruit Input Costs: Changes and Trends, Emily Spencer and Tim Woods covered some of the insights our Center for Crop Diversification team drew from a recent Input Cost survey we conducted. These input costs along with inflation and other direct market trends have direct effects on profitability and pricing in direct-to-consumer markets. This month, we want to share some of the data we have from the most ubiquitous specialty crop direct market type we have in Kentucky—Farmers Markets.
In 2023, there are 170 farmers markets in Kentucky where 3,000+ vendors sell a variety of specialty crops, meat, value-added, and other products (personal conversation, Sharon Spencer, KDA). Since 2004, the Center for Crop Diversification has collected price data from Farmers Markets in Kentucky and have archived KYFM annual reports available for download. We have supported partners in Illinois, Indiana, West Virginia, Nebraska, and Tennessee to establish similar reporting systems in their states. Funding cuts have ended some of these programs, though the University of Tennessee still reports prices weekly during the season. The CCD recently published a 3-year Average Price Report (2021-2023) for 17 crops at Farmers Markets in Kentucky. Below we have shared several interesting price dynamics from these data, and we are developing more price analysis publications this spring.
Seasonal Price Fluctuations Vary by Crop and Market Location
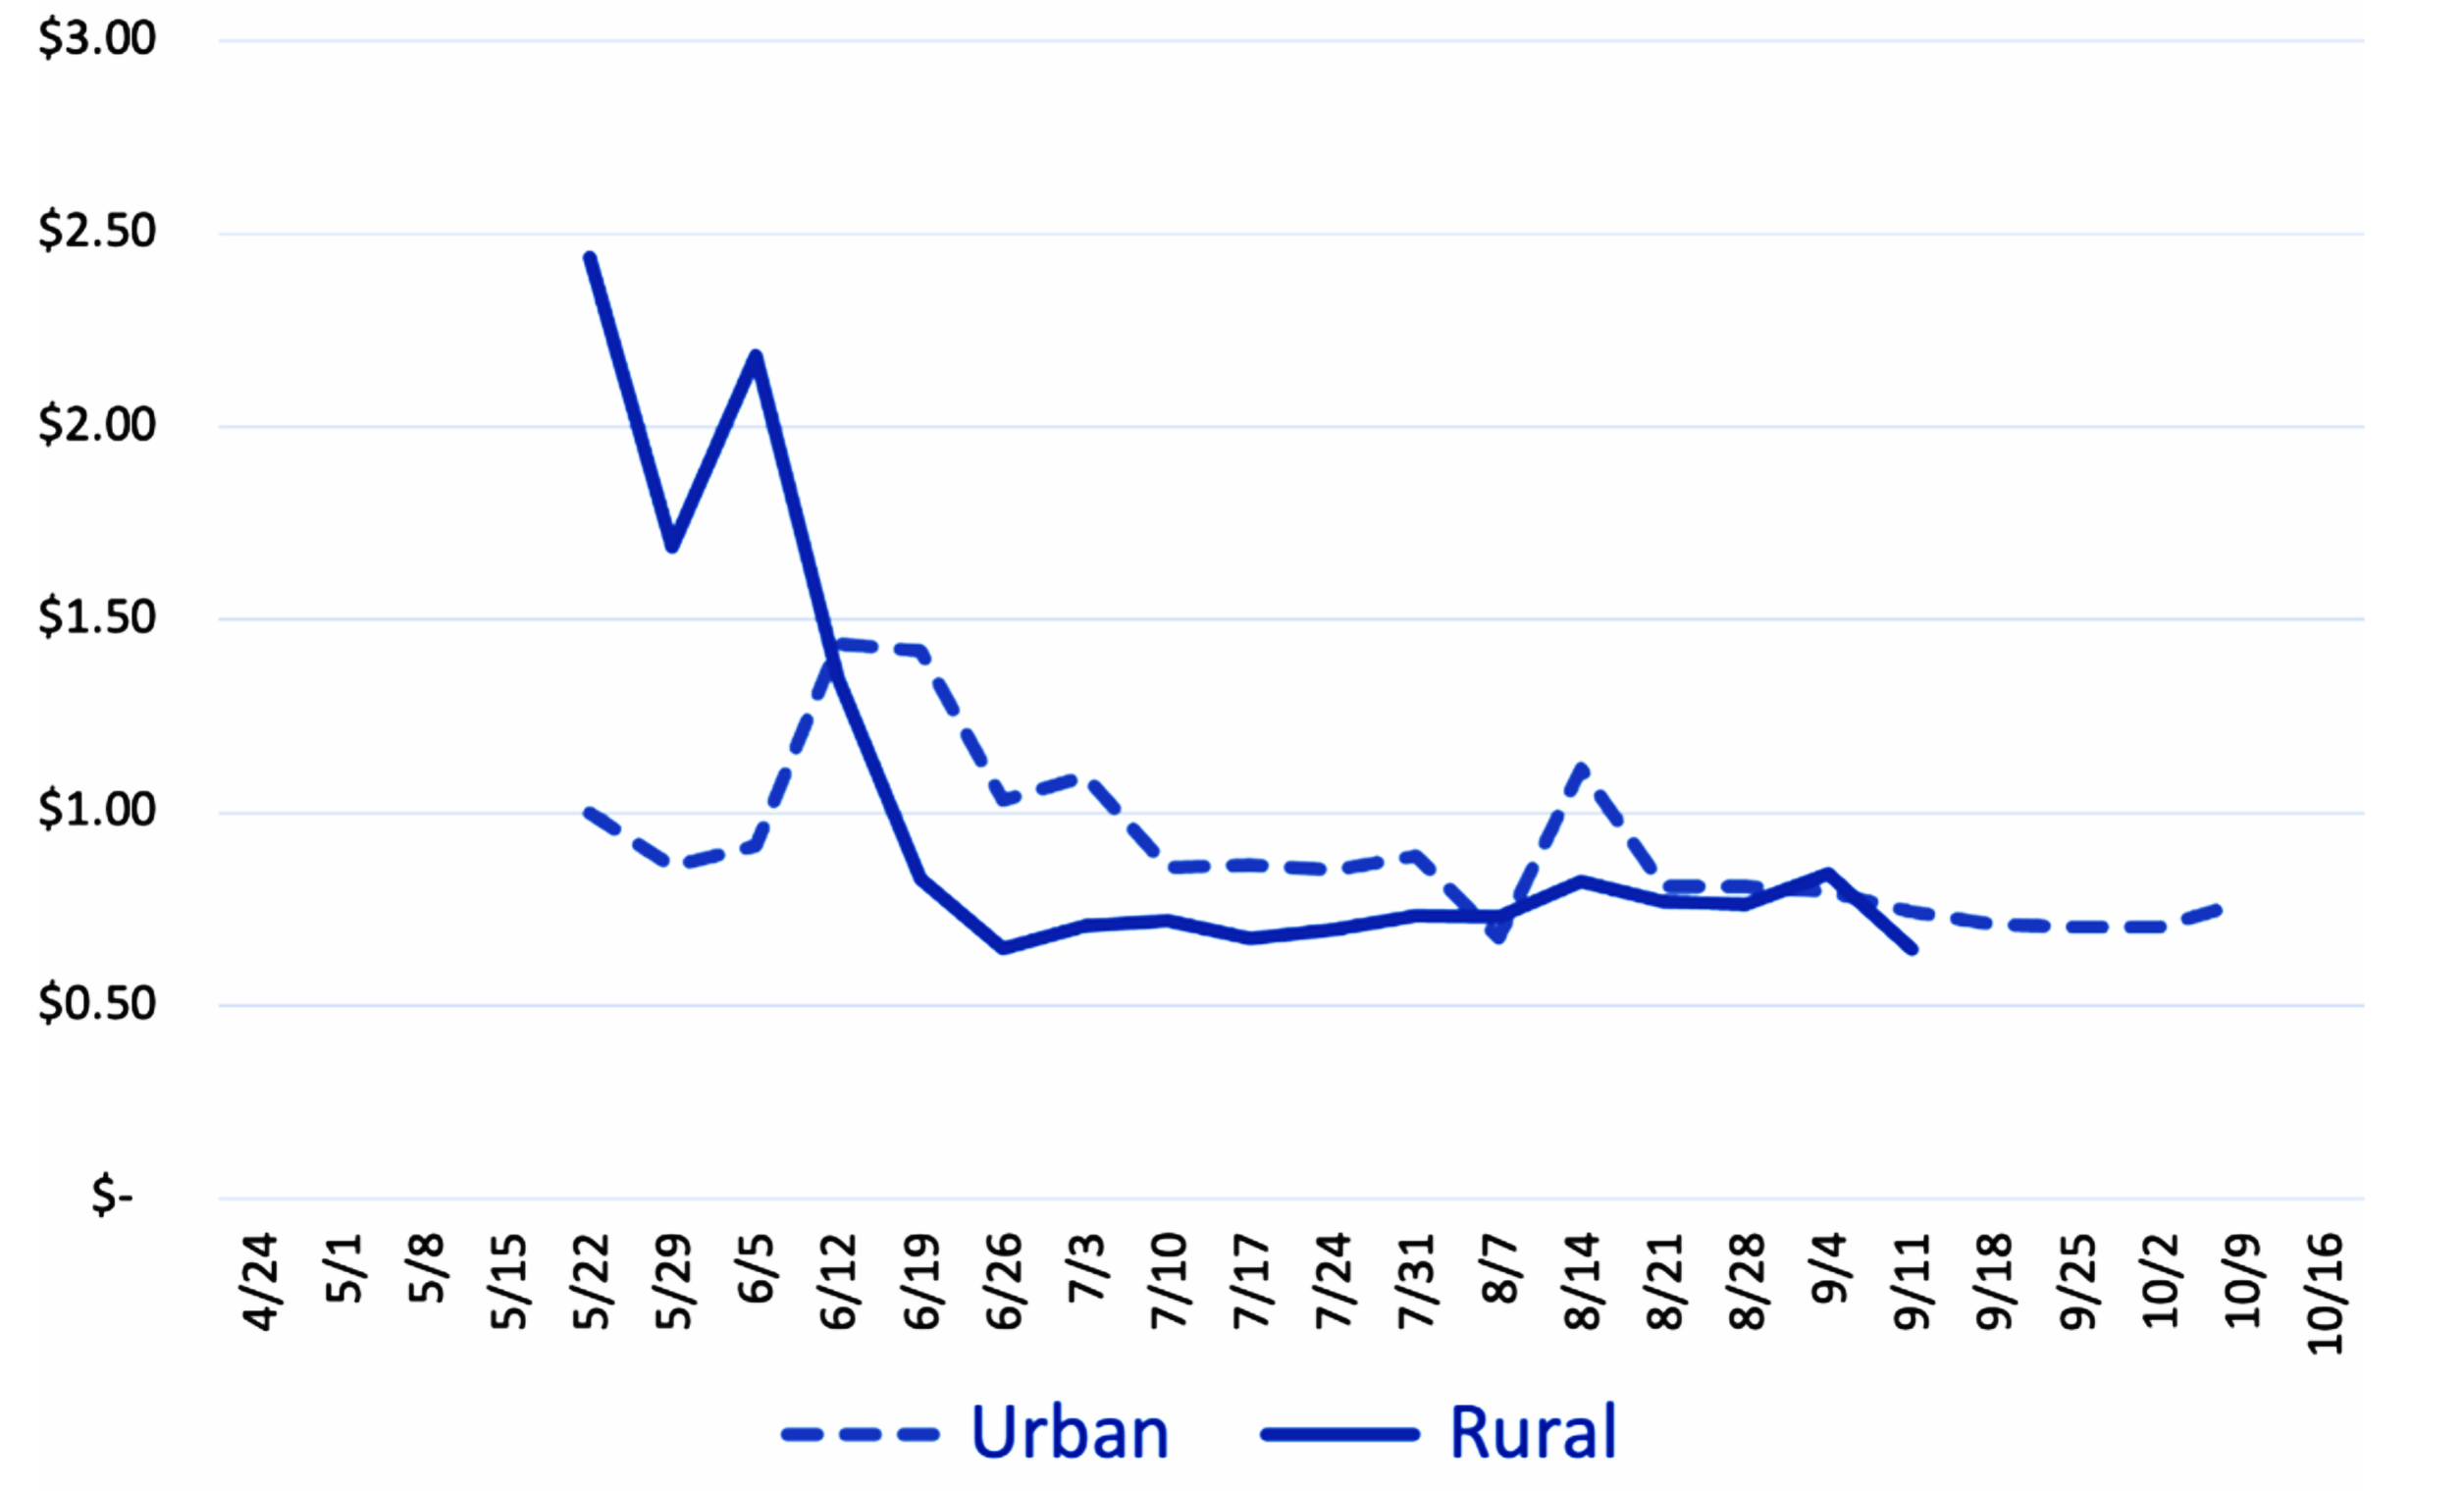
Tomatoes, beans, cucumbers, and sweet corn are among the prototypical farmers market crops in Kentucky. The pricing for these crops fluctuates very differently across the season. For example, tomatoes in urban markets remain relatively stable across the season and are consistently higher than at rural markets. Rural tomato prices taper off as rural gardens come into production while urban prices stay about the same the whole season. By contrast, prices for cucumbers in urban areas were lower to start the season than rural prices and the prices at the two market types were nearly equal by the end of the growing season. This may indicate cucumbers are less valuable to urban consumers than tomatoes, or that urban vendors prioritize other crops with higher profit margins. We’d love to hear from you about other theories for these differences and others you observe in the full report.
Figure 1: Tomatoes, Average Price 2021-2023 ($/pound)
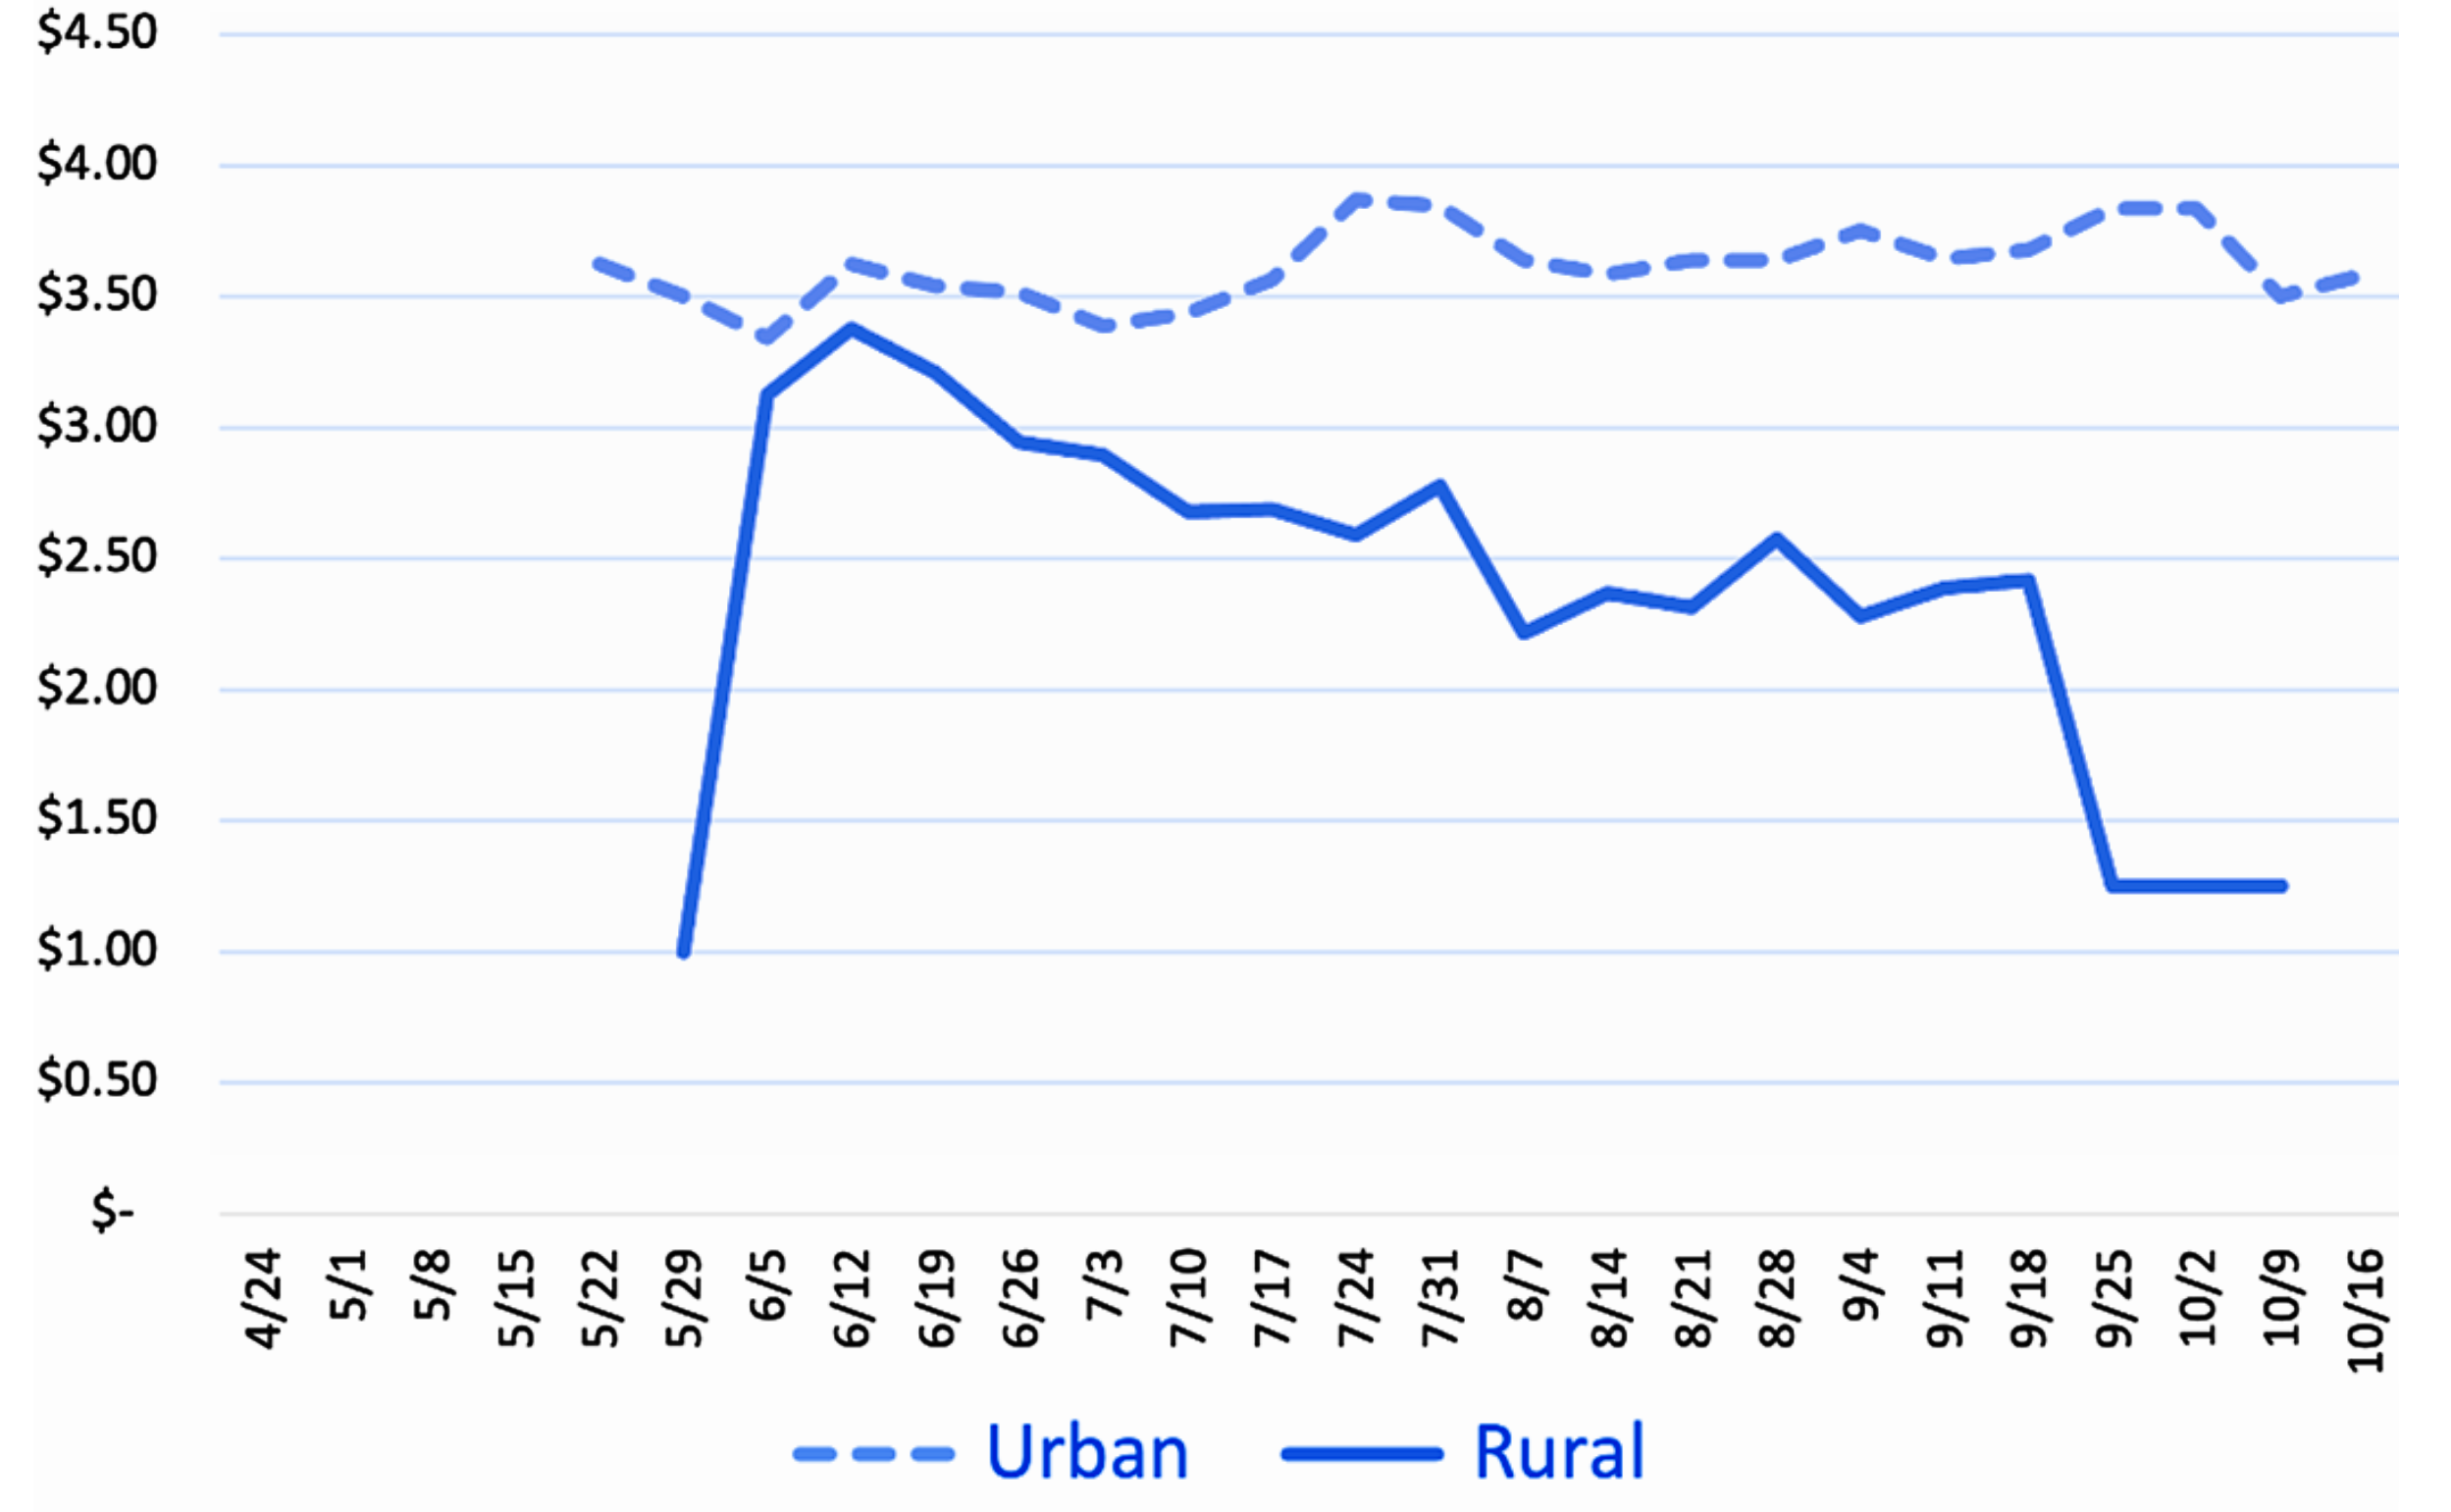
Figure 2: Cucumber, Average Price 2021-2023 ($/each)
Urban vs. Rural
We chose to divide our price analysis into Rural and Urban markets because we know there are considerable differences between these market types when it comes to infrastructure, customer type and values, product mix, vendor type, and socioeconomic conditions in surrounding areas. A few quick notes below demonstrate some price differences in these market types.
In Kentucky, on average urban prices were higher than rural prices by:
- 24.6% in 2021
- 35.0% in 2022
- 39.6% in 2023
Over the 2021-2023 window at urban markets:
- Lettuce was 104.4% more expensive
- Apples were 71.8% more expensive
- Garlic was 62.8% more expensive
- Tomatoes were 45.6% more expensive
- Asparagus was 6.1% less expensive
- Cucumbers were 2.4% less expensive
…relative to rural markets
These data, combined with perspectives shared from partners and vendors working with Farmers markets may indicate that the gap in pricing and profitability between rural markets and urban markets is growing and that future extension and other agricultural technical support needs to specifically address rural market needs if we want these crucial community food supply and cultural hubs to persist. In 2024, our group plans to develop more analysis of pre-and post-COVID effects as well as additional consideration of the rural and urban shifts in Farmers Markets.
Recommended Citation Format:
Wolff, B. "Price Dynamics at Kentucky Farmers Markets, 2021-2023." Economic and Policy Update (24):2, Department of Agricultural Economics, University of Kentucky, February 28, 2024.
Author(s) Contact Information:
Brett Wolff | Extension Specialist | brett.wolff@uky.edu
Recent Extension Articles
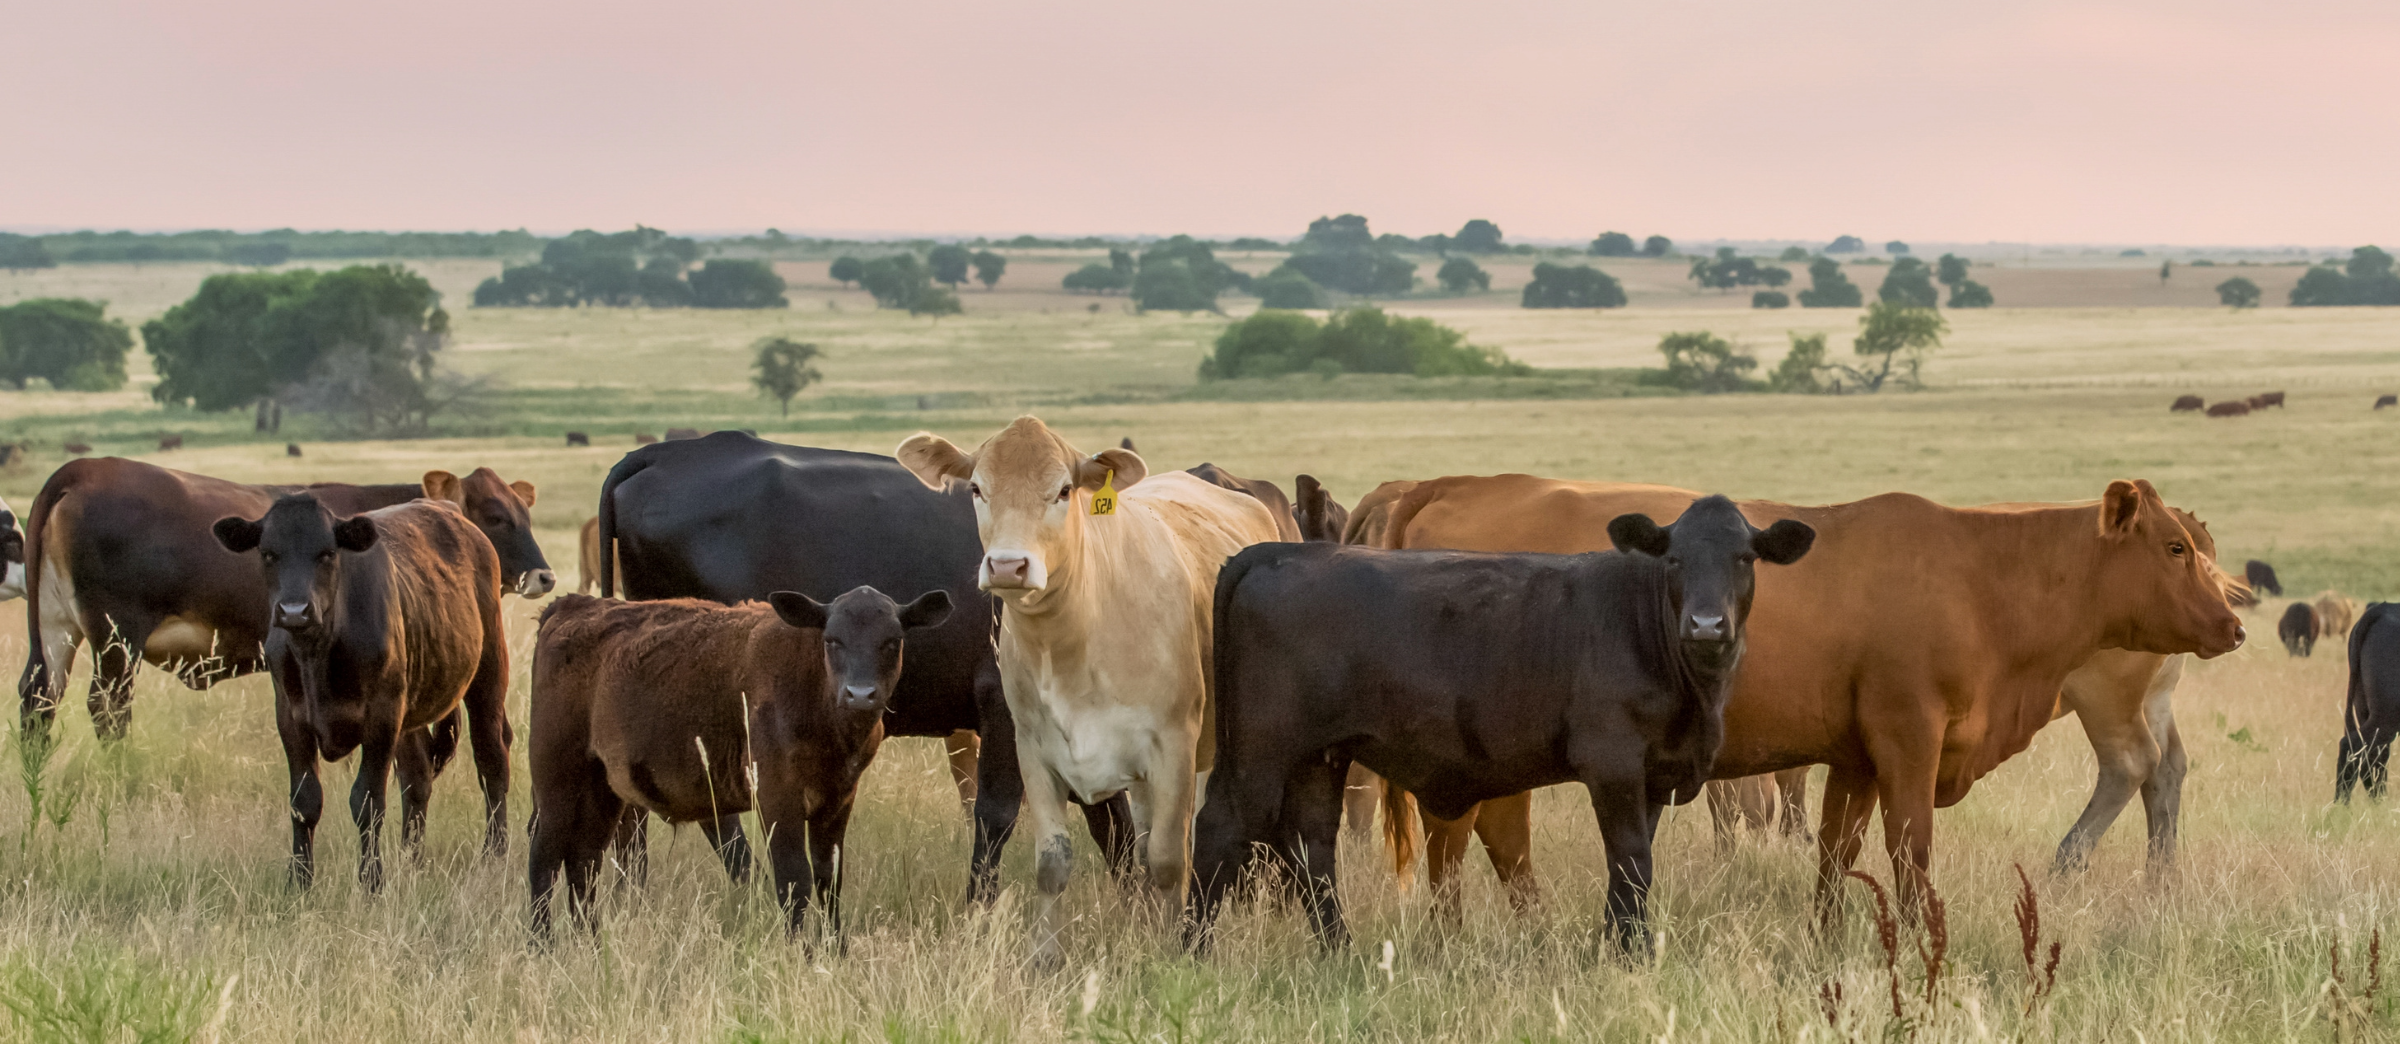
U.S. Beef Cow Inventory Continues to Decline
Kenny Burdine
USDA-NASS released their January 2024 cattle inventory estimates on the afternoon of January 31st. Estimates came in pretty close to expectations and confirmed that the cowherd had continued getting smaller during the course of 2023. It was really a question of how much contraction had occurred. At the national level, inventory of all cattle and calves came in little less than 2% lower than January of 2023
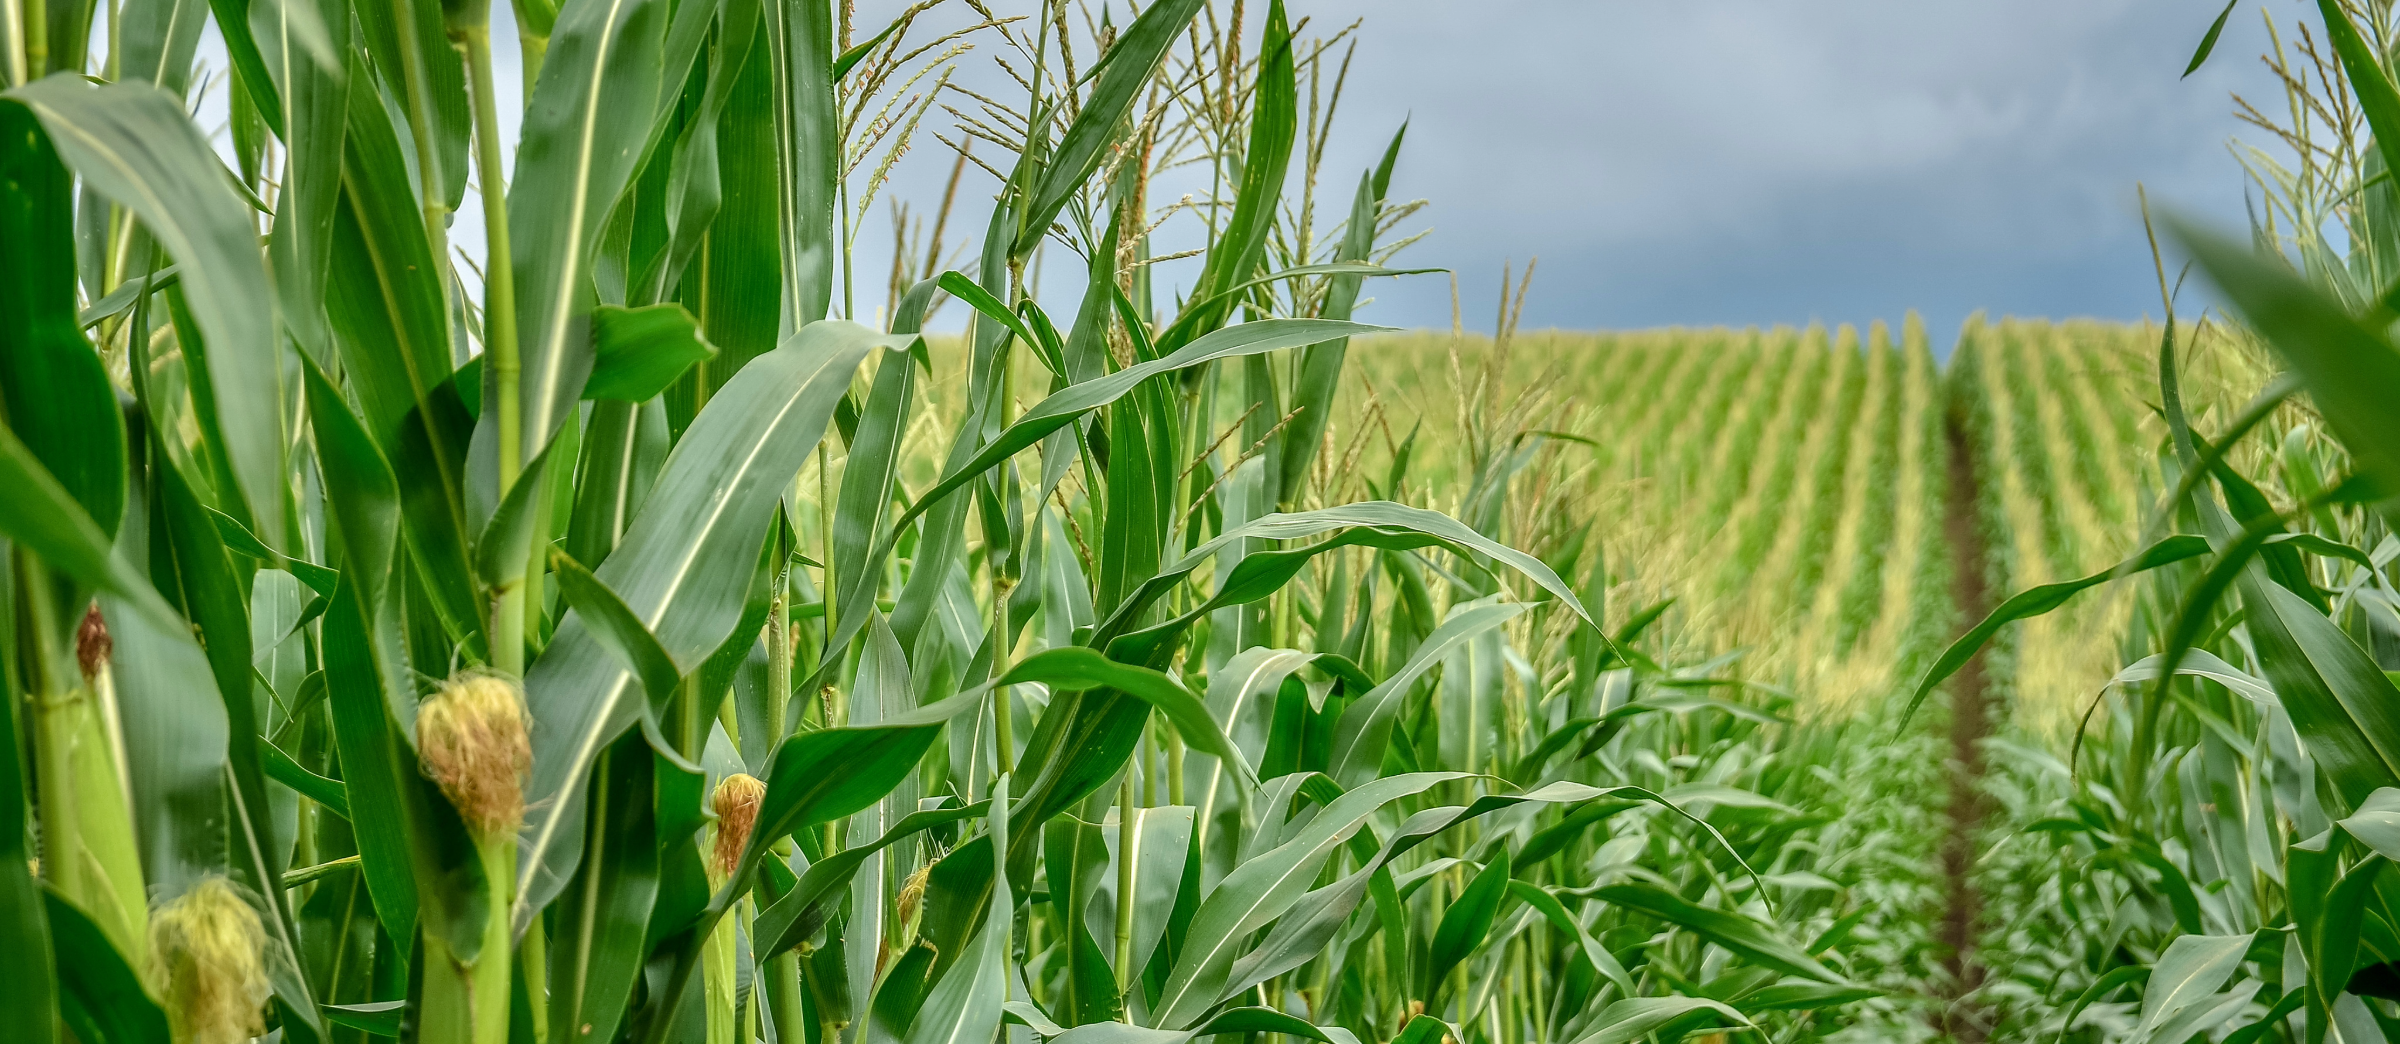
Grain Profitability Outlook 2024
Greg Halich
Grain prices have dropped dramatically in the last year. Current prices for 2024 new crop delivery are around $4.15/bu for corn, $11.00/bu for soybeans (2/23/23). This is a decrease of around $1.00/bu for corn and $1.75/bu for soybeans compared to what these prices were expected one year ago.

Subscribe to our monthly Economic & Policy Update e-newsletter to receive our top articles straight to your inbox.
Connect with Us
![]()
![]()
![]()
![]()