
U.S. Agriculture Flirting with an Annual Trade Deficit – First Time in 60 years?

Author(s): Will Snell
Published: October 29th, 2020
Shareable PDF
Trade continues to be a hot discussion item, impacting ag markets and certainly being a part of the political debate heading into the November elections. We constantly hear about the relatively large trade deficit that the U.S. economy as a whole faces given our appetite for cheaper products from overseas suppliers, but the counter in agriculture has always been, “well agriculture is much different as our sector enjoys a healthy trade surplus.” This might not be the case in 2020.
Through August 2020, the value of U.S. ag imports so far this year has exceeded the value of U.S. ag exports by $3.3 billion. If this trend continues, it would be the first time since 1959 that U.S. agriculture experienced an annual trade deficit. The U.S. achieved a record $40.1 billion ag trade surplus in 2013 and averaged a surplus of $37.7 billion during the prosperous 2010-2014 period for U.S. agriculture.
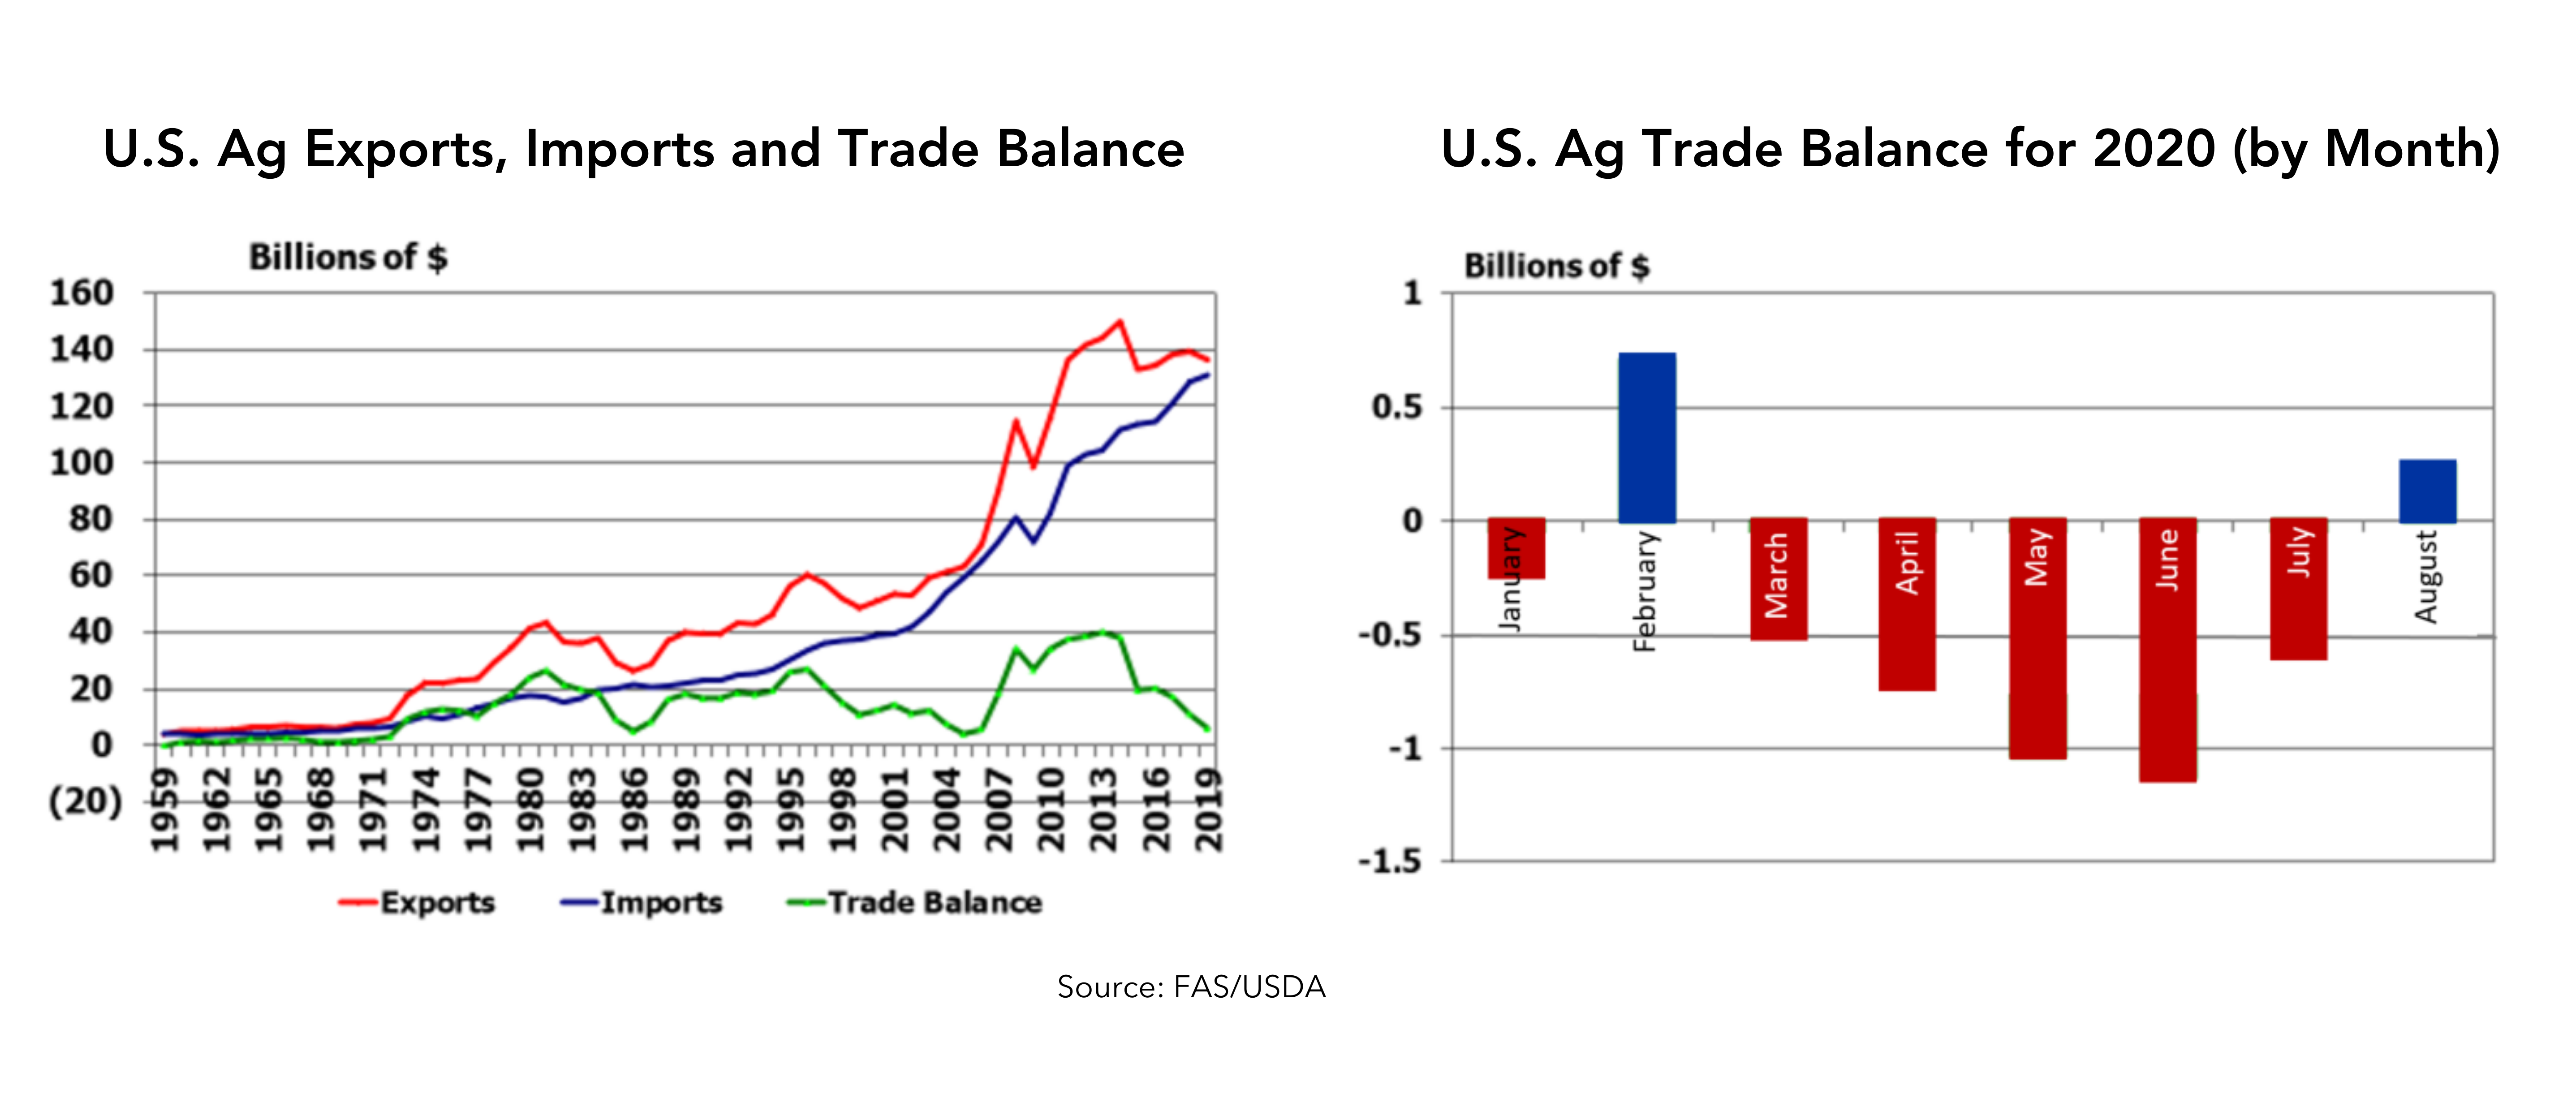
Actually, the U.S. ag trade deficit has been deteriorating for several years, not because of slumping ag exports, but primarily due to escalating imports. Ag exports have been relatively flat in recent years (around $140 billion, down 3% so far in 2020) after setting a record level of nearly $150 billion in 2014. The value of U.S. ag imports has increased annually for every year since 1987, except during the Great Recession in 2009.
Policymakers and farm organizations were hopeful that recent trade agreements with China, Japan, Mexico and Canada (USMCA) would boost U.S. ag exports and our overall ag trade balance in 2020 and beyond. While U.S. agriculture benefitted from the revised NAFTA that retained zero ag tariff levels negotiated back in the early 1990s for most ag commodities entering Mexico and Canada, trade analysts project that improved market access for dairy, poultry, and wheat under the USMCA will only provide modest export gains for U.S. agriculture in our two largest international markets. So far in 2020, Canadian purchases of U.S. ag products have remained relatively flat, but the severely depressed Mexican economy (due primarily to COVID-19) has caused U.S. ag exports to Mexico to plummet 9% in 2020, with notable losses for U.S. beef, pork and soybeans.
A lot of the trade optimism for U.S. agriculture in 2020 focused on the U.S./China Phase One trade agreement where the Chinese committed to importing 36.5 billion U.S. ag products in 2020.[1] This compares to a record level of $25.9 billion of U.S. ag export to China in 2012 which fell to $9.1 billion in 2018. Through August, U.S. ag exports to China totaled $9.2 billion so far in 2020 (up 13% compared to the same period last year), with U.S. pork being the lead story as the world’s largest pork consumer continues to rebound from the African swine fever which decimated the Chinese pork sector in 2018 and 2019. U.S. grain exports are generally slow during the spring months as China purchases readily available grain from South American crops. Reports indicate that new crop sales of U.S. soybeans, corn, and sorghum to China have been very brisk in recent months. So official trade data for September 2020 (released on November 5th) should give a clearer picture of the anticipated uptick in U.S. ag exports to China. Despite strong export activity in the past two months, U.S. ag exports to China are still projected to fall below Phase One targeted levels, unless U.S. ag exports accelerate considerably in the last quarter of 2020.[2]
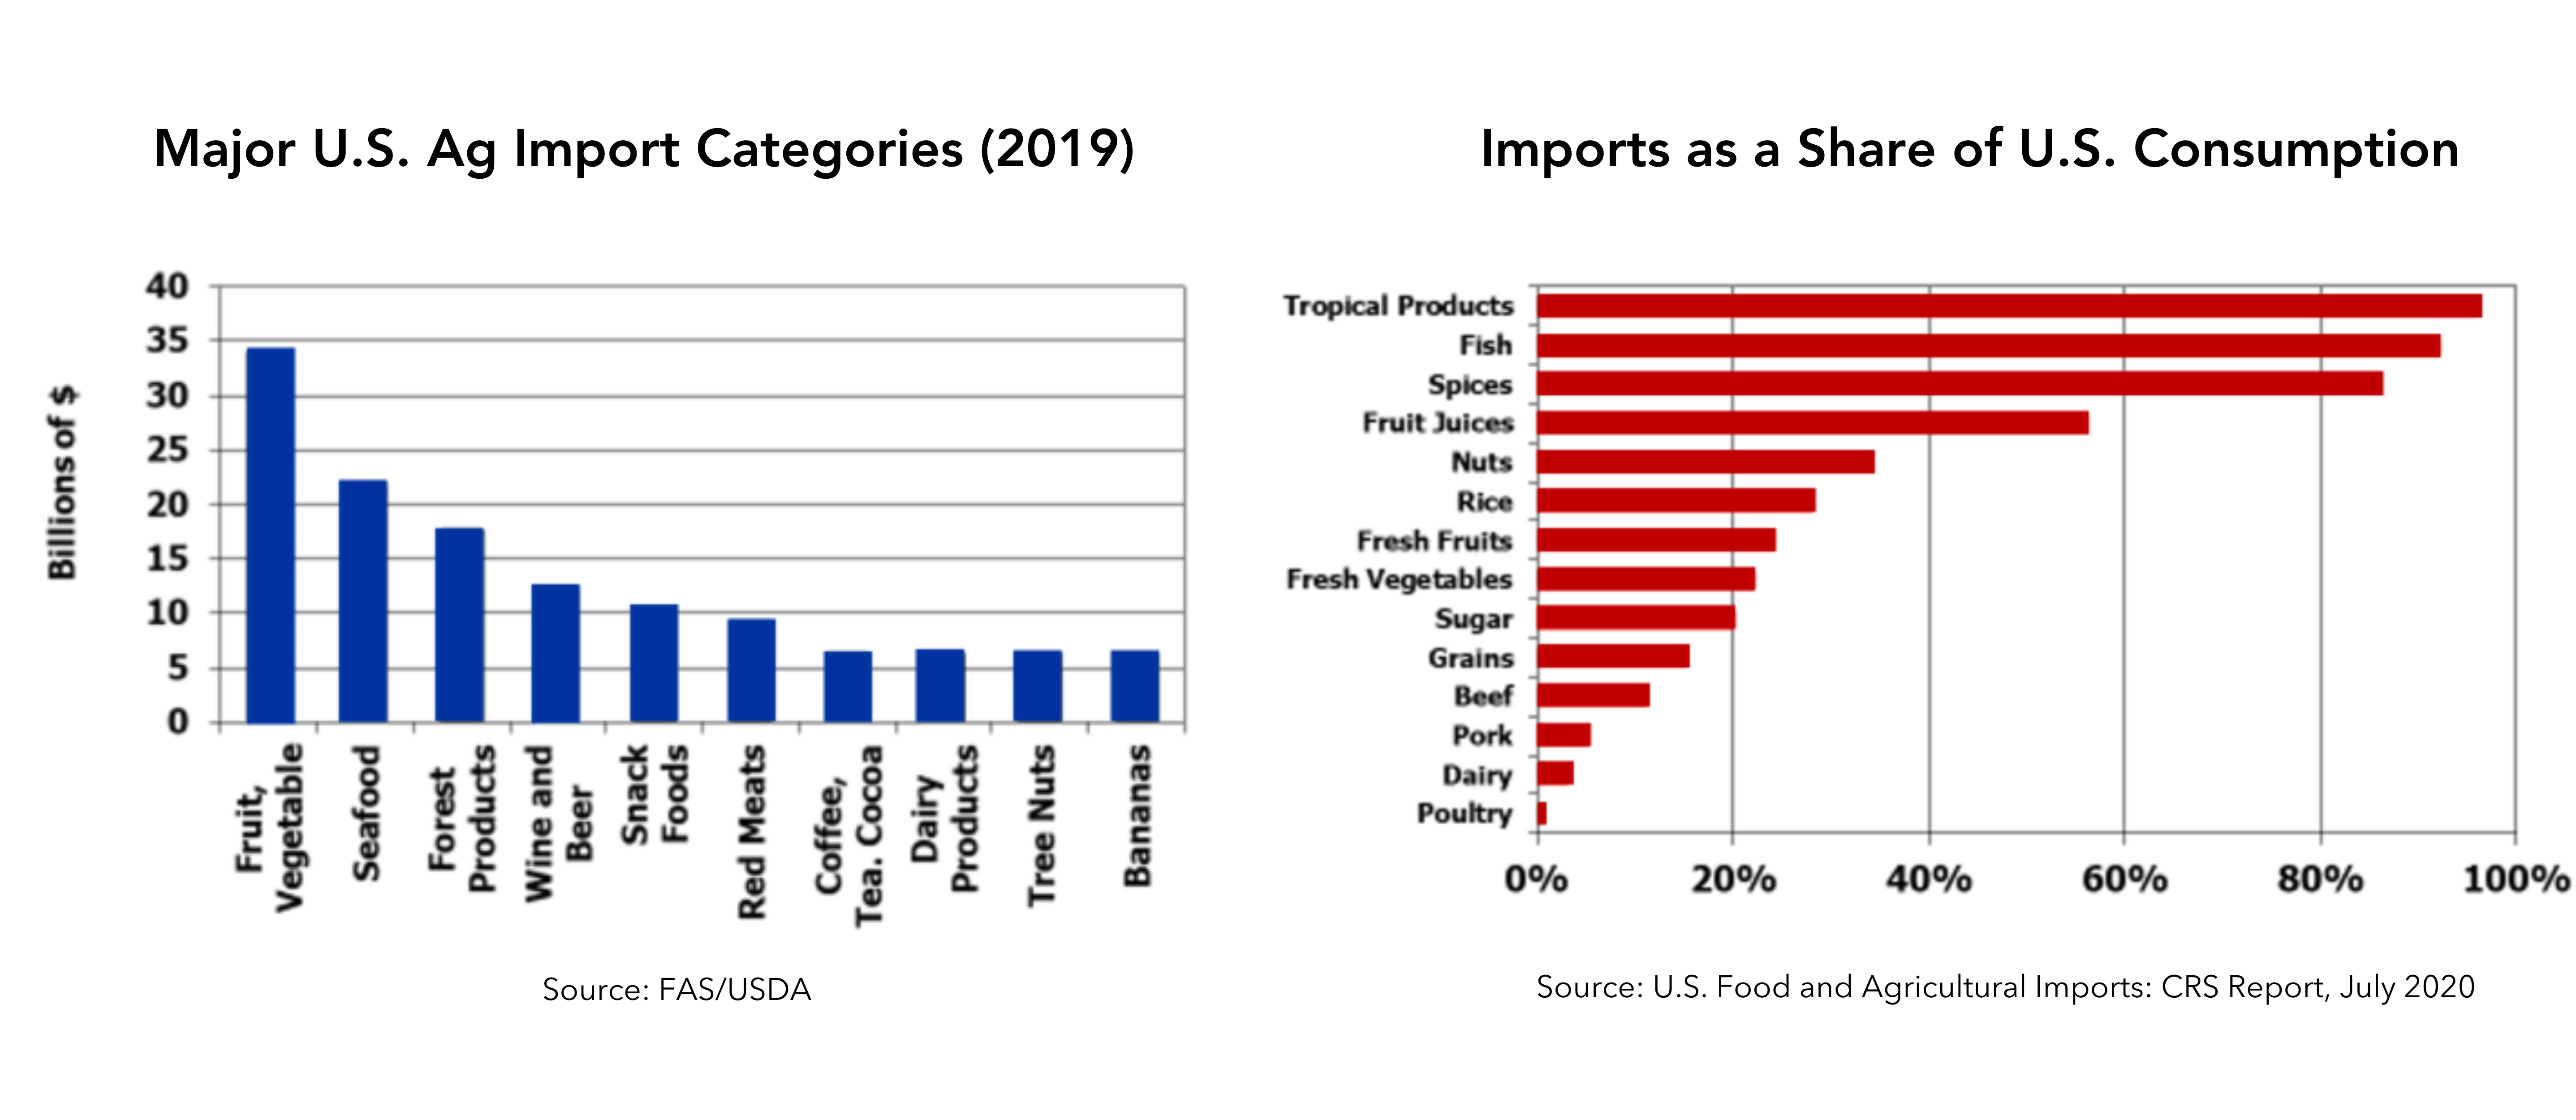
What about ag imports? Imports generally account for 15 to 20% of U.S. food consumption. The demand for imported food is dependent on many factors including the cost of imported food, (influenced by labor rates, transportation and storage costs, and exchange rates), domestic food supplies, and changing consumer preferences among U.S. consumers to a more ethnically diverse diet. Of course, there are imports of items not generally produced in the U.S. such as coffee, tea, cocoa and bananas and a relatively large market for imported wines, cheeses, snack foods and forest products. Over 90% of the U.S. consumption of fish and other seafood along with tropical products (coffee, tea, and cocoa) and spices are imported into the United States, with a relatively large portion of fruit juices, rice, tree nuts and fruits/vegetables and sugar being supplied by foreign producers. USDA reports that the fastest-growing U.S. food imports are red meats, seafood, seasonal fruits and vegetables.
While price differences (due primarily to cheaper labor costs) along with seasonal demands by U.S. consumers have induced a relatively high level of certain fruits, vegetables and tobacco imports, most ag/food imports have arguably an overall modest impact on U.S. agriculture. USDA data reveal that only around 5% of U.S. pork consumption is imported, less than 3% of dairy, and less than 1% of eggs/poultry.
Noticeably, imported beef accounts for around 11% of U.S. beef consumption, with some imported beef products certainly competing directly with U.S. beef production. But, as my colleague Dr. Kenny Burdine points out, a large percentage of the imported beef is trim, which is blended with fattier U.S. trim to produce ground beef for American consumers. The importation of this trim likely allows the U.S. beef sector to sell more muscle cuts, which are generally sold at a higher value. Plus, allowing relatively lower-priced beef imports into the U.S. may create opportunities to export higher valued beef export products to other competing markets. U.S. red meat imports are up nearly 10% in 2020, but Dr. Burdine believes a lot of the increase in 2020 was likely induced by the tightness of U.S. meat supplies back in the spring as a result of COVID-19-induced plant closures.
[1] According to the American Farm Bureau Federation, the import value includes the cost of insurance, shipping, and freight from the export port to the import port which is approximately 15% of the export value. Accounting for these costs, U.S. ag exports to China would need to total around $31 billion in 2020 to achieve the level negotiated in the Phase One agreement.
[2] A recent report released by the U.S. Trade Representative’s Office and USDA indicates that accounting for reported, not yet official sales over the past couple of months, China has met 71% of their trade obligations under the Phase I agreement. Official trade data reports in the coming months will verify if these reported sales are realized.
Author(s) Contact Information:
Will Snell | Extension Professor | wsnell@uky.edu
Related Content
Recent Extension Articles
Class I Pricing Continues to be a Major Challenge For Kentucky Dairy Producers
October 29th, 2020
A modification to the way that the base class I skim milk price was calculated has left many producers seeing much lower prices than they would have seen under the previous farm bill. The formula in the 2019 farm bill was purposely designed to yield a class I price that was almost the same as the old formula, on average. But like so many things, 2020 has been a very different story as COVID impacted markets.
Hired Farm Labor and the Role of Hispanic Workers
October 29th, 2020
Family members provide about two-thirds of the workers on U.S. farms, but the remaining one-third consists of 1.18 million hired workers. While not an insignificant number, the 1.18 million farmworkers represent less than one percent of the total U.S. wage and salary workers.
Connect with Us
![]()
![]()
![]()
![]()