
Weathering The Storm
Author(s): Jerry Pierce
Published: February 28th, 2024
Shareable PDF
“Agriculture is by nature a cyclical industry.” So said the Federal Deposit Insurance Corporation (FDIC) in History of the Eighties - Lessons for the Future published in 1987. It still is, with net incomes cycling up and down over the decades. So how can farms “weather the storm” when farm income is cycling down?
Long-term success in farming depends greatly on the ability of the farm business to meet obligations in the long term and short term. And it might be said that every business must meet its obligations this year to have a chance to meet the longer-term obligations.
Solvency is the ability of the farm to meet its obligations in the long term. Stable land prices, low interest rates, and good management have kept farms solvent over the last 10 years.
Liquidity is the ability of the farm to meet its obligations in the short term. Obligations are naturally easier to meet when incomes are high. The difficulty is operating the farm, covering family needs, replacing worn-out equipment, and meeting financial obligations when farm income is cycling down.
This was the situation many farms faced ten years ago. USDA reports net farm income (NFI) for all US farms reached a record high in 2013. Commodity prices fell drastically the next year and NFI followed. The fall in NFI bottomed out in 2016 at less than 50% of 2013’s record. For crop farms participating in the Kentucky Farm Business Management (KFBM) program the decline in net farm income was even worse. NFI fell below 25% of the 2013 high.
The graph below shows the working capital ratio (WCR) for the average KFBM crop farm for 2013-2022. WCR is a common measure of liquidity. Ag Economists suggest that a working capital ratio of 2.0 or more is healthy for a crop farm. Note how liquidity, as measured by WCR, declined in 2014-2016 as net farm income dropped. That was not a good sign to lenders. Worse, the decline in WCR meant the average farm used up $357,591 in hard-earned equity during those three years trying to meet obligations and make ends meet. The graph shows that it took four years to return to a healthy level of liquidity, aided by government help and increasing profitability.
How did these farms survive that period? First, they prepared during the higher-income years. As Kayla Breashears said in Secrets of Successful Farm Managers, they were “strategic in how they manage excess cash flow from good years.” She went on to say, “Most often, that cash is best used to bolster cash reserves.”
Second, these farmers managed the farm as a business. In What Do Higher Profit Farms in Kentucky Have in Common? Lauren Turley said, “In today’s farming culture, the farm is run just as a business.” She catalogs several factors found in the most profitable farms. Management is the common thread in all of these factors.
Another thing these farms did was to tighten up other spending during the down period. As Dr. Steve Isaacs showed in Family Living Expenses on Kentucky Farms, these were “years when net farm and non-farm income was not sufficient to cover family living. Those years can be particularly troublesome when money must be found from other sources, or borrowing has to increase, with nothing left to pay principle on debt.” He was using data from farms participating in KFBM. Note that they reduced family living following the drop in NFI and kept it low during the recovery years.
Figure 1: Working Capital Ratios for KFBM Crop Farms 2013-2022

One other thing I have observed. Farmers who seek out trusted advisors tend to fare well throughout the farm cycles. This includes advisors in tax, law, business and management, and in financing operations.
USDA is projecting net farm income for US farms to fall 25% from 2022-2024. We have entered a period of high input costs and low commodity prices that are pushing NFI down. It is too early to tell if we are entering a down cycle. But current conditions should encourage farm managers to manage cash flow, manage the farm as a business, and tighten up spending, including spending on family living.
Recommended Citation Format:
Pierce, J. "Weathering The Storm." Economic and Policy Update (24):2, Department of Agricultural Economics, University of Kentucky, February 28th, 2024.
Author(s) Contact Information:
Jerry Pierce | KFBM Program Coordinator | jerry.pierce@uky.edu
Recent Extension Articles
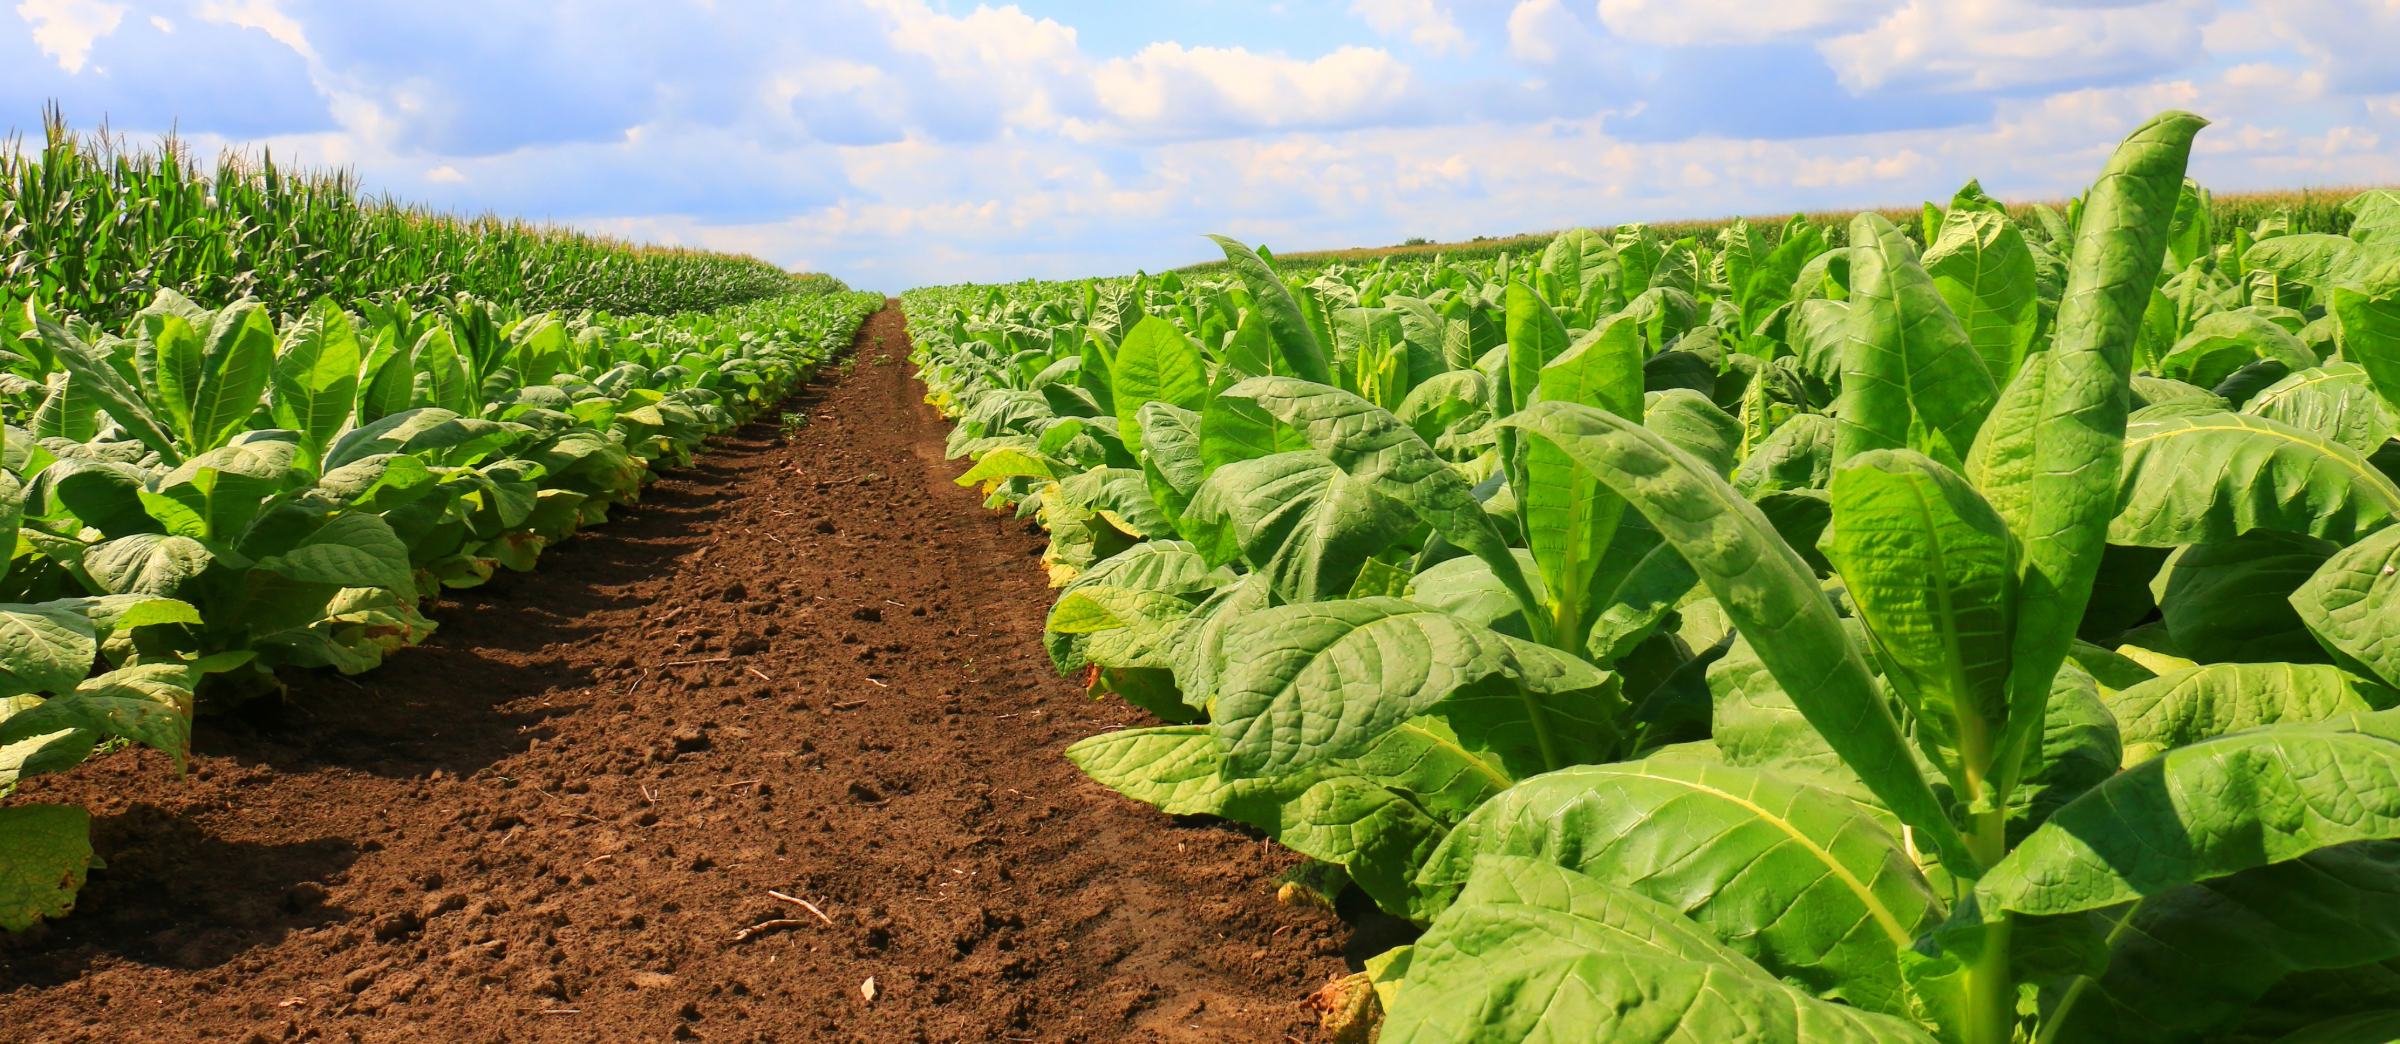
2022 Tobacco Census Data for Kentucky
Will Snell
The USDA conducts an agricultural census every five years with the latest having been released on February 13, 2024 reflecting the 2022 Census. Below are some highlights from the Census pertaining to Kentucky’s tobacco sector which undoubtedly has experienced the largest structural change of any sector and state in U.S. agriculture over the past two decades.

Price Dynamics at Kentucky Farmers Markets, 2021-2023
Brett Wolff
This month, we want to share some of the data we have from the most ubiquitous specialty crop direct market type we have in Kentucky—Farmers Markets. In 2023, there are 170 farmers markets in Kentucky where 3,000+ vendors sell a variety of specialty crops, meat, value-added, and other products (personal conversation, Sharon Spencer, KDA). Since 2004, the Center for Crop Diversification has collected price data from Farmers Markets in Kentucky.

Subscribe to our monthly Economic & Policy Update e-newsletter to receive our top articles straight to your inbox.
Connect with Us
![]()
![]()
![]()
![]()