2022 Financial Overview of Kentucky Farms
Author(s): Tarrah Hardin
Published: June 29th, 2023
Shareable PDF
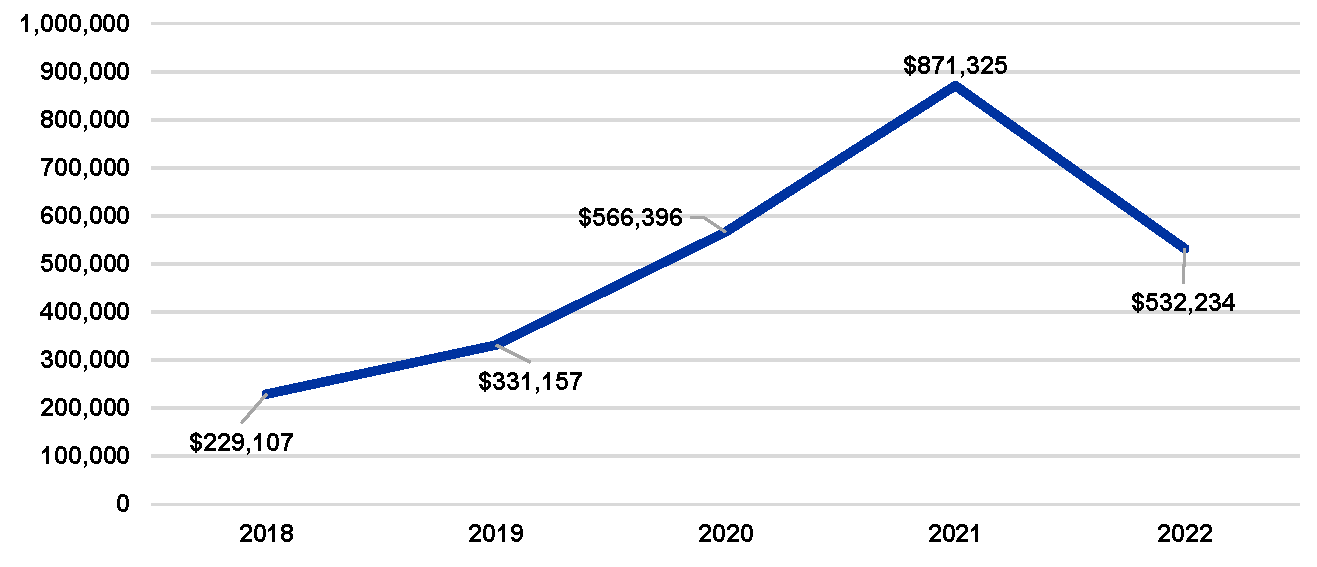
After coming off a record high Net farm income (NFI) in 2021, grain farms in Kentucky Farm Business Management (KFBM) program saw their net farm income decrease to levels below pre-pandemic. Net farm income is the value of farm production less total operating expense and deprecation. There were 199 grain farms that provided farm data to KFBM in 2022 for an average NFI of $532,234. The main cause of the downturn in NFI, comes from the increase in operating expenses. From 2021 to 2022, the average went from $1,676,458 to $2,123,466 respectively. That is an increase of $447,008 in expenses, while gross farm returns only increased $130,767 in 2022.
Figure 1: Net Farm Income of KFBM Farms, 2018-2022

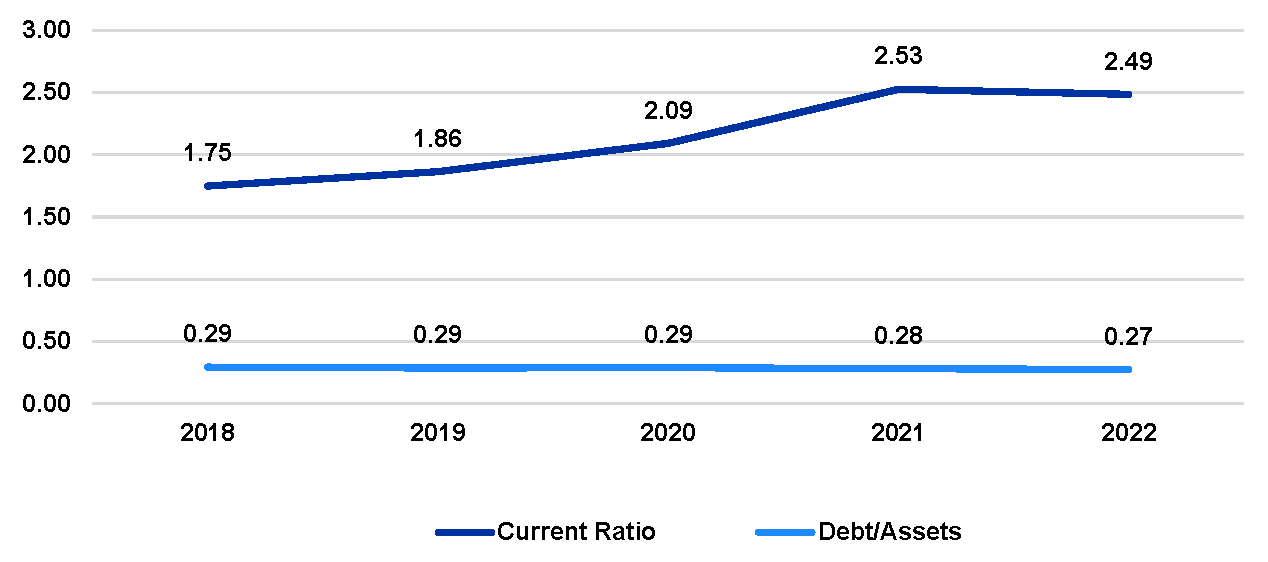
Even though profitably decreased on average in 2022, farm liquidity remained high. When a farm is liquid it means the farm can turn assets into cash very easily. The current ratio, total current assets divided by total current liabilities, is one way to measure liquidity with the goal of that number being close to 2. For 2022, the current ratio was 2.49 down from 2.53 in 2021 but still above the target. Solvency is also another measure of financial well-being, and determines the ability to pay off debt. Debt to Asset ratio is a good measure of solvency with below 0.3 being the goal. Over the few years, the grain farms that participate in FBFM, have remained just under the goal. In 2022, the debt to asset ratio was 0.27, while in 2021 in was 0.28.
Figure 2: Liquidity and Solvency of KFBM Farms, 2018-2022

Over all, the 199 farms in KFBM’s data did well considering all the uncertainties 2022 brought. For the farms in the program, they will be able to use their information from 2022, to help determine how to budget and be able to discuss where they are financially with their lender. If you would like more information about the Kentucky Farm Business Management program, please contact one of the Kentucky Farm Business Analysis Specialist(s) in your area.
Recommended Citation Format:
Hardin, T. "2022 Financial Overview of Kentucky Farms." Economic and Policy Update (23):6, Department of Agricultural Economics, University of Kentucky, June 29th, 2023.
Author(s) Contact Information:
Tarrah Hardin | KFBM Area Extension Specialist | tarrah.hardin@uky.edu
Recent Extension Articles
Ag Export Growth Subsides Amidst a Changing Global Economy
Will Snell
After achieving a record high of $196.4 billion in FY 2022 (October 1, 2021- September 30, 2022), USDA has for the second time reduced its 2023 FY forecast for U.S. agricultural trade – down to $181 billion compared to $184.5 billion estimate in February and its initial estimate of $190 billion last November.
Kentucky Dairy Product Shoppers: Perceptions of Local Sourcing and the Environment
Tim Woods, Shuoli Zhao, Azita Varziri, and Camille Dant
A significant survey was completed during the early part of 2023, exploring the values and demand perceptions of Kentucky consumers of dairy products. This survey of 827 individuals explored a wide range of attitudes and behaviors connected with a range of food sourcing and impact considerations.


