Food Price Inflation – Trends and Implications for U.S. and Global Consumers
Author(s): Will Snell
Published: April 28th, 2022
Shareable PDF
Inflation dominates today’s conversation among the media, politicians, and everyone impacted–i.e., all of us as consumers. Inflation is defined as a general rise in prices which causes a decline in purchasing power of consumers and producers over time, holding all other factors constant. Some “analysts” would argue that it represents a “tax” on consumers when it evolves from government actions such as expansionary fiscal or monetary policies. Inflation can originate from a series of events in the marketplace such as supply chain disruptions or a significant improvement in consumer demand conditions. A relatively moderate level of inflation is generally viewed by economists as “good” reflecting a healthy and growing economy. However, a sustained period of rapidly rising prices can produce devastating outcomes on many market participants and the overall general economy.
Our January 2022 newsletter article titled Inflation – “Good” or “Bad” for Agricultural Producers and Consumers? focused primarily on the effects of rising prices on ag producers where the outcome of inflation on farmers may be mixed depending on a variety of factors. This article highlights the effects of inflation on ag (i.e., food) consumers and compares food price inflation in the U.S. versus global consumers.
The chief measure of inflation in the United States is the Consumer Price Index (CPI), which is released monthly by the Bureau of Labor Statistics (BLS). Food is a major component of the CPI, comprising 13.4% of the index -- 8.2% for food purchased for at-home consumption versus 5.2% for food purchased away-from-home. [1] The latest CPI report (released April 12, 2022) indicated that U.S. consumer prices have increased 8.5% over the past twelve months, with energy prices being the major contributor, up 32% over the past twelve months and food prices up 8.8% since March 2021. Excluding the volatile energy and food sectors, overall U.S. inflation was lower, coming in at 6.5% over the twelve-month period.
Unlike some consumer items such as travel, home remodeling, or new automobiles, which can be delayed or eliminated from purchasing decisions during inflationary periods, food is a necessity. While consumers can substitute lower priced items at the grocery store (e.g. ground beef versus steak) or downscale dining options away from home (e.g., fast food restaurants versus casual/sit-down restaurants), consumers will still need to purchase or have access to food several times daily, even in midst of rising prices.
Consumer research indicates that food price inflation has a greater impact on the lower-income consumers who generally spend a much larger percentage of their disposable income on food. According to USDA data, U.S. households with the lowest 20% of income spent 27% of their income on food in 2020 versus only 7% among the top 20% of income-earning U.S. households. Unfortunately, higher food prices may induce some lower-income consumers to avert other critical purchasing decisions such as routine health care visits, prescriptions, or insurance coverage in order to feed their families. It also elevates food insecurity among many segments of the population, increasing the need for food assistance programs and access to food banks. Plus, higher food prices contributing to a hike in overall inflation may induce action by monetary authorities to raise interest rates, hurting those who borrow money or depend on income from investments adversely impacted by rising interest rates.
I tell students in my Food and Ag Marketing Course that during their lifetimes they have never really experienced any noticeable degree of inflation, especially food price inflation until the past couple of years. From 2000 to February 2020, food price inflation in the U.S. averaged 2.4% annually. In fact, we had several months during this period of food price deflation where aggregate food prices actually fell. However, we all know the environment has changed drastically over the past two years.
During the early months of the Covid-19 pandemic, food price inflation in the U.S. was fairly modest due to adequate supplies of most food items (with some meats being an exception) and fairly intense retail market competition. From March 2020 to March 2021, U.S. food prices increased 3.4%, but have increased another 8.8% over the past twelve months – the highest annual increase in U.S. food prices since 1981. While very alarming to most consumers, the current level of food price inflation is nowhere near the levels experienced for several months during the early 1970s when U.S. consumers faced annualized food price inflation exceeding 15%.[2]
Figure 1: U.S. Food Price Inflation
(1970-2022)
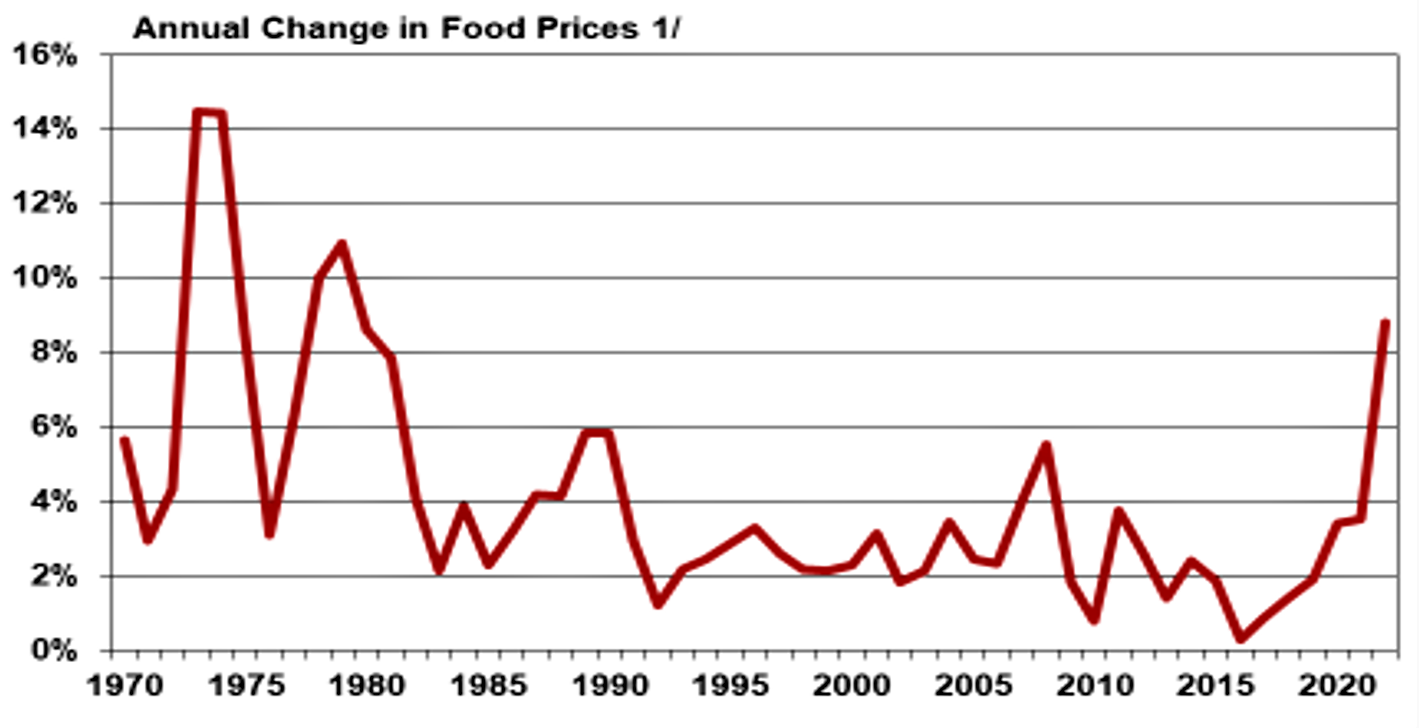
Source: Federal Reserve Economic Data (FRED).
1/ Notes: 2022 data reflect changes in prices from March 2021 to March 2022
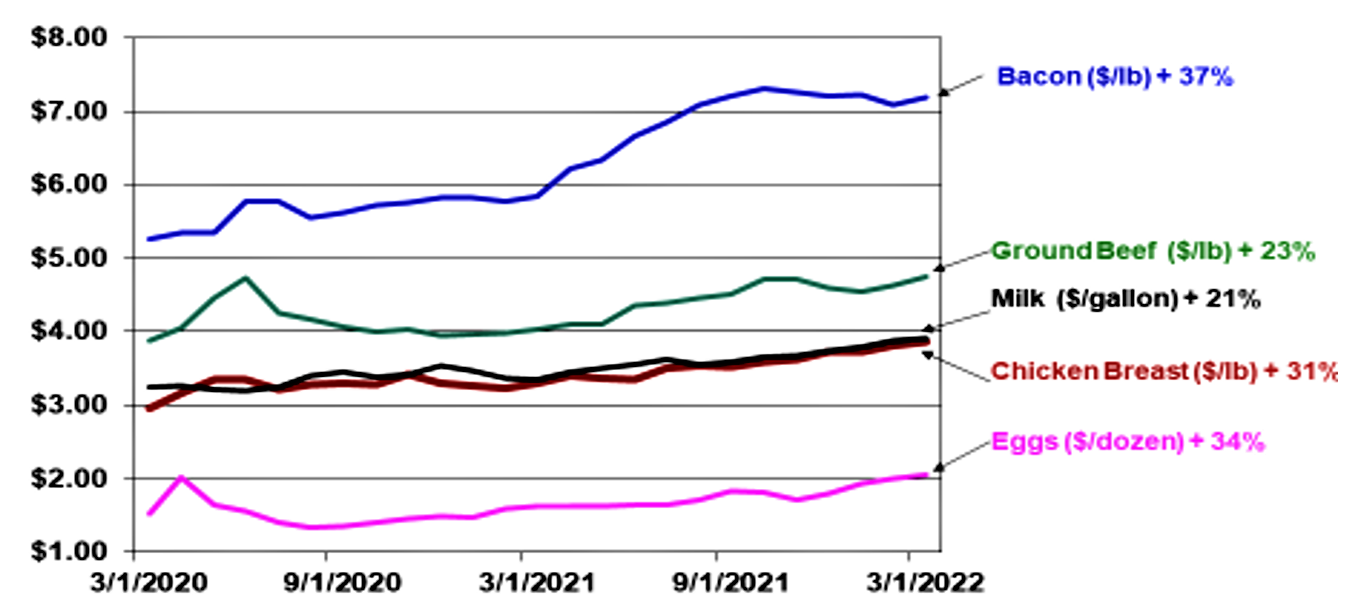
Since March 2021, food-at-home (primarily grocery store purchases) increased 10% -- the largest twelve-month increase since March 1981, while food away-from-home (primarily restaurant purchases) increased 6.9%. Meat prices led the way with beef prices up 16.0% over the past twelve months, followed by pork, 15.3% higher, and poultry up 13.2%. Cereal and bakery product prices were 9.4% higher, while fruits and vegetables prices were up 8.5%, and dairy prices up 7.0%. USDA projects that overall food prices will increase between 5 and 6% in 2022.
Figure 2: Prices of Selected Food Items
(March 2022 vs March 2020)
Source: Federal Reserve Economic Data (FRED) using data from the Bureau of Labor Statistics (BLS)
Over the past two years, there have been a wide variety of factors contributing to higher food prices, including labor challenges, escalating fuel costs, a lack of truck drivers, port congestion, plant closures, and other issues leading to supply chain disruptions, along with rising ag commodity/input prices, weather events, disease outbreaks, and more recently the food production/trade impact of the Russian invasion into Ukraine. Collectively, Russia and Ukraine represent over 30% of the global wheat exports, nearly 20% of global corn exports and account for over 10% of global caloric consumption. In addition, this area of the world produces a lot of the ingredients used in the production of fertilizers. The ongoing war is affecting the production and distribution of fertilizers worldwide, limiting availability and putting additional upward pressure on global fertilizer prices which were already soaring prior to the invasion. Russia is also a major energy producer/exporter causing additional upward pressure on global fuel prices. Given higher input costs, lack of access to inputs, trade disruptions, and a war playing out, Ukraine ag/food production and trade is expected to be down 20% or more in 2022, contributing to soaring crop prices, escalating global food price inflation, and causing much concern over food security and famine in parts of Europe, Africa, and Asia that were already reeling from Covid-19 effects.
While food price inflation in the U.S. has hit 40-year highs exceeding 8.5%, global food price inflation for the past twelve months is up more than 30% according to the latest data from the United Nation’s Food and Agriculture Organization (FAO). Food price inflation has a much greater adverse impact on consumers in lower-income nations where food may account for 25 -50% or more of consumer income versus less than 10% in the U.S.
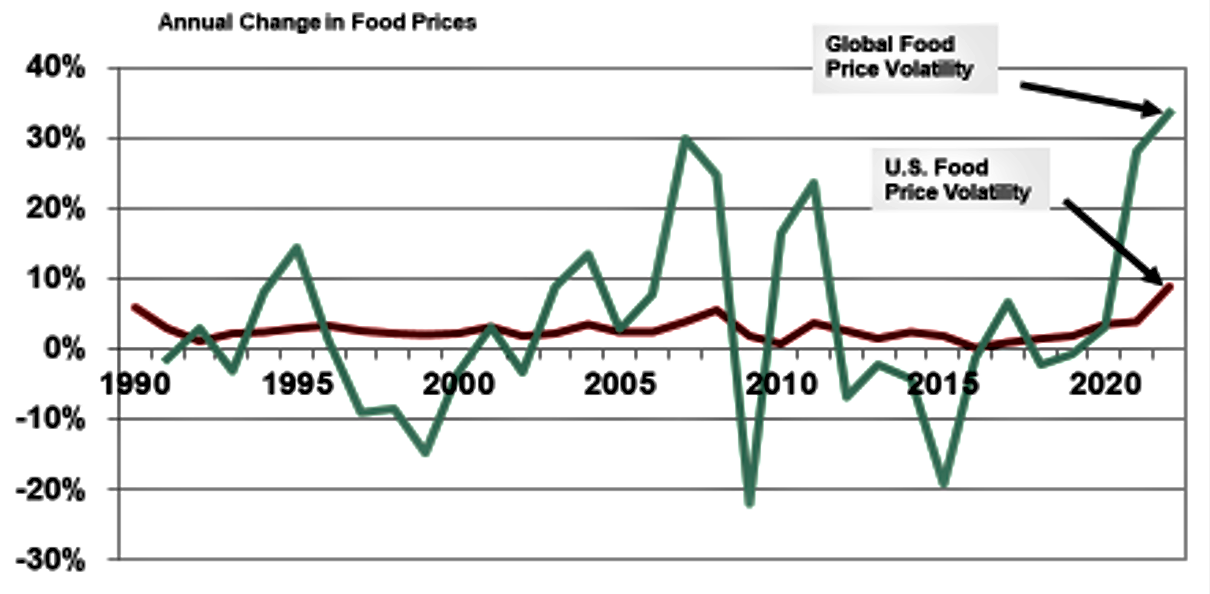
The chart below illustrates that global food prices tend to be much more volatile than U.S. food prices. One major factor contributing to this observation is that food in other parts of the world tends to be processed less compared to the U.S. resulting in retail food prices in those markets being impacted more by changes in ag commodity prices versus the U.S.[3] In addition, food consumers outside the United States generally consume more calories at home versus U.S. consumers where the cost of food for home consumption is more dependent on changes in ag commodity prices. Plus, marketing efficiencies, market competition, less yield variability, and availability of storage capacity present in the U.S. enables U.S. food prices to be less affected by changes in global commodity prices compared to consumers in many developing nations.
Figure 3: Food Price Volatility: U.S. vs Global
(1990-2022)
Source: Federal Reserve Economic Data (FRED), and Food and Agriculture Organization (FAO) Food Price Index Note 2022 data based on March 2021 - March 2022 period.
As an example, farm-level wheat prices have soared 50-75% or more in recent months given recent geopolitical events resulting in higher prices for many bakery products using wheat as a main ingredient. According to USDA data, prior to the recent run-up in wheat prices, the farm value of bread in the U.S. was only around 5 to 9 cents per one pound loaf. Thus, a 50-75%% increase in wheat prices alone would only add a few pennies to the cost of bread for a U.S. consumer. CPI data reveal that U.S. white bread prices have increased 8 cents/loaf or (5.3%) over the past twelve months, reflecting not only higher wheat prices, but also higher transportation, packaging, and labor costs. This compares to news reports indicating that bread prices have increased 25 to 50% or more in some global markets since the Russian invasion.[4] This situation is given to a rise in panic buying, black markets, government corruption, and fear of riots which have historically occurred in some vulnerable markets given sudden large hikes in food prices and food shortages. In addition, the International Monetary Fund (IMF) expects global economic growth to slow significantly this year (3.6% versus 6.1% in 2021) as the repercussions of the war in Ukraine spread worldwide and nations feel the effects of rising inflation and interest rates. Globally, the IMF is projecting that food prices will increase 14% in 2022. Unfortunately, the global food inflation/food crisis will be magnified in the coming months if the war in Ukraine drags on for a significant period of time and global grain supplies outside of the Black Sea region do not respond to current price incentives or we observe significant adverse weather events in other major grain-producing areas.
[1] Prior to the Covid-19 pandemic, the weight for food prices as part of the CPI was very similar (13.8%), but was split more evenly between food-at-home (7.6%) vs food-away-from-home (6.2%).
[2] U.S food price inflation averaged 7.8% during the decade of the 1970s versus 4.6% during the 1980s, but has been rather benign over the past three decades (averaging 2.8% during the 1990s, 2.9% during the 2000s and 1.7% during the 2010s).
[3] According to the USDA, the farm value of the retail food dollar in the U.S. is around 15 cents vs exceeding 50% of the retail value in some poverty-stricken nations.
[4] The FAO cereal price index reflects a 37% increase since March 2021.
Recommended Citation Format:
Snell, W. “Food Price Inflation - Trends and Implications for U.S. and Global Consumers." Economic and Policy Update (22):2, Department of Agricultural Economics, University of Kentucky, April 28th, 2022.
Author(s) Contact Information:
Will Snell | Extension Professor | wsnell@uky.edu
Recent Extension Articles
The Importance of Agriculture for Kentucky: March 2022 Report Update Now Available
Sarah Bowker | April 28th, 2022
Our unit, the Community and Economic Development Initiative of Kentucky (CEDIK), recently updated the 2015 report, The Importance of Agriculture for Kentucky. The report defines the economic impact of the Agricultural sector on the Kentucky economy. In our March 2022 update, the primary finding is that the total economic impact of agriculture in Kentucky in 2019 equaled $49.6 billion, representing an 8.8% increase from the economic impact of $45.6 billion in 2012.
What is the Driving Force behind Carbon Programs in the U.S. and Why Agriculture?
Jordan Shockley | April 28th, 2022
As new carbon programs continue to become available to row crop farmers across the country, understanding the driving force behind why these programs exist in the first place is key to determining their longevity. This article goes in-depth to address the question of why? Why do these carbon programs currently exist, and why are they focused on the agriculture sector?

