2025 Farmland Values
2025 Farmland Values
USDA releases the results of their annual survey of farmland values each August. The 2025 report indicates that national farm real estate values increased by 4.3% to an average of $4,350/ac. Kentucky farm real estate values increased 3.4% to an average of $5,480/ac. When categorized as Cropland and Pasture, Kentucky’s prices increased by 3.7% for cropland and 3.4% for pasture to $6,450/ac and $3,900/ac respectively.
The average farm real estate value is the widely reported U.S. Farmland Value. The USDA average is a broad indicator of changes in land values. The average is not derived from sale prices. The survey includes data from approximately 9,000 tracts of land of about one square mile each across the continental United States. The survey takes place in early June and reports the separate values of cropland, pastureland, and the value of all land and buildings to arrive at an average “farm real estate value.” The 2025 per acre value of $4,350 is up from $4,170 in 2024. State level values are also reported. The complete 2025 Land Values Summary is available from the National Agricultural Statistics Service of USDA.
Land value trends are widely reported in the farm literature, usually in the format of Figure 1 without an inflation adjustment. This graphic captures data between 1970 when farm real estate was valued at $196/acre and 2025 with its $4,350/ac in nominal dollars (actual observed values). Figure 1 includes inflation adjusted values as well with values indexed to 2024. The 1970 inflation adjusted value (also called real value) was $1,532/ac in 2024 dollars. In real terms, land values rose dramatically through the 1970s and peaked at $2,927/ac in 1981 prior to the ag financial crisis of the 80s. Real values plummeted to $1,543/ac in 1993, a 47% decline returning to their 1970 values. Real values did not exceed the 1981 highs until 2007.
Another way to approach changes in land values is in its year-to-year change. Figure 2 is a longer view of land value. Data has been available for the past 115 years. The changes from the previous year are indicated by a percentage difference from the previous year. Events like the Great Depression of the 1930s, the 70s boom, and the 80s farm financial crisis are readily apparent. While land values have increased in the long run, they do not increase every year. In fact, in 23 of the past 115 years, land values have been lower than the previous year. If the annual change is adjusted for the annual inflation rate, land values have decreased about 40% of the time.
Let’s turn to Kentucky land values. They tend to move similarly to national values with Kentucky average farm real estate values that exceed the U.S. average. The last 25 years are illustrated in Figure 3. On a nominal basis, Kentucky’s land value has increased by $3,880/ac since 2000. It is notable that there was a six-year period from 2007 to 2013 that Kentucky land values were flat to declining. Several factors may account for that including ag commodity prices and a slowing of the general economy. That period also coincides with the end of the tobacco quota program. The value of the quotas (which were attached to the land) had been capitalized into the price of land. It is likely that the loss of that asset had a dampening effect on land values in that period.
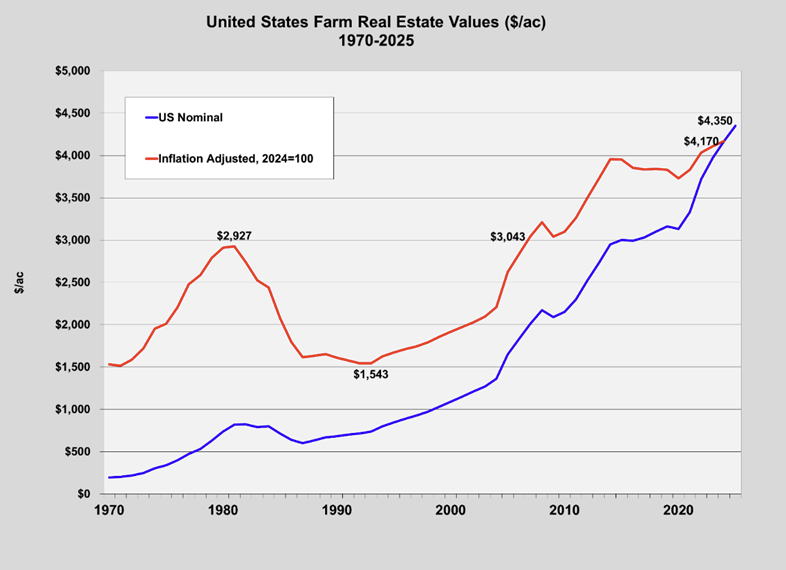
Figure 1: United States Farm Real Estate Values ($/ac)
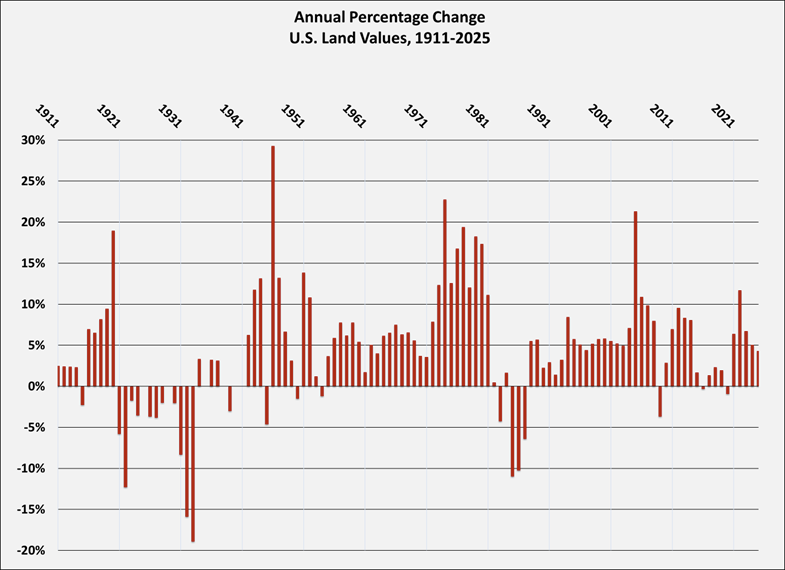
Figure 2: Annual Percentage Change of U.S. Land Values, 1911-2025
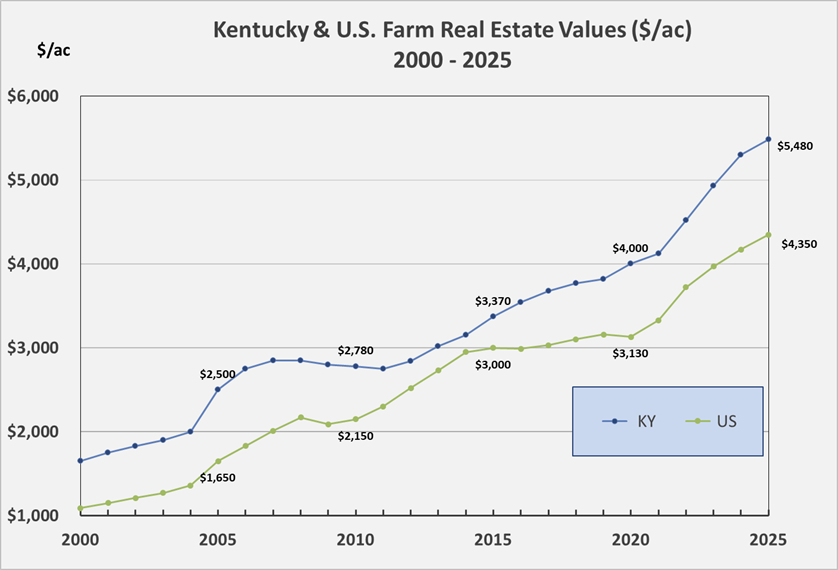
Figure 3: Kentucky & U.S. Farm Real Estate Values ($/ac)
Recommended Citation Format:
Isaacs, S. “2025 Farmland Values.” Economics and Policy Update (26):8, Department of Agricultural Economics, University of Kentucky, August 2025.
Author(s) Contact Information:
