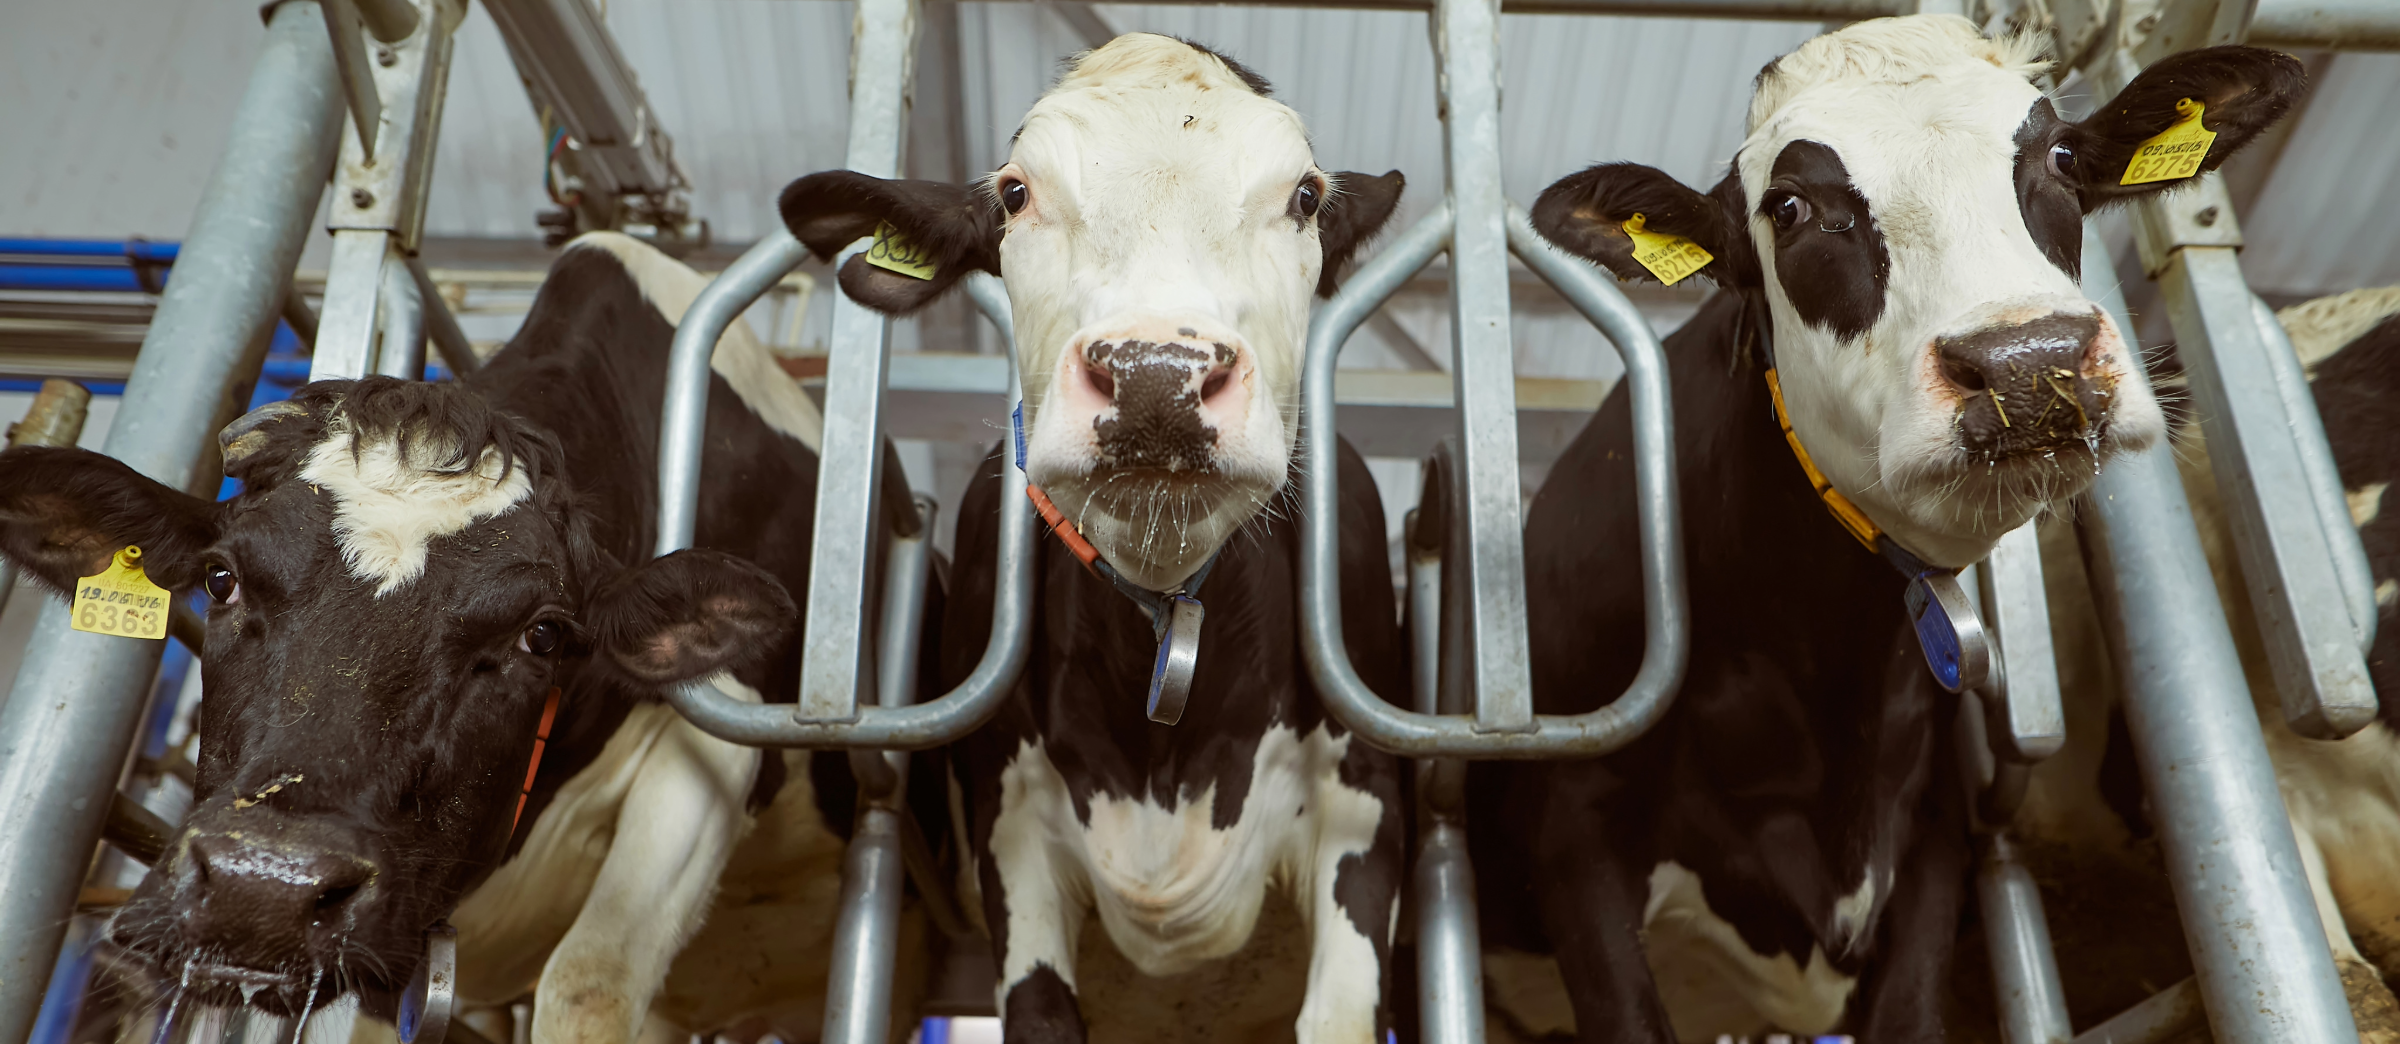
Butterfat Continues to be a Major Driver of Milk Value
Butterfat Continues to be a Major Driver of Milk Value

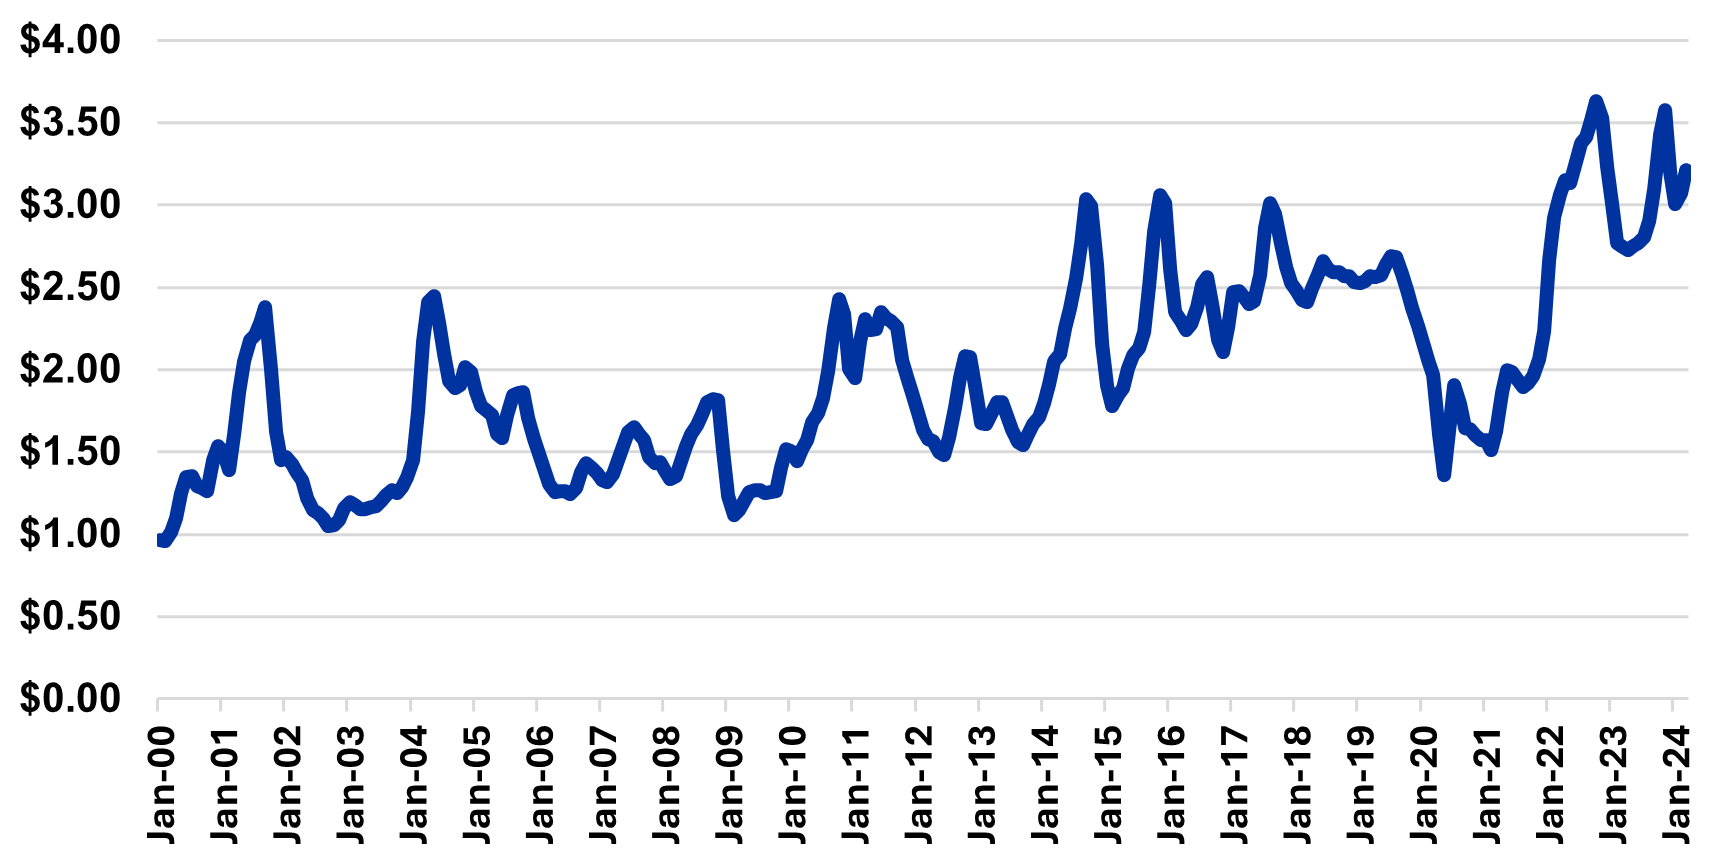
Kentucky dairy producers are ultimately paid based on the amount of skim milk and butterfat they produce. Needless to say, these two values greatly impact returns for dairy operations and the impact of butterfat has gotten larger over time. For some perspective, I am showing the historical Uniform Butterfat Price for the Southeast Federal Milk Marketing Order (FMMO #7) in Figure 1. This is one of two federal orders that primarily cover the state of Kentucky. The average monthly uniform butterfat price for the Southeast Milk Marketing order was $2.98 per lb. during 2023. Ten years prior, the average uniform butterfat price for the same order was $1.68 for the year 2013. Monthly uniform butterfat values are shown in Figure 1 going back to January of 2000. There has been significant volatility, and the impact of COVID is pretty clear, but this general uptrend is evident - butterfat has become increasingly valuable over the last 24 years.
Figure 1: Uniform Butterfat Price - FMMO #7 ($ per lb)

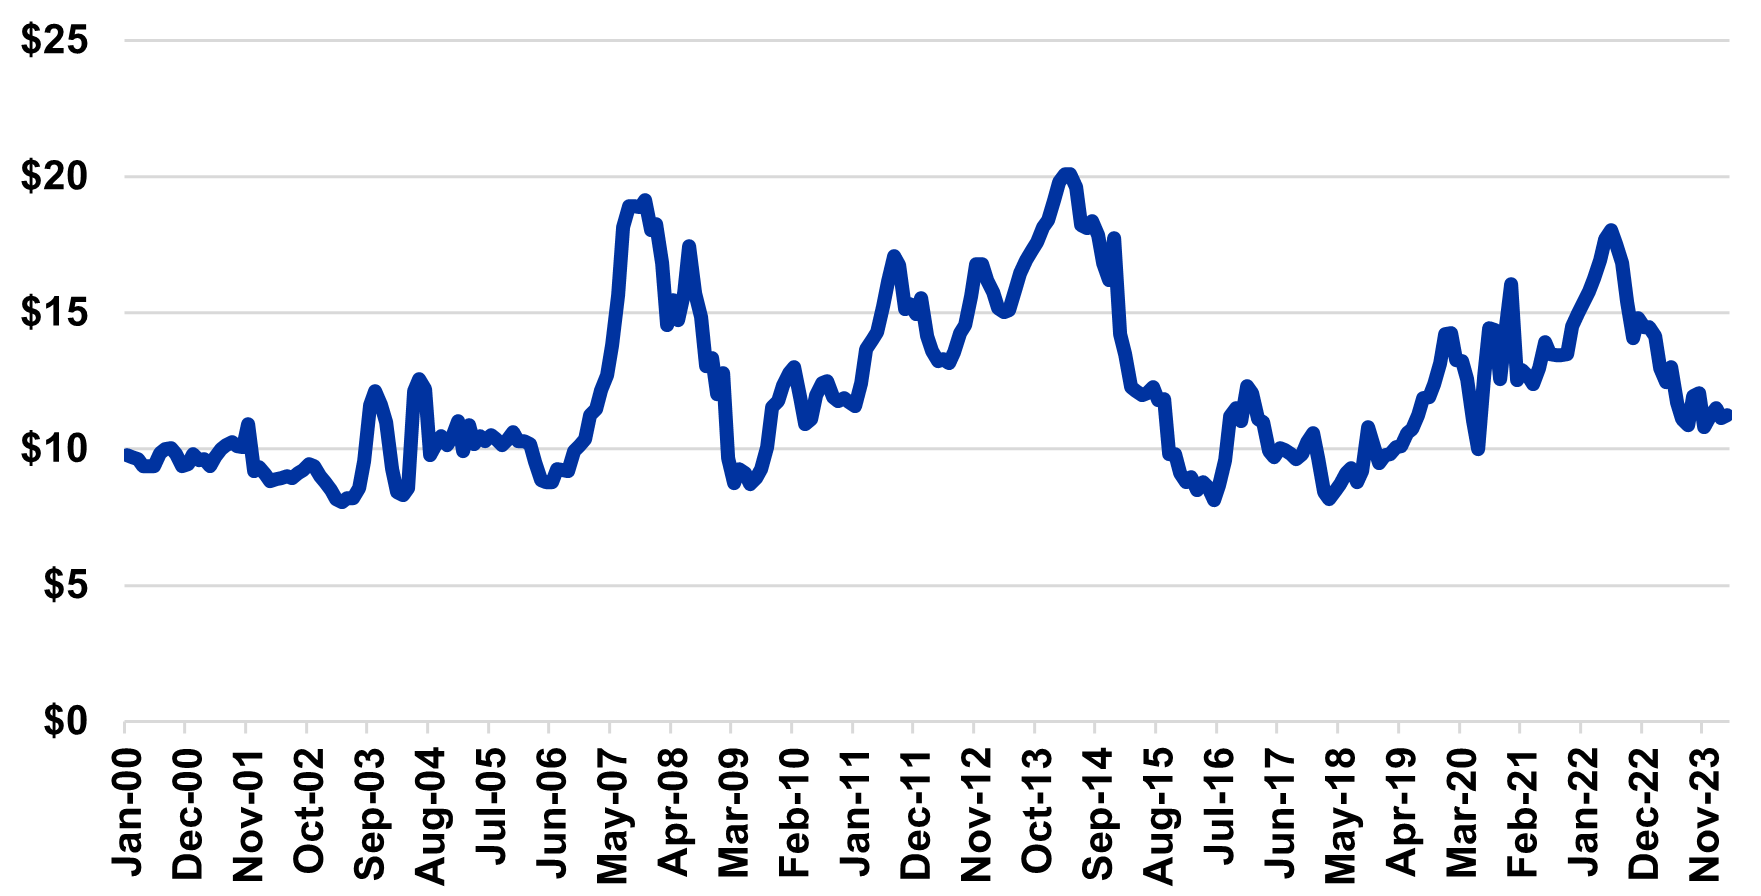
In the interest of painting a complete picture, I am showing the Uniform Skim Price for federal order #7 in Figure 2. As with the butterfat series (Figure 1), volatility is clearly present. One can see strong skim milk price levels in 2007, 2014, and 2022, but one can also see multiple times when skim milk prices were south of $10 per cwt. There is an upward trend over time in skim milk price, but that upward trend is not as easily discerned by the eye as the trend in butterfat prices.
Figure 2: Uniform Skim Milk Price - FMMO #7 ($ per cwt)

Because butterfat only represents a small percentage of the milk that is produced, it is easy to underestimate its significance on milk price at the farm level. The most recent uniform price report from FMMO 7 was for March of 2024 and will be used to make this point. For the month of March, the uniform skim milk price was $11.23 per cwt and the butterfat price was $3.2099 per lb. When uniform milk prices are calculated by the orders, they are done so by assuming 3.5% butterfat levels. With that 3.5% butterfat assumption and a $3.2099 butterfat value per lb, each cwt of milk yields a butterfat value of $11.23 (3.5 lbs @ $3.2099 per lb). At the same time, the skim milk value from a cwt of milk was calculated to be $10.84 (96.5 lbs @ $11.23 per cwt). Combining the butterfat and skim values results in a uniform milk price of $22.07 per cwt for the month of March. This calculation can be seen in the first row of Table 1. Note that even at 3.5%, the butterfat value represents just over half of the uniform milk value. (Note: this is actual price data from the order; the fact that $11.23 shows up twice in the calculations is a mere coincidence.)
This uniform milk price does not represent the price that an individual dairy producer would receive as that would be impacted by any premiums and/or deductions, as well as how their location differential compares to that of the base zone. However, I want to bring us back to the focus of the article and use Table 1 to discuss the potential impact butterfat can have on an individual dairy farmer’s milk check. As the butterfat percentage increases, the producer is essentially trading skim milk for more butterfat. Since the value of butterfat exceeds that of skim, this trade results in higher milk prices. This impact is estimated in Table 1 by running the same milk price calculation for butterfat percentages from 3.5% to 5.0%. At 5%, milk price exceeds $26 per cwt, and butterfat accounts for over 60% of that value.
For the reasons mentioned above, readers should use the specific prices with caution as they are really just used for illustration. But the difference in milk price as butterfat increases is very telling. Note that each additional 0.25% increase in butterfat results in an increase in milk value of $0.77 per cwt. Table 1 looks only at price and does not consider the potential for increased expenses that may be associated with increasing butterfat. These can take the form of nutritional programs, management practices, and/or impacts on production levels and should absolutely be considered. But given the value differences calculated in Table 1, it is also clear why increasing butterfat has been a focus of many dairy farmers in recent years.
Table 1: Uniform Skim Milk and Butterfat Price and Their Impact on Milk Value (March 2024, Southeast Federal Milk Marketing Order)
| % Butterfat | Skim Milk Value | Butterfat Value | Milk Price | % of Value from Butterfat |
|---|---|---|---|---|
| 3.50% | $10.84 | $11.23 | $22.07 | 50.9% |
| 3.75% | $10.81 | $12.04 | $22.85 | 52.7% |
| 4.00% | $10.78 | $12.84 | $23.62 | 54.4% |
| 4.25% | $10.75 | $13.64 | $24.39 | 55.9% |
| 4.50% | $10.72 | $14.44 | $25.17 | 57.4% |
| 4.75% | $10.70 | $15.25 | $25.94 | 58.8% |
| 5.00% | $10.67 | $16.05 | $26.72 | 60.1% |
Estimated from March 2024 Uniform Price Computations for FMMO #7. Uniform Skim Milk Price was $11.23 per cwt and Uniform Butterfat Price was $3.2099 per lb.
Recommended Citation Format:
Burdine, K. "Butterfat Continues to be a Major Driver of Milk Value." Economic and Policy Update (24):4, Department of Agricultural Economics, University of Kentucky, April 29, 2024.
Author(s) Contact Information:
