Mid-year Cattle Inventory: Thoughts on Heifer Retention and Feeder Cattle Outside of Feedyards
Mid-year Cattle Inventory: Thoughts on Heifer Retention and Feeder Cattle Outside of Feedyards
In late July, USDA-NASS released their mid-year estimates of U.S. cattle inventory. Consistent with the January report, the cowherd is shrinking, but the decreases have been small thus far. Beef cow numbers were estimated to be down just under 1% from July of 2019. As expected, this lined up with a smaller estimation for the 2020 calf crop, which is a crucial first step in seeing improvement in calf prices. Most culling of cows occurs in the fall and early winter, so changes from January to January are usually more insightful than changes in this mid-year report.
I always like to review the heifer development number, which was estimated to be flat from last year. Given that beef cow numbers were down slightly this year, comparable heifer retention would suggest continued contraction of the cowherd is likely. Figure 1 expresses this number as a percent of beef cow inventory each year, which is actually my preferred way to think about it. The blue line tracks this for each mid-year report back to 1973, while the black line is simply the average from all those years. There was no estimate in 2016, which is why the gap exists. Note that both 2019 and 2020 are about 1% below that long-run average.
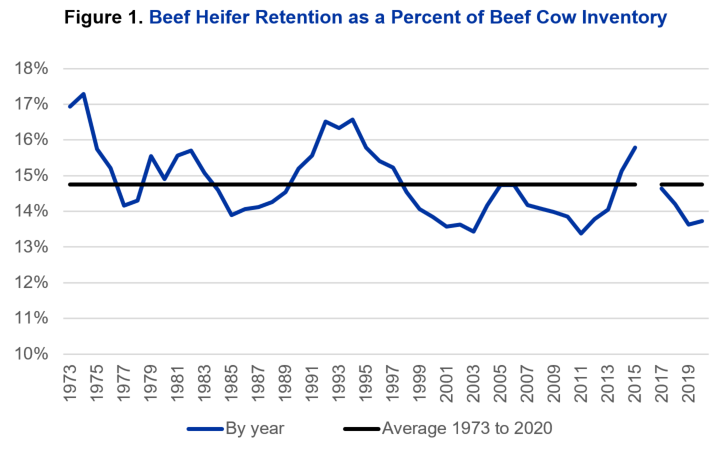
Source: USDA-NASS and Author Calculations
The other interesting piece of this report related to the backlog of cattle that was created due to processing plant shutdowns and slowdowns this spring. After aggressive fed cattle marketings in March, cattle-on-feed reports showed marketings way down for both April and May, but moving into line with last year in June and July. Of course, this is the same pattern as cattle slaughter during this time. As would be expected, feedlot placements were not off as much as marketings, and actually moved back to 2019 levels for the month of May. Total on-feed numbers went from running about 2% above year-ago levels at the first of the year, to running more than 5% below year-ago levels for April and May, and are now running slightly above 2019 levels. It is also encouraging to see that the number of cattle on feed over 90 and 120 days has dropped sharply since June.
I said all that to come back to the July cattle inventory report. With long fed cattle moving through the system as we speak and on-feed inventory stabilizing, the next question really turns to the number of cattle that are likely to be placed on feed in the coming months. If I take all the heifers and steers from the inventory estimates below and subtract beef heifer retention, dairy heifer retention, and on-feed inventory, I am left with an estimate of calves and feeders outside of feedlots. That calculation for 2020 is 300,000 head higher than 2019. While that is a big number, when put in percentage terms, it’s less than a 1% increase. I do think that almost all of that increase is in the heavy feeder cattle category since the 2020 calf crop was estimated to be smaller than 2019. But, this does paint a much less pessimistic picture going into the fall and is partially why heavy feeder cattle have found some significant support over the last few weeks. A full summary of the July 1, 2020 inventory report can be seen in Table 1.
Table 1. USDA July 1, 2020 Cattle Inventory Estimates
| 2019 (1,000 hd) | 2020 (1,000 hd) | 2020 as of % of 2019 | |
| Total Cattle and Calves | 102,900 | 103,000 | 100 |
| Cows and Heifers That Have Calved | 41,600 | 41,400 | 100 |
| Beef Cows | 32,300 | 32,050 | 99 |
| Milk Cows | 9,300 | 9,350 | 101 |
| Heifers 500 pounds and Over | 16,400 | 16,500 | 101 |
| For Beef Cow Replacement | 4,400 | 4,400 | 100 |
| For Milk Cow Replacement | 4,100 | 4,100 | 100 |
| Other Heifers | 7,900 | 8,000 | 101 |
| Steers 500 pounds and Over | 14,700 | 15,000 | 102 |
| Bulls 500 Pounds and Over | 2,100 | 2,100 | 100 |
| Calves Under 500 Pounds | 28,100 | 28,000 | 100 |
| Calf Crop | 36,060 | 35,800 | 100 |
| Cattle on Feed | 13,600 | 13,600 | 100 |
Source: USDA-NASS
Author(s) Contact Information:
