Ag Census Summary on Government Farm Program Payments for Kentucky Counties/Regions
Ag Census Summary on Government Farm Program Payments for Kentucky Counties/Regions
The Ag Census provides data to examine the relative importance of government farm program payments on a state and county level. Over the past two decades, these payments have included traditional farm bill safety net programs such as the Agriculture Risk (ARC) and Price Loss Coverage (PLC) programs and previous price/revenue support programs such as Direct and Counter-cyclical Payment Program (DCP) and Average Crop Revenue Election (ACRE) Program) along with conservation payments. These payments have also included ad hoc programs like the Market Facilitation Program (MFP), Coronavirus Food Assistance Program (CFAP), along with Tobacco Transition Payment Program (better known as the “Tobacco Buyout payments).[1]
Focusing over the past five ag census years (2002, 2007, 2012, 2017, and 2022), government farm payments for Kentucky averaged $116.5 million, or 8.3% of the state’s net cash farm income from all farming operations. Over the past five census years, Kentucky government farm program payments were consistently less than the national average. For the most recent ag census (2022), government payments accounted for only 3.6% of Kentucky net cash farm income. Higher commodity prices and record net farm income in 2022, plus the ending of tobacco buyout payments help explain the decline in the relative importance of government payments to the state’s net farm income.
Figure 1. Government Farm Payments for Kentucky - Ag Census
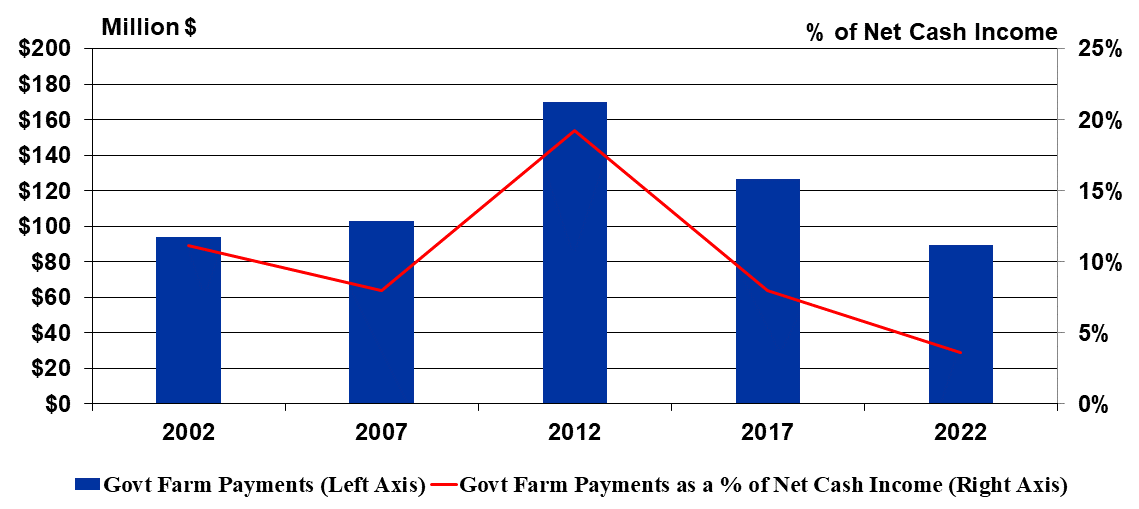
Source: NASS/USDA
On an individual county basis, as one would expect, our western Kentucky counties accounted for the largest percentage of government farm program payments in Kentucky. Christian County led the state receiving an average of $6.3 million annually over the past five census periods (accounting from 5.4% of Kentucky’s federal farm payments) followed by Graves County ($6.0 million), Logan County ($5.2 million), Warren County ($3.9 million) and Calloway County ($3.4 million).
Examining USDA agricultural districts over the past five ag census periods, the Midwestern region of Kentucky comprised the largest recipient of government payments (33.5%), followed by the Central (28.8%) and Purchase (19.5%) regions.[2] Notably, the Bluegrass, Eastern, and Northern regions experienced a relative smaller percentage of government payments in 2022, likely reflecting the loss of tobacco buyout payments. Higher grain prices encouraged more grain acres in these regions in recent years, but data indicate a significant number of grain acres in these counties not being eligible for farm bill payments. For example, the Bluegrass and Central Kentucky Agricultural Districts have 6.9% of the state’s base acres used in calculating farm bill payments, but have comprised over 7.2% of the state’s grain acres in recent years. Current farm bill proposals are considering allowing the entry of new base acres reflecting more recent production patterns, which could benefit these regions if this proposed provision becomes a part of the next farm bill.
Table 1. Farm Program Payments by Agricultural District
| Agricultural District | Percent of Kentucky Farm Program Payments (2002-2022 Census) | Percent of Kentucky Farm Program Payments (2022 Census Only) |
|---|---|---|
| Bluegrass | 11.6% | 7.4% |
| Central | 28.8% | 33.3% |
| Eastern | 3.90% | 3.4% |
| Midwestern | 33.5% | 35.1% |
| Northern | 2.7% | 1.3% |
| Purchase | 19.5% | 19.5% |
Source: USDA Ag Census
[1] While these payments were paid by from funds evolving from assessments on tobacco companies and not by using taxpayer funds, they were distributed by USDA and thus counted by USDA as direct government farm payments from 2005-2014.
[2] For a list of counties in each of the Kentucky Agricultural Statistic Districts, click here and go to page 3.
Recommended Citation Format:
Snell, W. “Ag Census Summary on Government Farm Program Payments for Kentucky Counties/Regions." Economic and Policy Update (24):7, Department of Agricultural Economics, University of Kentucky, July 30, 2024.
Author(s) Contact Information:
