ARC-PLC Decision Tool Instructions and Example
ARC-PLC Decision Tool Instructions and Example

There are a few possible decision tools that can be used for the ARC-PLC choice for 2025. My recommendation is to use the tool developed by Univ. Illinois as it has options that give you more flexibility in evaluating the results. You can download the Illinois version on the right-hand side of the screen (“Download Fast Tool”) at: https://farmdoc.illinois.edu/policy-toolbox
Go to the “What If” tab which will be all you need unless you want to evaluate ARC individual farm (not very common).
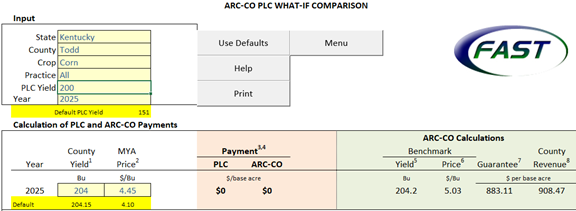
For the Upper “Input” Table Select:
Kentucky
Targeted County
Crop Type
PLC yield for the farm (this will have a minor effect on PLC payments so if it isn’t known I would just make a reasonable guess)
Year: Make sure it is set for 2025
Note: all numbers and parameters that are meant to be changed are in blue font.
For the lower portion of this Table you can change the Marketing Year Average Price (MYA Price) for 2025. This is the national expected price for the 2025 marketing year. The tool was last updated in January when future prices were lower and the expected prices for 2025 crops have risen since then. In other words, the defaults they provide for the MYA Price are currently low. My recommendations would be to use the following MYA Prices for 2025 (as of 2/17/25):
Corn $4.45 (default is $4.10)
Soybeans $10.25 (default is $10.20)
Wheat $6.15 (default is $5.60)
The other parameter that you can change in the lower portion of the table is the County Yield for 2025. I believe their default is the trend adjusted yield county yield expectation for 2025. Given the way the tables are structured, you can leave it at its default and see how changes in actual yield would affect payments as the output will show various final yields centered around the default.
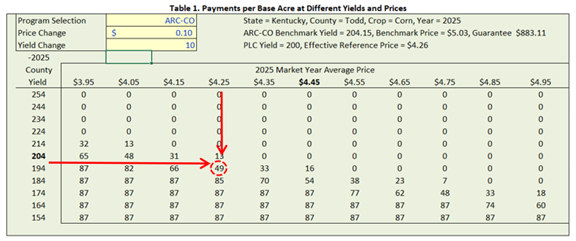
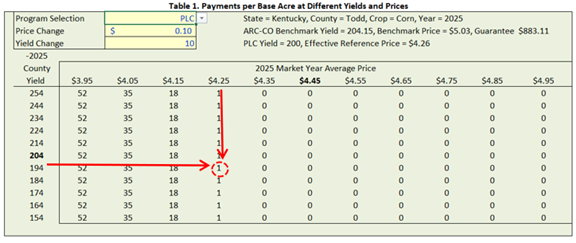
Then go to Table 1 below the input table to see a summary of results for PLC and ARC payments with various final prices and yields. Under Program Selection choose either PLC, ARC, or PLC – ARC. This last option shows the difference between the PLC and ARC payments and is what ultimately most users will want to see to make their decisions. You can also select the price change and yield change for the table (this modifies the table). I recommend $.10/bu for Price Change and 10 bu for Yield Change for corn, and $.25/bu for Price Change and 5 bu for Yield Change for soybeans.
Example Results:
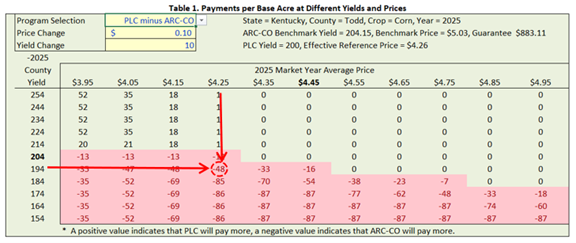
The example used here is for Todd County and for corn base. If the final MYA price turned out to be $4.25/bu and the final county yield was 194 bushels, the resulting ARC payment would be $49/acre, and the resulting PLC payment would be $1/acre. The resulting PLC – ARC difference would be -$48 which means ARC pays out $48/acre better then PLC. Thus, this third option is very useful for evaluating which of the two programs would be the better choice. As can be seen in the table for this third option, the majority of payouts are better for the ARC program. Only where prices are low and yields are high does PLC do better in this county in 2025.
The calculated PLC payouts will be the same in all counties, but the calculated ARC payouts will change based on the county yield for the previous five years. So there may be some counties where PLC looks better relative to ARC compared to what is shown in this example.
Recommended Citation Format:
Halich, G. "Grain Profitability Outlook 2025." Economic and Policy Update (25):2, Department of Agricultural Economics, University of Kentucky, February 27, 2025.
Author(s) Contact Information:
