Crop Insurance as a Tool for Managing Farm Risk
Crop Insurance as a Tool for Managing Farm Risk
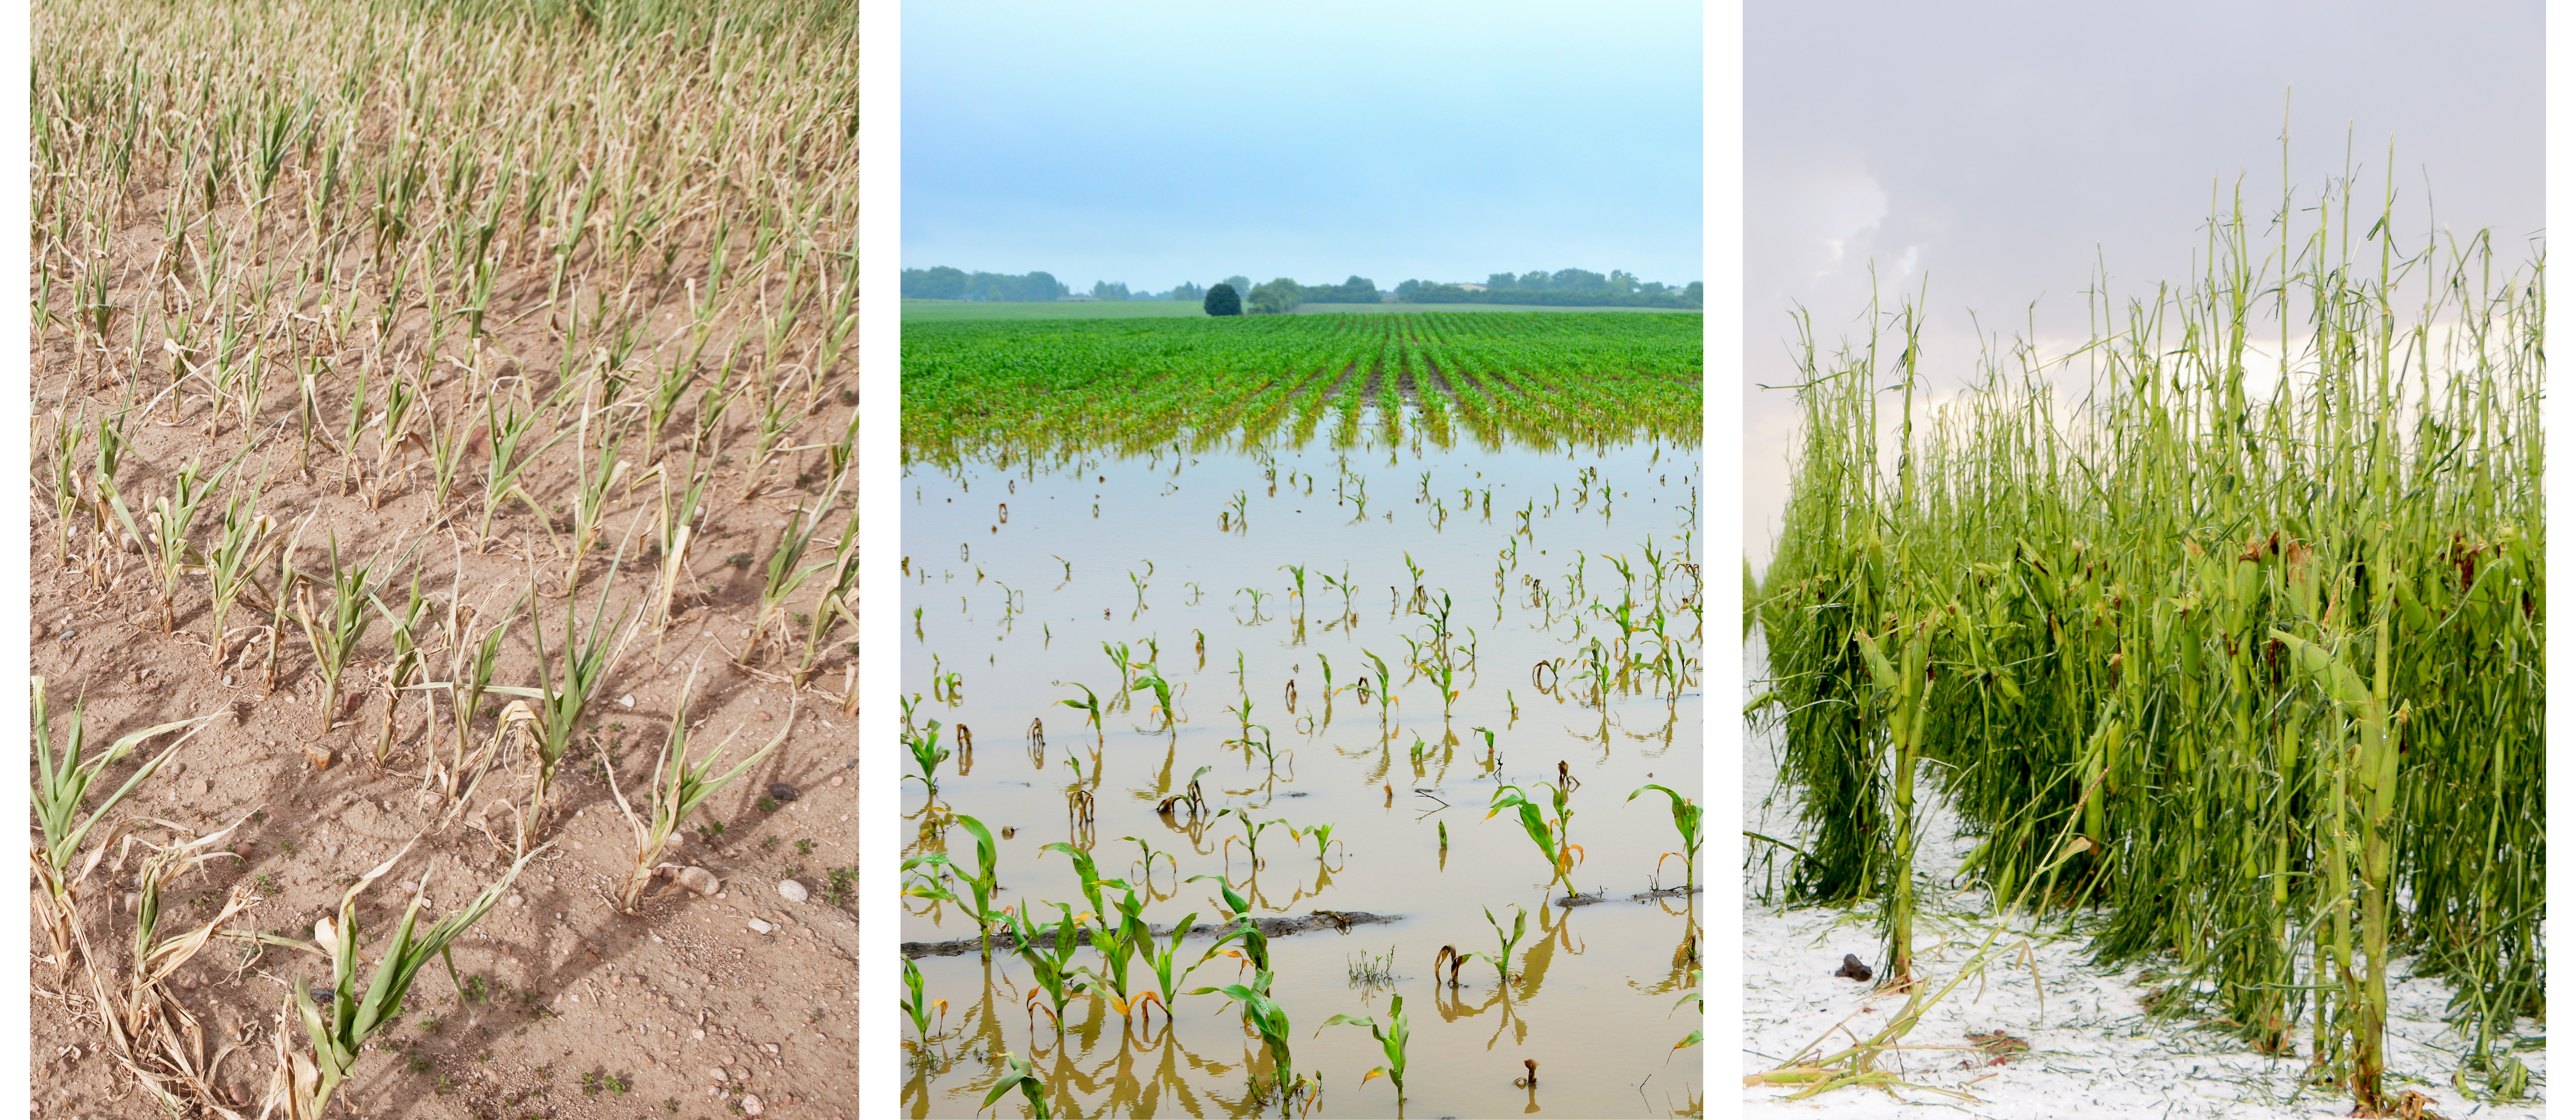
Crop insurance was authorized by Congress in the 1930s on an experimental basis to insure against crop loss from “unavoidable perils beyond the farmer's control.” It was made permanent with the passage of the Federal Crop Insurance Act of 1980. More recently, products combining price and yield coverage have been introduced to make it a major risk management tool. This article illustrates the importance of crop insurance as a risk management tool using data from crop farms participating in the Kentucky Farm Business Management (KFBM) program for 2010-2019.
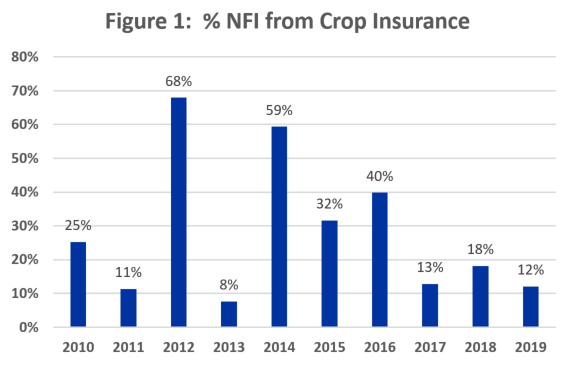
Figure 1 illustrates the importance of crop insurance as a tool for managing financial risk to the farm. Crop insurance proceeds made up 40% or more of Net Farm Income (NFI) for the average crop farm in three out of the last ten years: 2012, 2014, and 2016. Total contribution to the average farm totaled $519,373 for those years combined. For comparison, the average annual NFI for these farms was $314,894 for the period. Average total proceeds from crop insurance for the 10 years is $857,853. The aggregate impact of crop insurance on NFI for KFBM farms has been reduced in recent years by relatively large government payments and decent crop yields.
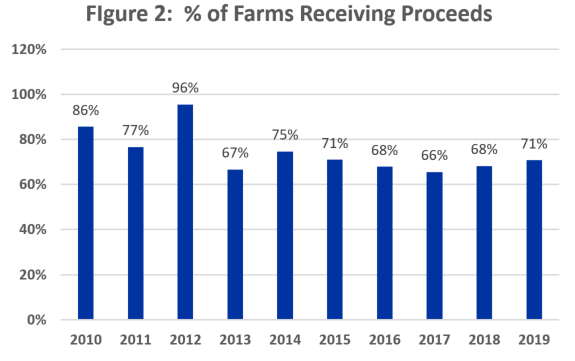
The number of farms receiving proceeds from crop insurance is a good indication of crop damage and market price risk on insured crops for the year. Figure 2 shows the percentage of farms receiving payments each year. About 97% of KFBM crop farms participated in crop insurance programs during the 10-year period. Ninety-six percent of them collected from crop insurance in 2012. In an average year, 74% of the farms received some payment.
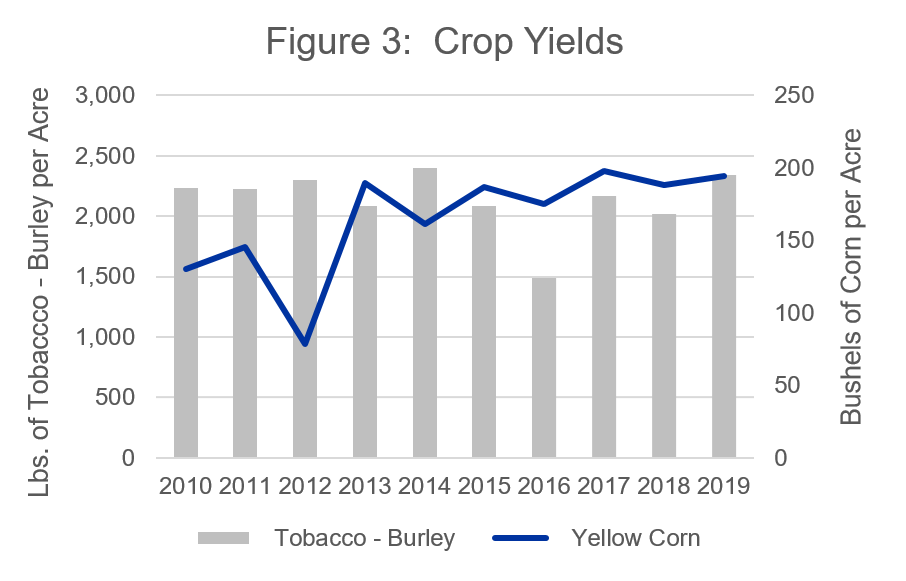
Most crop insurance policies contain provisions for yield loss and revenue protection. Figure 3 illustrates yield loss for grains and tobacco, represented by corn and burley. Crop damage and yield loss combined to create a spike in crop insurance proceeds in 2012. Corn yields fell to an average of 78 bushels/acre at a time when price received reached a high of $6.50/bushel. Grain yield loss was also a factor in 2010 and 2014, as was tobacco yield loss in 2016. In general, higher commodity prices contributed to higher proceeds from revenue protection prior to 2014. Lower commodity prices, less fluctuation in prices, and generally stable yields have reduced the dollar amounts of payments for losses from yield and price, but claims have remained steady. Part of the reason is the effect of local weather on individual farm yields, especially wheat (2018) and double-crop soybeans (2019).
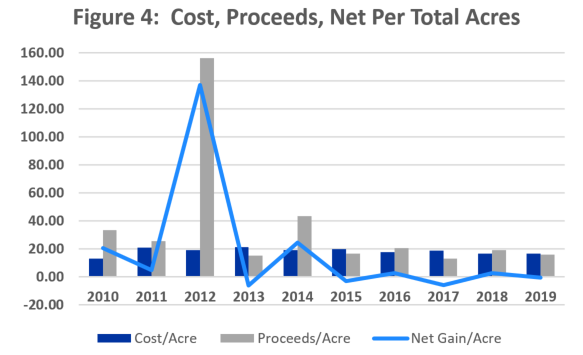
Figure 4 compares cost and proceeds for crop insurance as well as the net gain. Note that cost, proceeds, and net gain are expressed in terms of tillable acres – not insured acres. All values are reported on the accrual basis for each year of production, not for the year reported for taxes.
Cost of insurance increased during 2010-2013, peaking at $21.25/tillable acre in 2013. Cost then declined following the drop in commodity prices, settling in the $16.55 range for 2018-2019. Average cost for the last seven years has been $18.53 tillable acre. Crop insurance proceeds received during 2010-2019 averaged $35.80 per tillable acre. Payments to farmers have averaged $20.40 per tillable acre for the last seven years.
Net gain, the difference between insurance cost and proceeds, was $17.55 acre per year for the average KFBM farm over the 10-year period. The average farm received $40,970 more than the cost of crop insurance during that time. Crop farms netted an average $6,822 over the last seven years – about $1.87/tillable acre.
Note that, while 2016 was an “average” year with proceeds of $20.31/tillable acre and net gain of $6,416, total revenue was so low that crop insurance proceeds made up 40% of NFI. That is the role crop insurance plays in farm risk management to provide financial stability in face of those “unavoidable perils beyond the farmer's control.”
Author(s) Contact Information:
