Drivers of Commodity Prices: Exports
Drivers of Commodity Prices: Exports

Since the onset of COVID, agricultural commodity charts have resembled the track of a roller coaster, with huge peaks and valleys. Global geopolitical events and conflict intensify these peaks and valleys. During the 2023/24 marketing year, commodity prices have transitioned downward. As prices start to level out, we can likely expect more consistent commodity prices on a year-to-year basis. In a less volatile price environment, marketing decisions are made easier by focusing on fundamental drivers of prices. Examples include exports, the acreage battle, and domestic use. This article is the first in a series I will publish in the Department of Agricultural Economics' Economic and Policy Update on fundamental drivers of commodity prices. In this article, I focus on exports and why exports are a crucial driver of U.S. commodity prices.
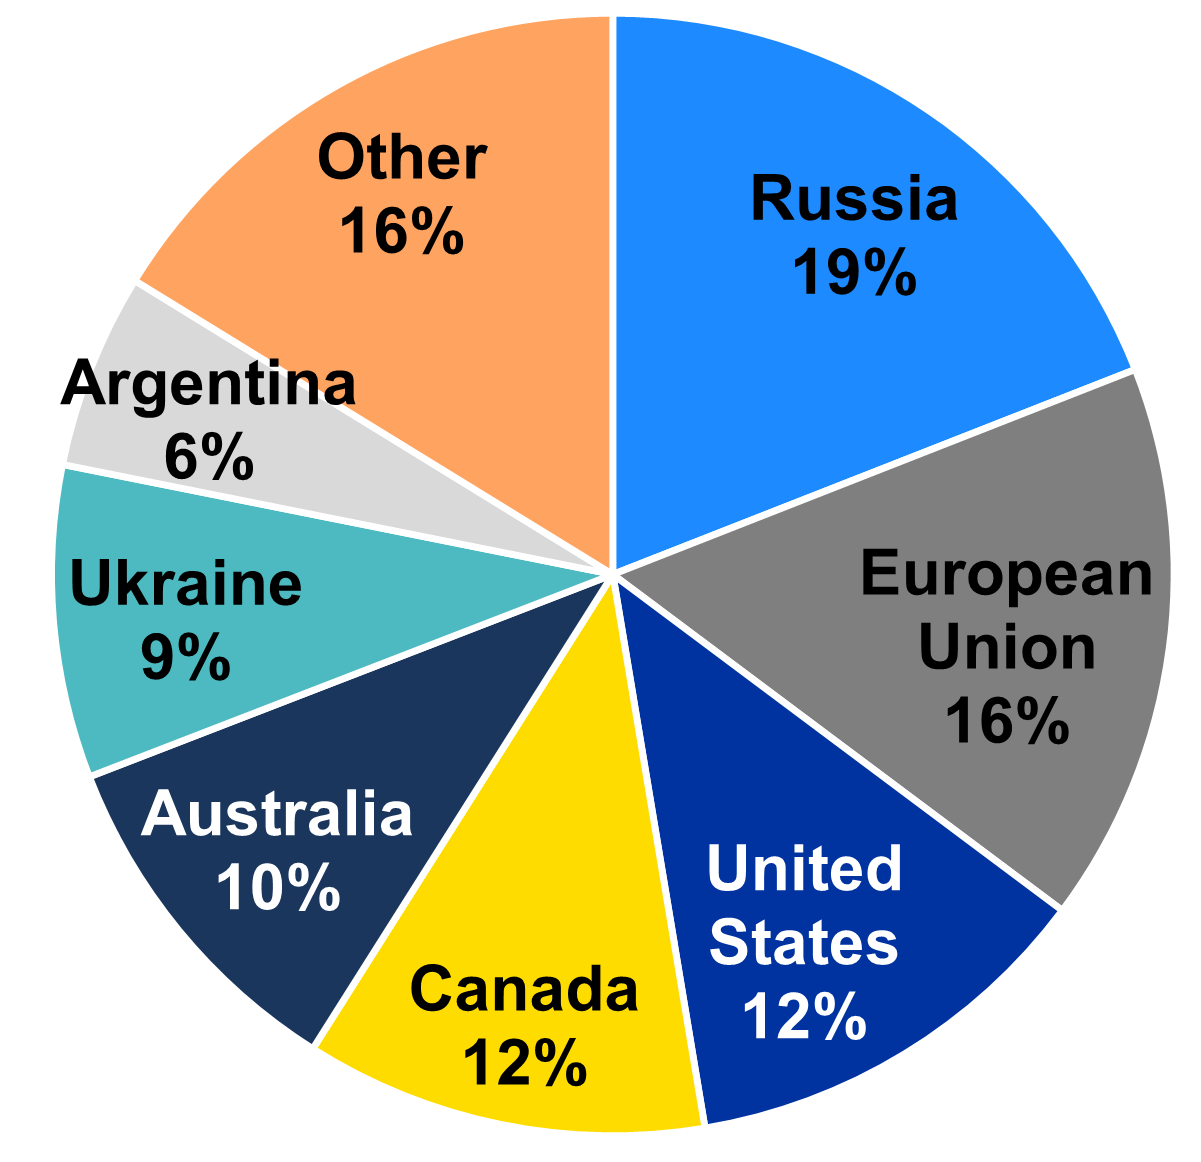
Exports drive U.S. prices because US production outpaces domestic use, creating a reliance on export markets. Figures 1, 2, and 3 show the aggregate percentage of corn, soybean, and wheat exports by country and U.S. marketing year from 2018/19 to 2022/23. Export numbers are obtained from the USDA FAS Production, Supply, and Distribution Database. Figures 1-3 indicate that each crop has a small number of large players; however, wheat export markets are more competitive than corn or soybean markets. Figure 1 suggests that the four major players in corn exports are the U.S., Brazil, Argentina, and Ukraine, which make up 85% of world exports. Figure 2 indicates Brazil has been the leading soybean supplier for the past five years; however, Figure 2 is a little misleading as Argentina makes up 4% of soybean exports but is the largest supplier of soybean meal, at 39%. In combination, the U.S., Brazil, and Argentina supply 90% of soybean exports and 84% of soybean meal exports. Wheat is a global crop with more competitive export markets. Figure 3 indicates that the U.S., Russia, the European Union, Canada, Australia, Ukraine, and Argentina combine to make up 84% of wheat export markets.
Although the U.S. has been the leading corn exporter for the past five years, Brazil surpassed the U.S. in corn exports during the 2022/23 marketing year and is expected to have similar corn exports as the U.S. in 2023/24 (USDA WASDE, 2024). Continual agricultural expansions are expected in Brazil, making Brazil the largest U.S. competitor in corn export markets. A similar story can be told for soybean exports. During the 2022/23 marketing year, Brazilian soybean exports nearly doubled U.S. exports. Brazil was also the largest soybean meal exporter in 2022/23. 2023/24 projections indicate Brazil will more than double the US in exports and surpass Argentina in meal exports (USDA WASDE, 2024). Wheat exports will continue in a similar position to the last five years. It is worth noting that even with the conflict in Ukraine, Russian and Ukrainian wheat exports have remained relatively consistent. The same can be said of Ukrainian corn exports.
The export information covered above can aid in marketing directly and indirectly. Directly, any U.S. export bookings positively impact U.S. commodity prices. However, we must remember that commodity prices already account for a certain amount of U.S. exports. Thus, exports surpassing the projected amount will have a bullish effect on commodity prices, which could be a good indicator for booking commodity sales. Indirectly, weather events in other countries can also indicate a good time to book commodity sales, especially in corn and soybeans. Specifically, weather events in Brazil and Argentina that slow planting or impact yield. Specific months to watch South American weather include September-May. As wheat is a global crop, it is less reactive to weather changes, but recent events have shown that geopolitical news and weather can indirectly affect U.S. prices. Specific months are harder to pinpoint.
In conclusion, exports are an important driver of U.S. commodity prices. As a few countries make up large portions of world corn, soybean, and wheat exports, we can inform marketing decisions by paying attention to direct and indirect indicators of export change. As we move into a more predictable period of commodity prices, it will be important to pay attention to the direct effects of changing exports and indirect effects, such as changing weather conditions in major exporting countries, to inform commodity marketing decisions.
Figure 1: World Corn Exports by County, 2018/19-2022/23 Marketing Year (%)
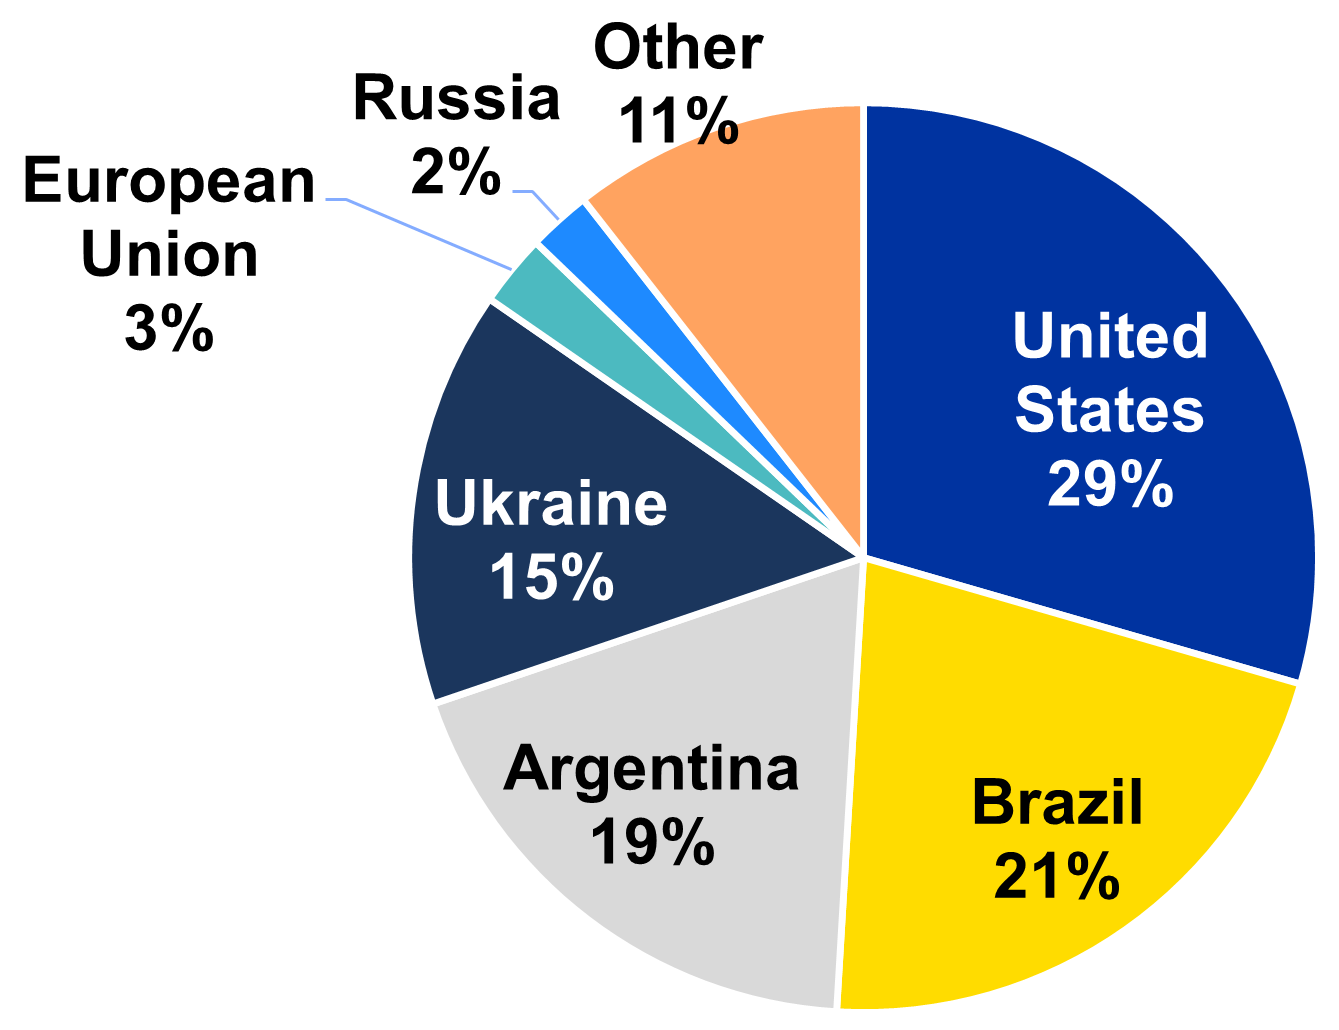
Figure 2: World Soybean Exports by Country, 2018/19-2022/23 Marketing Year (%)
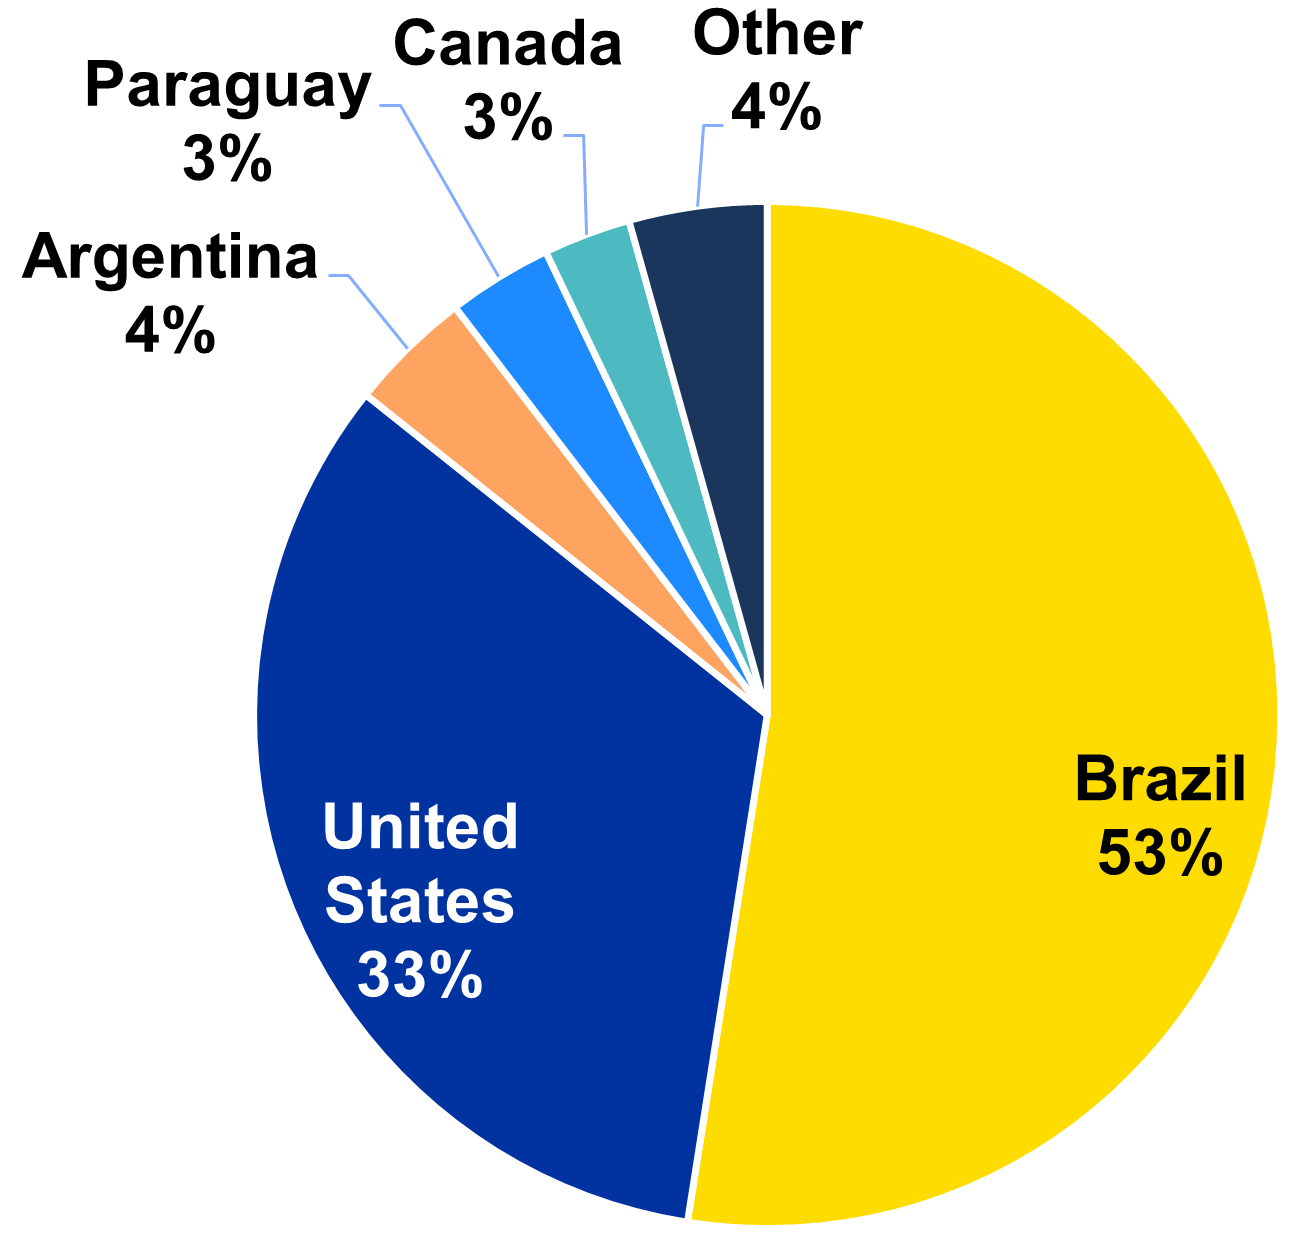
Figure 3: World Wheat Exports by Country, 2018/19-2022/23 Marketing Year (%)
Recommended Citation Format:
Gardner, G. "Drivers of Commodity Prices: Exports." Economic and Policy Update (24):4, Department of Agricultural Economics, University of Kentucky, April 29th, 2024.
Author(s) Contact Information:
