Historical Farm Income and Expenses
Historical Farm Income and Expenses
Agriculture seems to be on a roller coaster recently with the volatile commodity markets, energy costs, and the tough summer weather. Looking back over the last ten years, grain farmers have seen a wide range of commodity prices and yields. There has been much more variance on the income side than the costs per acre. It is interesting to look at trends over the past ten years using data from the Kentucky Farm Business Management (KFBM) program.
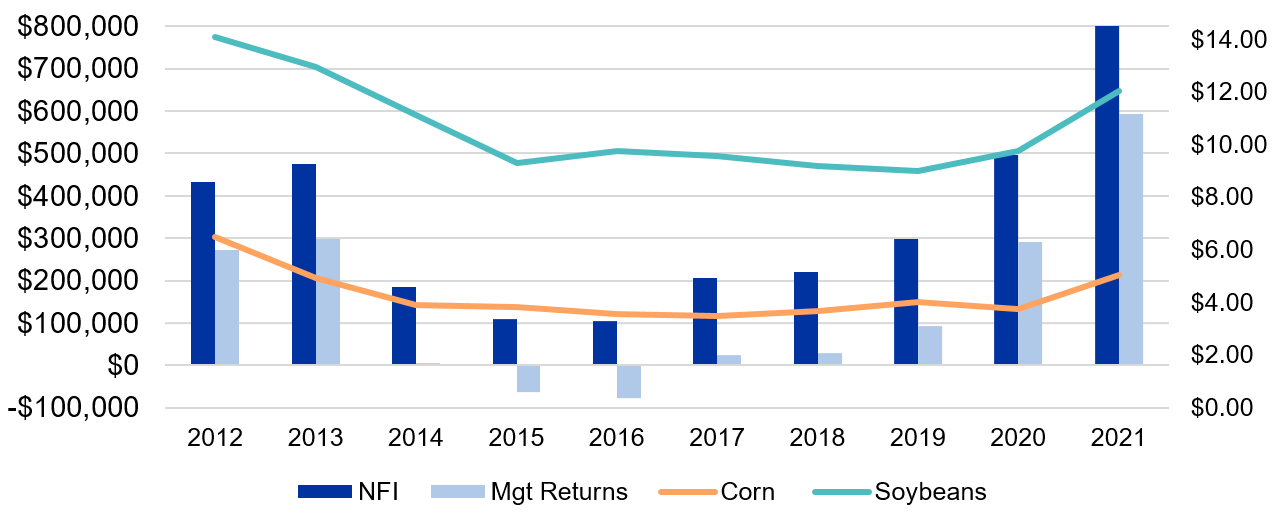
Kentucky grain farms had record incomes for the 2021 crop. Outstanding yields coupled with higher prices resulted in high net farm incomes and management returns. Looking at Figure 1, you can see that net farm incomes (NFI) and management returns usually correlate with grain prices received. Higher prices usually lead to higher incomes and a decrease in prices results in lower incomes, on average.
Figure 1: Incomes and Grain Prices
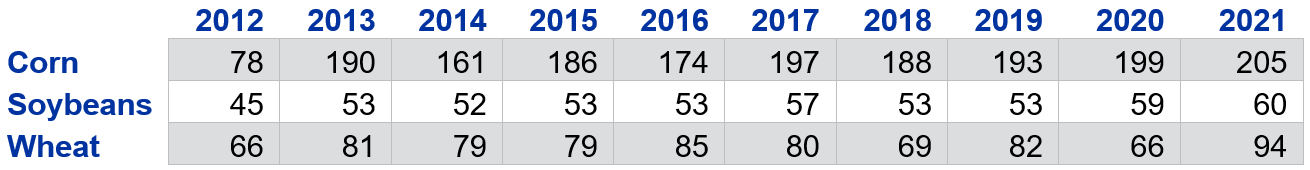
The other major factor in income is yields. Table 1 shows the yields for corn, beans, and wheat over the last ten years. As you can see, 2021 average yields were outstanding for all three crops. With 2012 being a drought year, the corn and wheat yields have seen more variance than beans. The last five years have seen solid yields across all crops. This makes one wonder what the next ten years of yields will look like.
Table 1: Historical Yields
KFBM also tracks family living expenditures and capital purchases (machinery and building) for the farms in the program. Family living expenses are always an area of interest to lenders. It is difficult for anyone to change their lifestyle and this has held true with KFBM farms. Regardless of high income or low income, family living expenses held fairly steady over the last ten years, with exception of 2021. In 2021, the average farm spent $92,000 on family living expenses. This was an increase of nearly 28% over 2020. The average family living expense over the past ten years was $74,897. Figure 2 shows the family living compared to NFI and management returns. For five years, family living expenses were greater than management returns.
Figure 2: Income and Spending
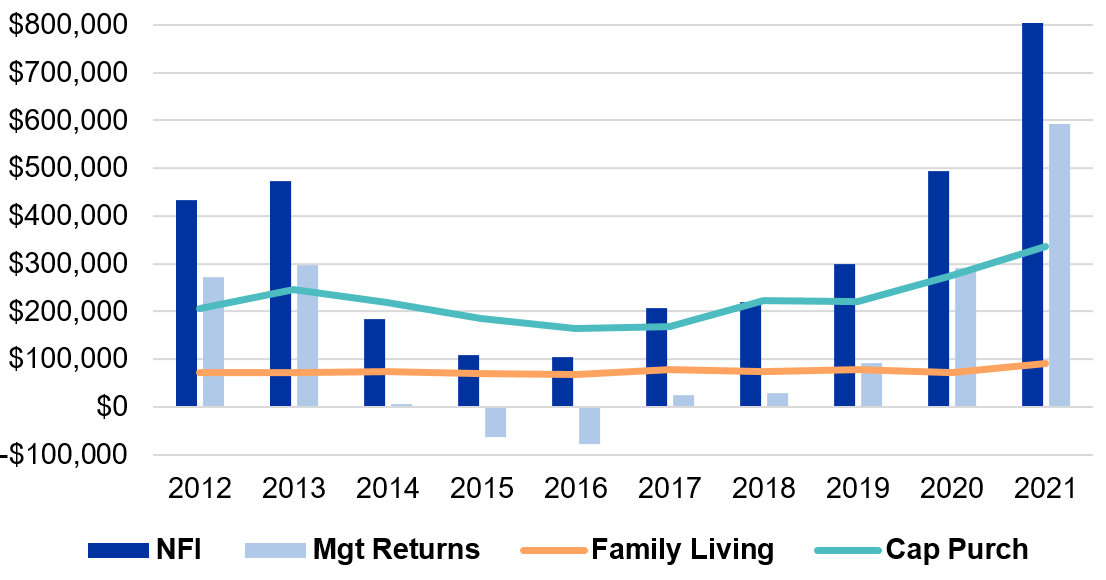
Another trend interesting to examine is capital purchases (equipment, grain bins, tile, barns, farm shops). All capital items have seen a recent increase in prices and availability, to an extent. Higher incomes usually result in greater cash on hand, thus more capital purchases (Figure 2). Grain bins have truly been able to help producers reap higher prices over the last two years.
Income is only one side of the equation. The other side is input costs, which have to be managed to generate higher NFI. Over the last ten years, KFBM producers have had to manage their costs to keep them as low as possible. The period from 2014 to 2019 was tight for producers, thus they became great managers of their costs. Table 2 shows several costs per acre that are most concerning for producers.
Table 2: Input Costs
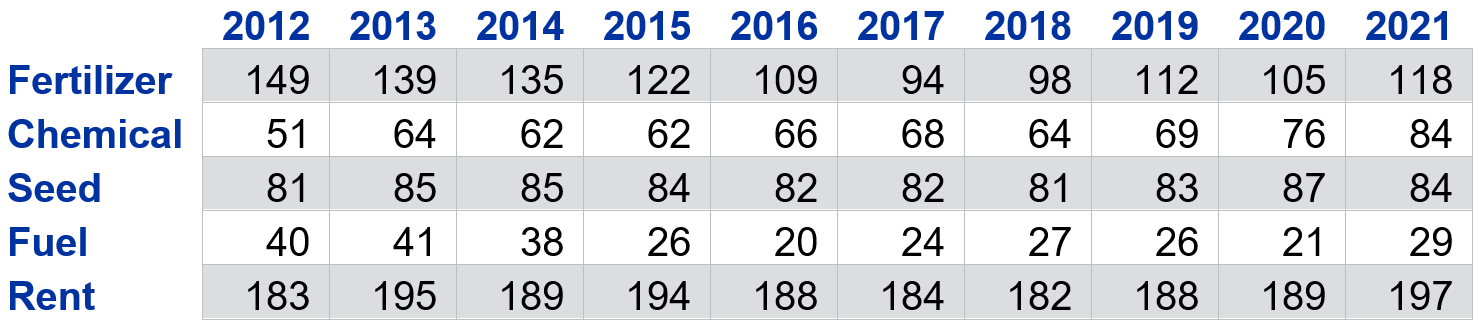
Table 2 represents a large portion of the total expenses for a grain farm. Fertilizer and rent are most likely the two largest costs for all grain farms. Undoubtedly, input costs will be higher in 2022. You can see that there has been quite a bit of variance over time in these costs and there hasn’t been a true upward or downward trend in any category. Using averages, over a five or ten-year period, can help producers better plan and keep input costs at a manageable, and hopefully profitable, level.
Due to the high-income carryover from 2021, 2022 has been easier to manage. The high input costs were concerning, but cash was not as tight. The market volatility has most likely created large swings in the average prices that will be received per farm. There could easily be a $2/bushel swing in prices received from farm to farm. Yields won’t be at 2021 levels across most of the state, yet there is still a strong possibility for another year of high NFI.
Recommended Citation Format:
Turley, L. O. "Historical Farm Income and Expenses." Economic and Policy Update (22):7, Department of Agricultural Economics, University of Kentucky, July 29th, 2022.
Author(s) Contact Information:
