The Ag Census Confirms Geographic and Commodity Shifts in the Kentucky Farm Economy
The Ag Census Confirms Geographic and Commodity Shifts in the Kentucky Farm Economy

The twenty-year time frame between the latest USDA Ag Census (2022) released earlier this year and the 2002 Ag Census occurred during a period of dramatic changes in Kentucky agriculture. During this two-decade period, the tobacco buyout was passed (in 2004) and implemented (2005-2014), the Kentucky Agricultural Development Board made significant investments to support ag diversification across the Commonwealth, and the state’s agricultural economy benefited greatly from growth in grain receipts (increased by more than 400%) and poultry receipts (increased by more than 200%). On the other end of the spectrum, tobacco receipts fell by 44% from 2002 to 2022, while dairy sales increased less than 10%. Overall, the Census data reveal that the market value of agricultural products sold in Kentucky increased from $3.1 billion in 2002 to $8.0 billion in 2022. However, the increase was not spread uniformly across the state. The two most western Kentucky Agricultural Statistical Districts (Purchase and Midwestern) experienced increases surpassing 200%, while the Eastern and Northern Kentucky districts realized minimal gains (53% and 27% respectively).
Table 1: Market Value and Market Share by Kentucky Agriculture Statistical District (2002 vs 2022)
| Kentucky Agricultural Statistics District | 2022 Market Value of Agricultural Product Sales | 2022 Market Share of KY Agricultural Product Sales | 2002 Market Value of Agricultural Product Sales | 2002 Market Share of KY Agricultural Product Sales | Growth in Agricultural Product Sales (2022 vs. 2002) |
|---|---|---|---|---|---|
| Bluegrass | $1,706,675,000 | 21.3% | $940,762,000 | 30.5% | 81.4% |
| Central | $1,728,024,000 | 21.6% | $647,960,000 | 21.0% | 166.7% |
| Eastern | $282,957,000 | 3.5% | $184,877,000 | 6.0% | 53.4% |
| Midwestern | $2,732,209,000 | 34.1% | $718,189,000 | 23.3% | 280.4% |
| Northern | $182,479,000 | 2.3% | $143,689,000 | 4.7% | 208.9% |
| Purchase | $1,373,408,000 | 17.2% | $444,605,000 | 14.4% | 208.9% |
| Kentucky | $8,005,752,000 | $3,080,082,000 | 159.9% |
Source: USDA Ag Census, For a list of counties in each of the Kentucky Agricultural Statistics Districts, click here and go to page 3.
Collectively, the Midwestern and Purchase regions accounted for 51.3% of Kentucky ag sales in 2022 compared to 37.7% of sales in 2002. The largest dollar gains by county recorded over the twenty-year period occurred in Graves County (+$323.5 million), Daviess County (+$273.2 million), McLean County (+$217.2 million), Christian County (+$186.7 million), and Webster County (+$181.6 million). Fifteen Kentucky counties, primarily in eastern and northern Kentucky experienced losses in ag sales from 2002 to 2022.
During this twenty-year period Kentucky grain (corn, soybeans, and wheat) acres harvested increased by 40%, while the state’s tobacco acres fell 60%. The Kentucky cattle inventory declined 22% from 2002-2022, dairy cow numbers were 62% lower, while the number of broilers sold were fairly steady, dropping only 3%.
Figure 1: Dollar Change in the Market Value of Agricultural Product Sales (2022 vs. 2002)
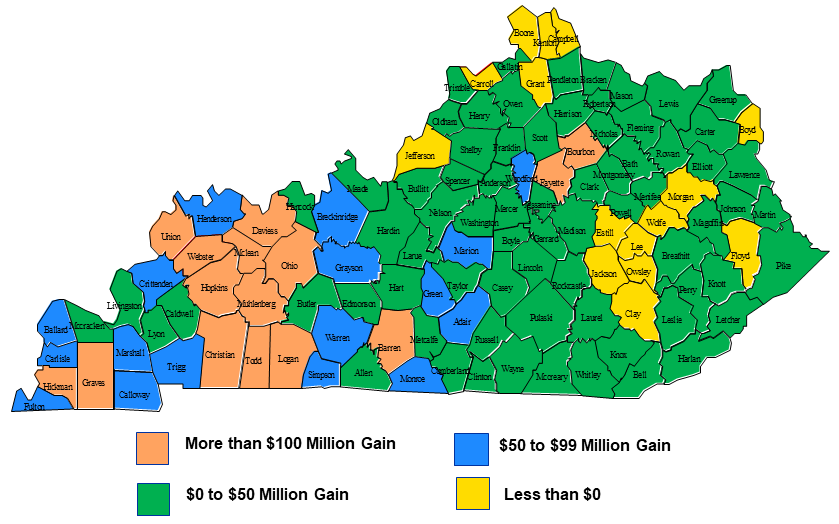
Source: USDA Ag Census
Figure 2: Percentage Change in the Market Value of Agricultural Product Sales (2022 vs. 2002)
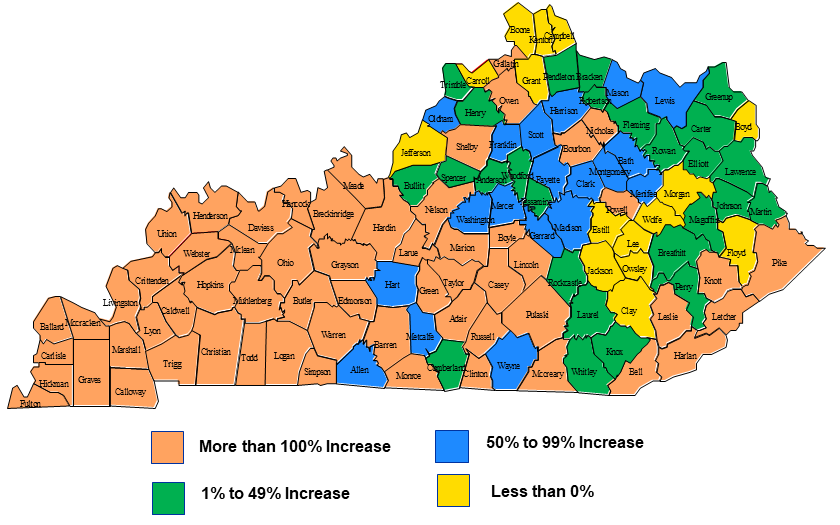
Source: USDA Ag Census
Figure 3: Market Value of Kentucky Agricultural Sales (2022 vs. 2002)
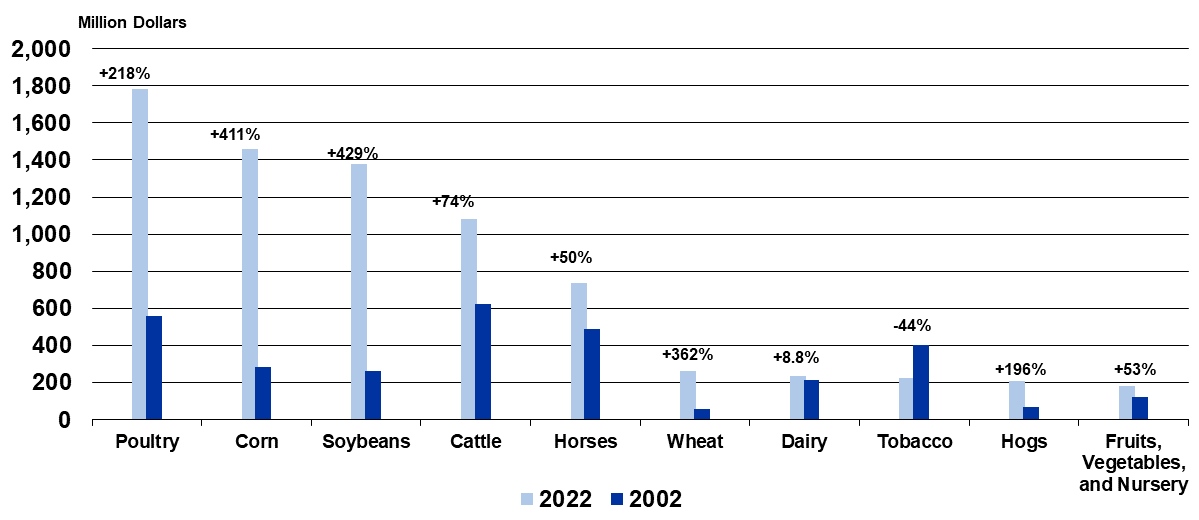
Source: USDA Ag Census
Recommended Citation Format:
Snell, W. “The Ag Census Confirms Geographic and Commodity Shifts in the Kentucky Farm Economy." Economic and Policy Update (24):3, Department of Agricultural Economics, University of Kentucky, March 28th 2024.
Author(s) Contact Information:
