Family Living Expenses on Kentucky Farms
Family Living Expenses on Kentucky Farms

There is likely no single item in a farm business cash flow with more uncertainty and more variability than “family living expense.” Farm income and expense items are measured pretty accurately because they will be needed for tax reporting and for borrowing eligibility…two pretty good reasons. The difference in income and expenses is net farm income. Net farm income is what’s leftover to 1) pay debt, 2) grow the business, 3) pay taxes, and 4) live on. The last two are “family living.”
We tend to live on what’s leftover after paying debt and taxes. That “leftover” spending may or may not be tracked with much accuracy. Thus, when someone asks, “What’s family living expense for a farm family?” we tend to answer with, “It’s hard to say, but here’s an average.”
2020 Results
The Kentucky Farm Business Management program does have accurate family living data for some of the farms in their records and management program. The average family living expense for 168 farms in 2020 was $88,743. That breaks down to $71,964 for living expenses and $16,779 for income and social security taxes on the net farm income. Data from 2020 and the two previous years are presented in Table 1. The net income from farm and non-farm sources to cover those expenses are also indicated in Table 1 with the residual difference being what is then left for debt payment and growth.
Table 1: KFBM Farms' Residual Income (2018-2020)
| 2018 | 2019 | 2020 | |
|---|---|---|---|
| Total Family Living Expense | $73,039 | $78,569 | $71,964 |
| Income Taxes and Social Security | $13,028 | $13,645 | $16,779 |
| Total | $86,067 | $92,214 | $88,743 |
| Net Farm income | $77,980 | $82,461 | $227,438 |
| Net Non-farm Income | $26,941 | $31,020 | $41,260 |
| Total Net Income | $104,921 | $113,481 | $268,698 |
| RESIDUAL | $18,854 | $21,267 | $179,995 |
Family living expense is a catch-all term that includes a number of items. The $71,964 average in 2020 is the sum of several categories that break out as follows. CONTRIBUTIONS: $5,552, MEDICAL: $7,875, LIFE INSURANCE: $4,500, EXPENDABLES: $50,591, and CAPITAL ITEMS: $3,445.
While the $71,964 of living expenses in 2020 is an average of 168 farms, there is considerable variation in family living expenses. When ranked by family living expense into three categories, the 55 farms in the high one-third category spent an average of $131,970 while the low one-third category spent only $11,032. As odd as it seems the monthly expenditures of the high one-third is about equal to the annual expenses of the low one-third. Indeed, for family living expenses, “It’s hard to say.”
The Long View
Family living expenses and farm income and expense data have been collected in the KFBM program for decades. The following graphics are a visual representation of the totals in Table 1, but extended over a twenty-year period.
The relatively stable but generally increasing line in Figure 1 would indicate that the average family living expense (including income taxes and social security) has been in the $60 to $100 thousand range. There is no such stability in net income (farm and non-farm combined). Adding the net income data in Figure 2 suggests what we already know…farm income has been highly variable over the past twenty years. In the peak years net farm income exceeded $200 thousand and the low years were in the $20 thousand range. Net non-farm income tended to be in the $30-40 thousand range.
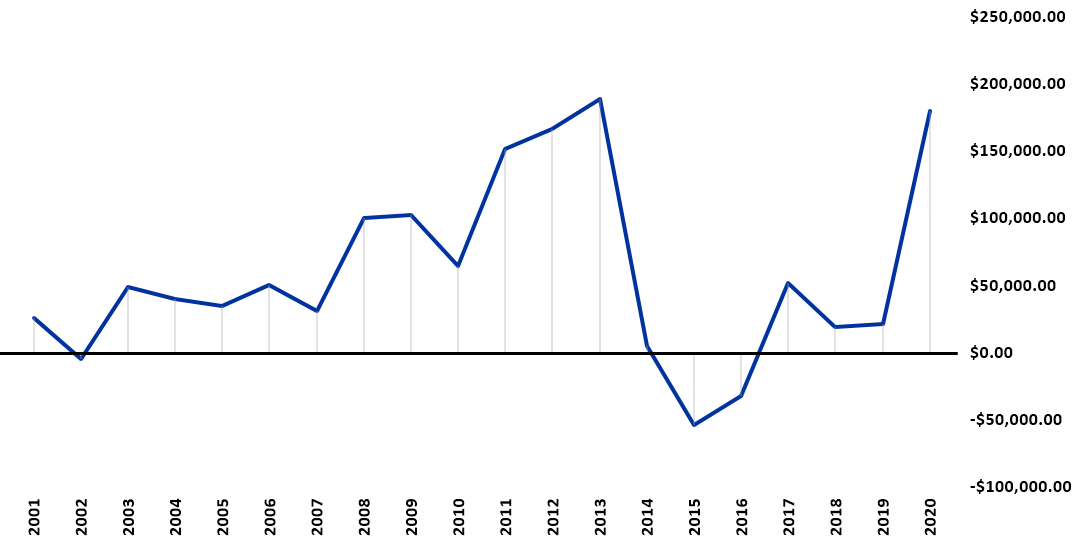
The difference in these two lines in Figure 2 is the income remaining to retire debt (i.e. principal payments) and/or to grow the business with asset purchases. This “residual” is graphed in Figure 3. In eleven of the twenty years that residual was less than $50 thousand, and was negative in some years when net farm and non-farm income was not sufficient to cover family living. Those years can be particularly troublesome when money must be found from other sources, or borrowing has to increase, with nothing left to pay principle on debt.
Farm income is highly variable. Family living expenses aren’t. While the data presented here from the Kentucky Farm Business Management program are averages, individual farms can vary considerably. An awareness of, and planning for, this variability is critical to the future of the farm…and the family.
Figure 1: KFBM Family Living Expenses
Including Income Taxes and Social Security
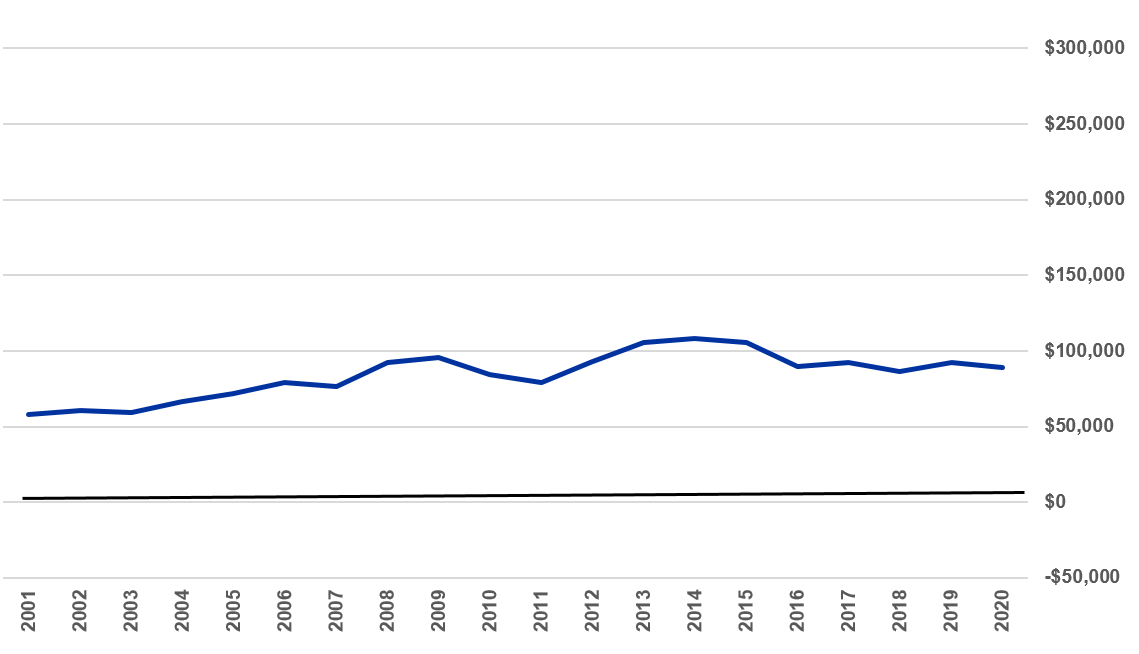
Figure 2: KFBM Family Living and Net Income (farm and non-farm)
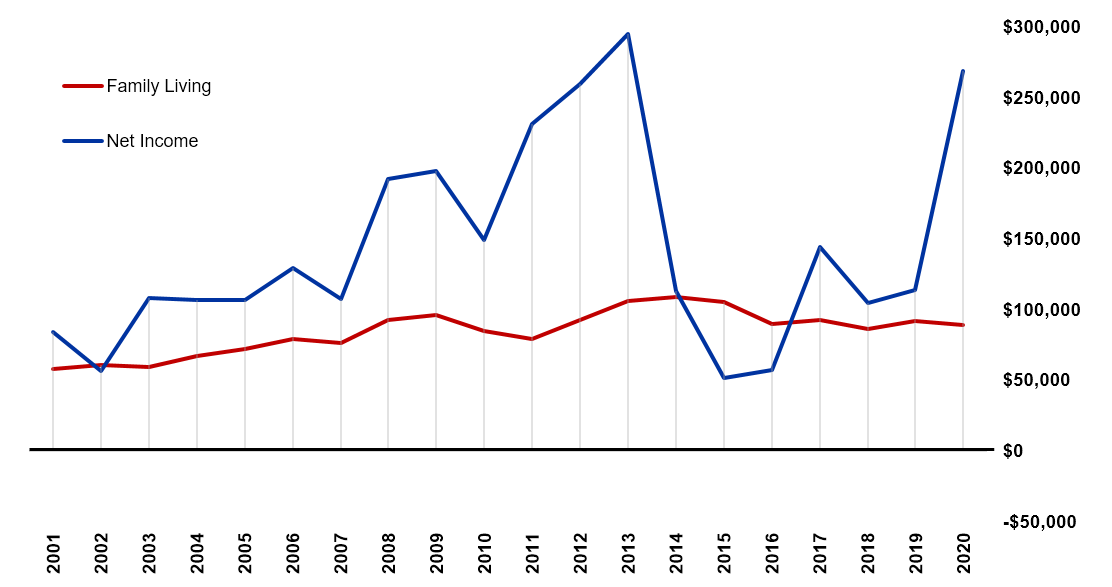
Figure 3: KFBM Residual Income
(Net Income-Family Living and Taxes)
Recommended Citation Format:
Isaacs, S. "Family Living Expenses on Kentucky Farms." Economic and Policy Update (21):10, Department of Agricultural Economics, University of Kentucky, October 28th, 2021.
Author(s) Contact Information:
Steve Isaacs | Extension Professor | sisaacs@uky.edu
Management & Finance
