Drivers of Commodity Prices: Seasonality
Drivers of Commodity Prices: Seasonality
Since the onset of COVID, agricultural commodity charts have resembled the track of a roller coaster, with huge peaks and valleys. During the 2023/24 marketing year, commodity prices have transitioned downward. We can likely expect less volatile commodity prices as prices level out. In a less volatile price environment, marketing decisions are made easier by focusing on fundamental drivers of prices. In my first article on drivers of commodity prices, I focus on exports. This article, the second in a Department of Agricultural Economics' Economic and Policy Update series, focuses on seasonality and how it can inform marketing decisions.
At its base, seasonality indicates that commodity prices are typically lower at harvest. Lower harvest time prices are typically caused by the large influx of supplies at harvest. In this article, I use average monthly price indexes to determine soybean seasonality for the 2010s, indicating that May, June, and July are often the best times to pre-market soybeans. I additionally compare May and October sales using November Soybean futures and suggest that a sale in May has returned $1.15/bu more on average than an October (harvest time) sale.
As we move away from supply and demand shakeups such as COVID-19 and the Russia-Ukraine invasion, I expect seasonal prices to reflect those of the 2010s. Inspecting the seasonal average from 2010-2019 indicates that cash prices increased at harvest only 20% of the time. Figure 1 shows the average monthly price index of Kentucky soybean cash prices for 2010-2019 compared to 2010/11 and 2019/20, the only two years prices increased at harvest. As expected, the average index indicates prices increase through July before decreasing at new crop harvest. On average, the best time to sell soybeans is July; however, this is not always the case. For example, in five of ten years, the monthly index peaked in May or June, making those the better months to market soybeans than July in some years.
In comparing seasonality in pre-harvest marketing, I compare November soybean futures on May 15 and October 15. Results can be seen in Table 1. I chose May 15 because prices become more volatile in June and July due to weather challenges. Even though prices are higher on average these months, looking at the price for one day could be a poor indicator of price. Through the 2010s, futures prices were higher on May 15 60% of the time; however, through 2023, which includes COVID and the Russia-Ukraine invasion, prices were only higher in May 50% of the time. The more important part of this analysis indicates that price increases in May far outweigh declines in May. The average decline from May 15 to October 15, found by averaging the negative (red) numbers in column four of Table 1, results in an average loss of $1.15 per bushel. The average increase, found by averaging the positive (black) numbers in column 4 of Table 1, is $2.35, indicating an average gain of $2.35 when prices increase. Thus, even though prices were higher on May 15 only 50% of the time, always marketing on May 15 would result in an average $0.50/bushel gain.
Seasonality is a huge aspect of grain marketing and should inform all grain marketing decisions. As basic economics suggests, prices decline when supply is high, and in the United States, supply peaks at harvest. Seasonal averages indicate that the highest soybean prices typically occur in May, June, and July. These months are likely the time to lock in the highest prices when pre-harvest marketing soybeans.
Figure 1: Seasonal Patterns of Kentucky Cash Soybean Prices: 2010-2019 Average vs 2010/11 and 2019/20
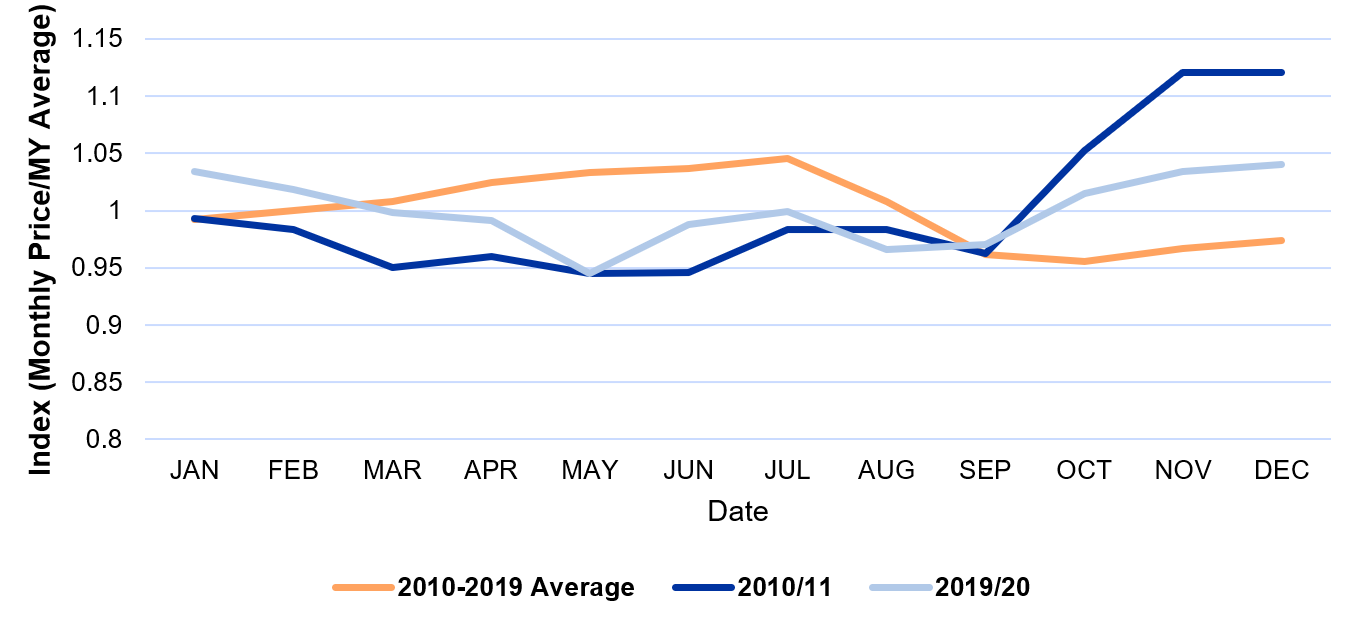
Table 1: Comparison of May 15 and October 15 Futures
| Year | May 15 | October 15 | Change |
|---|---|---|---|
| 2010 | $9.25 | $11.52 | $2.27 |
| 2011 | $13.90 | $12.42 | $1.48 |
| 2012 | $13.96 | $14.79 | $-0.83 |
| 2013 | $15.70 | $12.63 | $3.07 |
| 2014 | $14.82 | $9.31 | $5.51 |
| 2015 | $9.48 | $8.86 | $0.62 |
| 2016 | $10.32 | $9.30 | $1.02 |
| 2017 | $9.28 | $9.48 | $-0.20 |
| 2018 | $9.82 | $8.24 | $1.58 |
| 2019 | $8.59 | $9.34 | $-0.75 |
| 2020 | $8.45 | $10.62 | $-2.17 |
| 2021 | $14.00 | $12.17 | $1.83 |
| 2022 | $15.12 | $13.83 | $-1.29 |
| 2023 | $12.31 | $12.86 | $-0.55 |
Recommended Citation Format:
Gardner, G. "Drivers of Commodity Prices: Seasonality." Economic and Policy Update (24):6, Department of Agricultural Economics, University of Kentucky, June 27th, 2024.
Author(s) Contact Information:
