Grain Profitability Outlook 2025
Grain Profitability Outlook 2025
Grain prices have continued dropping this last year, and this follows a more dramatic drop from the previous year. Current prices for 2025 new-crop delivery are around $4.35/bu for corn, $10.35/bu for soybeans (2/20/25). This is a decrease of around $.10/bu for corn and $1.00/bu for soybeans compared to what these prices were two years ago (see Figure 1). It is a total decrease of around $.80/bu for corn and $2.50/bu for soybeans compared to what these prices were two years ago.
Figure 1. November 2025 Soybean Futures (2/20/2025)
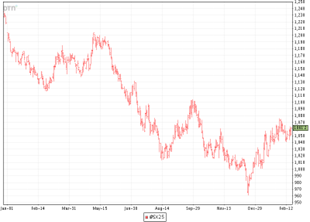
Fertilizer prices came down steadily the previous two years but have remained largely unchanged in the last year. Fuel prices dropped about $.35/gallon and are currently around $2.90/gallon. But overall, there are not a lot of input price decreases to counteract commodity price drops. This article will evaluate the overall effect of all the combined changes, and estimates the expected profitability for the 2025 crop.
Costs for an efficient western Kentucky grain farm are estimated in Table 1 on soil that averages 175 bushels corn and 56 bushels soybeans per acre. Machinery and labor costs include depreciation and overhead costs, as well as an opportunity cost for operator labor. Fuel costs are based on $2.90/gallon on-farm diesel and 40 mile one-way trucking to the elevator. Fertilizer prices are assumed $.46/unit for N, $.61/unit for P, and $.38/unit for K.
Table 1. Project Costs (per acre) Western Kentucky 2025
| Inputs | Corn (175 bu) | Soybeans (56 bu) |
|---|---|---|
| Seed | $110 | $65 |
| Nitrogen | $87 | $0 |
| P, K, and Lime | $76 | $57 |
|
Pesticides |
$85 | $70 |
| Total Inputs | $358 | $192 |
| Machinery and Labor | $192 | $143 |
| Other: | ||
| Drying/Storage | $40 | $7 |
| Crop Insurance | $25 | $20 |
| Misc. | $30 | $30 |
| Land Rent | Variable | Variable |
| Operating Interest | $25 | $15 |
| Total Other | $121 | $72 |
| Total Costs | $671 | $408 |
*Note: Assumes 40 miles one-way trucking, $2.90/gal fuel
Table 2. Summary Gross Return West Kentucky 2025 (per acre)
| Yield and Price | Corn | Soybeans |
|---|---|---|
| Expected Yield (rotation) | 175 | 56 |
| Expected Price | $4.50 | $10.50 |
| Grain Revenue | $788 | $588 |
| Government Payments | $0 | $0 |
| Crop Insurance Payments | $0 | $0 |
| Total Revenue | $788 | $588 |
| Total Costs (Less Land Rent) | $671 | $408 |
| Gross Return (Less Land Rent) | $117 | $180 |
*Note: Does not include land rent. Subtract land rent to get net revenue.
Corn and soybean prices used in this analysis are based on forward contracting prices as of 2/20/25 for an average of fall and winter delivery: $10.50/bu for soybeans and $4.50/bu for corn. Table 2 shows the expected gross return (does not include land rent) given the costs in Table 1 and expected commodity prices and yields.
The expected gross profit for this productivity soil is $117/acre for corn and $180/acre for soybeans. Assuming a 50-50 rotation the average gross return would be $148/acre. Net return would be calculated by subtracting out the land rent. In western Kentucky, much of the ground with this type of productivity is being rented for $175-225/acre. As an example, if we use a $200 land rent, the net return (return to management and risk) for a 50-50 rotation would be a –$52/acre.
Table 3 shows a summary of the estimated gross returns for various soil productivities. Think of these yields as the long-run expected yields for a particular farm, not year-to-year variability. Costs are adjusted to account for different expected yields. The biggest change in costs is for trucking which adjusts on a 1-1 basis, but other costs such as fertilizer are adjusted at a lower rate. Looking at Table 3, it is easy to see how quickly gross profitability changes with expected yield.
Table 3. West Kentucky Gross Returns 2025 (per acre) Base Cost Scenario
$10.50/bu Soybeans, $4.50/bu Corn, $.46-N, $.61-P, $38-K
| Corn Yield (bu) | Soybean Yield (bu) | Gross Return Corn | Gross Return Soybeans | Gross Return Rotation |
|---|---|---|---|---|
| 150 | 49 | $29 | $115 | $72 |
| 175 | 56 | $117 | $180 | $148 |
| 200 | 62 | $204 | $236 | $220 |
| 225 | 68 | $292 | $292 | $292 |
*Note: Subtract land rent to get Net Return.
Note: Central Kentucky has a higher cost structure due to their use of urea as the primary nitrogen source and longer trucking distances to key markets on average. Thus gross returns in this region are likely to be $10-50 per acre lower than those show in Table 3.
The base scenario assumed equipment costs have been kept under control resulting in a depreciation/overhead cost of $75/acre for corn and $65/acre for soybeans. It also assumed a moderate use of fertilizer and other inputs. There are many grain farms that will have a higher structure for one or both costs. Table 4 shows the gross returns adjusted for a $50/acre increased cost structure. Note that even at higher productivity levels, profitability will be challenging here with this cost structure.
Table 4. West Kentucky Gross Returns 2025 (per acre) $50 Increased Cost Scenario
$10.50/bu Soybeans, $4.50/bu Corn, $.46-N, $.61-P, $38-K
| Corn Yield (bu) | Soybean Yield (bu) | Gross Return Corn | Gross Return Soybeans | Gross Return Rotation |
|---|---|---|---|---|
| 150 | 49 | -$21 | $65 | $22 |
| 175 | 56 | $67 | $130 | $98 |
| 200 | 62 | $154 | $186 | $170 |
| 225 | 68 | $242 | $242 | $242 |
*Note: Subtract land rent to get Net Return.
American Relief Act of 2025 may provide some cushion here. Technically, it will be for the 2024 crop but payments but payments will be in 2025. Current estimates per planted acre (not base-acres) will be $43 for corn, $30 for soybeans, and $31 for wheat. The ARC program should provide good downside protection this year based on revenue in the counties I have looked at. You can estimate the protection the ARC or PLC programs will provide by using the tool detailed in the ARC-PLC Decision Tool Instructions and Example article.
Don’t believe my numbers? I appreciate skepticism. Here is a link to corn-soybean budgets so that you can come up with your own estimates: https://agecon.ca.uky.edu/extension/publications-budgets-decision-aids
Recommended Citation Format:
Halich, G. "Grain Profitability Outlook 2025." Economic and Policy Update (25):2, Department of Agricultural Economics, University of Kentucky, February 27, 2025.
Author(s) Contact Information:
